Your shopping cart is empty!
Shopping Cart
0 item(s) - FreeCustomization and Conversion for: Ctrader, MetaTrader(MT4, MT5), Thinkorswim, NinjaTrader, MultiCharts, Tradingview, Prorealtime, SierraChart, etc.
License renew price will be 20% off for the 2nd year and after.
Featured


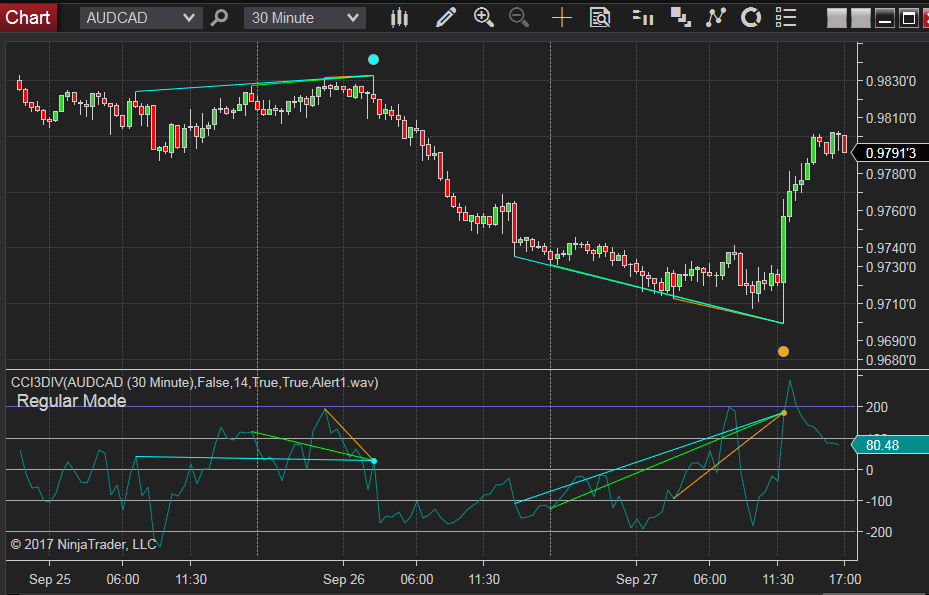
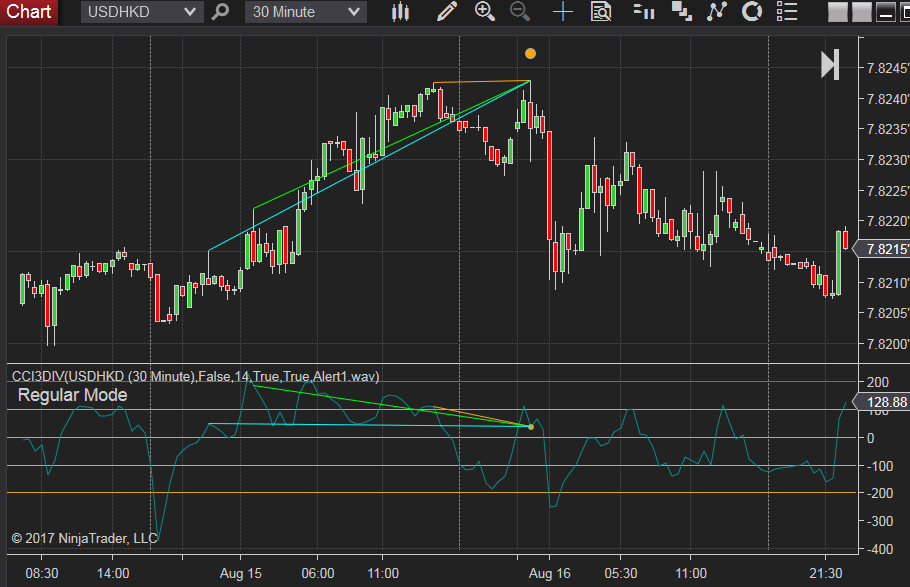
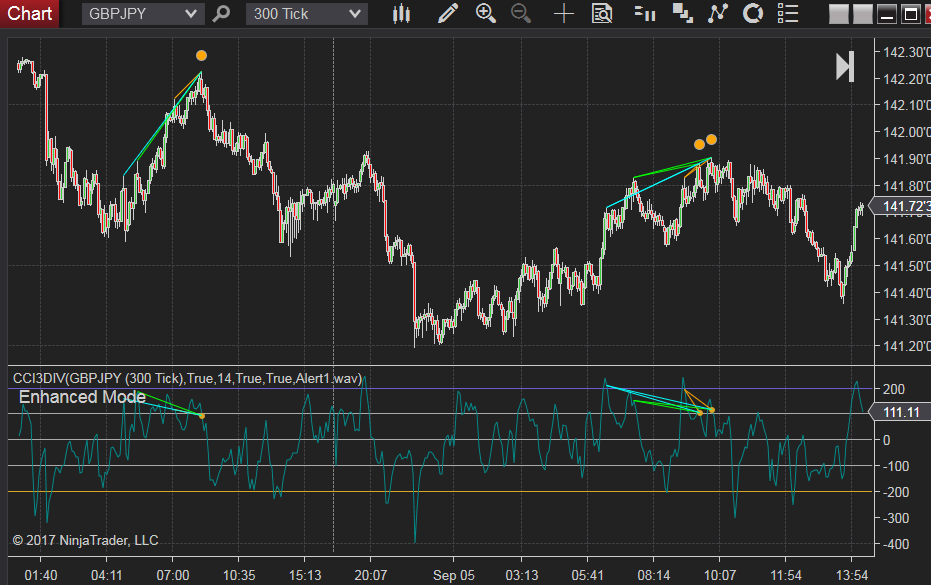
CCI Triple Divergence indicator and Market Analyzer with alert for NinjaTrader 8.

") (
(
Divergence is very common and useful in technical analysis. It indicates possible reversal signals when there are discrepancies between CCI and price movement.
The CCI Divergence Indicator is a powerful tool that combines the momentum-measuring capabilities of the Commodity Channel Index (CCI) with the concept of divergence to identify potential trend reversals and continuations. Its usefulness lies in its ability to spot hidden weaknesses in a trend that may not be apparent from price action alone.
Here's a detailed breakdown of why it's a valuable tool for traders.
1. It Provides Early Warning Signals of Potential Trend Exhaustion
This is the primary and most powerful use of CCI divergence. It can signal that a trend is losing momentum before the price itself actually reverses.
-
What it does: The indicator compares the direction of the price with the direction of the CCI oscillator.
-
Bearish Divergence (Sell Signal): Price makes a higher high, but the CCI makes a lower high. This indicates that while price is pushing to a new extreme, the underlying buying momentum is actually weaker. It's a warning that the uptrend is exhausted and a reversal or pullback is likely.
-
Bullish Divergence (Buy Signal): Price makes a lower low, but the CCI makes a higher low. This indicates that while price is falling to a new low, the underlying selling momentum is waning. It's a warning that the downtrend is exhausted and a reversal or bounce is likely.
-
-
Why it's useful: It allows you to anticipate reversals and exit long positions (or even prepare for short entries) before a major price drop occurs, protecting profits and capital.
2. It Helps Distinguish Between a Pullback and a True Reversal
Not every price dip is a reason to panic. Divergence can help you understand the character of a counter-trend move.
-
What it shows: In a strong uptrend, a pullback will often show bullish divergence (price makes a lower low, CCI makes a higher low). This is a "good" pullback and a potential buying opportunity within the larger trend.
-
Why it's useful: It helps you stay in a trending trade by confirming that the pullback is likely just a pause, not a trend change. This prevents you from being shaken out of a good position prematurely.
3. It Generates High-Probability Entry and Exit Signals
CCI divergence is not meant to be used in isolation; it generates signals that require confirmation for high-probability trades.
-
Entry Signal:
-
For a Long Trade: Identify a bullish divergence. Wait for a confirming price action signal, such as a bullish engulfing pattern or a break above a minor resistance level. Then enter the trade.
-
For a Short Trade: Identify a bearish divergence. Wait for a confirming signal, like a bearish engulfing pattern or a break below a minor support level. Then enter the short.
-
-
Exit Signal: A divergence forming against your position (e.g., a bearish divergence while you are long) is a strong signal to take profits or tighten your stop-loss.
4. It Works on Any Timeframe and Any Market
The principles of momentum divergence are universal.
-
What it does: Whether you're a day trader on a 5-minute chart or a long-term investor on a weekly chart, the CCI Divergence indicator can identify momentum shifts.
-
Why it's useful: The methodology is consistent and scalable. A divergence on a weekly chart signals a major trend change, while a divergence on a 1-minute chart signals a short-term reversal.
Crucial Limitations and Tips for Use
-
It is a Warning, Not a Signal: This is the most important point. Divergence alone is not a reason to enter a trade. It only tells you that momentum is slowing, not that the trend has reversed. The trend can continue for a long time (a phenomenon called "divergence divergence") without reversing. Always wait for price action confirmation (a break of a trendline, a key level, or a reversal candlestick pattern).
-
Avoid "Noise" on Low Timeframes: On very short timeframes (e.g., 1-minute charts), divergence can appear frequently and lead to false signals. It is most reliable on higher timeframes (1-hour, 4-hour, Daily).
-
Adjust CCI Settings: The standard setting for CCI is 20 periods. Sometimes adjusting this to 14 or 50 can help smooth the oscillator and identify more meaningful divergences, reducing noise.
-
Use in Confluence: A CCI divergence signal becomes exponentially more powerful when it occurs at a key:
-
Support or Resistance Level
-
Fibonacci Retracement Level
-
Trend Line
-
Summary: Why the CCI Divergence Indicator is Useful
In essence, the CCI Divergence indicator is useful because it:
-
Spots Hidden Weakness: Reveals slowing momentum that isn't visible on the price chart alone.
-
Provides Early Warnings: Offers a chance to anticipate reversals and manage risk proactively.
-
Filters Trades: Helps distinguish strong trends from weakening ones, allowing you to avoid low-probability entries.
-
Is a Universal Tool: Works across all markets and timeframes, providing a consistent framework for analysis.
It is the ultimate tool for the trader who wants to understand not just what the price is doing, but how it is doing it—the underlying force and momentum behind the move. When used correctly as a warning system to be confirmed by price, it is an invaluable part of a technical trader's toolkit.
The definition of divergence is when price and indicator move in different direction, for instance, when price is in uptrend and reaches a higher high where the indicator is in downtrend.
Update Notes: new features and inputs are added.
- Wait 1 bar: enable this new feature will display the signal 1 bar later in order to check the trend direction of both price and related indicator, otherwise, it will display the signal on current bar. We consider this feature as a 1 bar confirmation for divergence signals.
- Swing Length: this input is used to define the previous peak and trough of price trend, please check this page for more info about what is swing point, swing high and swing low.

The chart below is when "wait 1 bar" disabled.
.png)
The same chart below is with "wait 1 bar" enabled.
The "wait 1 bar" feature will be able to filter out unnecessary signals before the price trend direction reverse.
.png)
By using different swing length, the divergence indicator will be able to detect from short trend to long trend divergence signals.(please check this page for more info about what is swing point, swing high and swing low.)
The chart below used swing length=12, it's a relatively midterm setting based on number of bars on the chart, not based on time or date range. If it's a daily chart, the span will be around 3 months (80 to 90 bars).
.png)
The same chart below used swing length=5, it's a relatively short term setting.
.png)
.png)
The chart below is the extension of the chart above, but we used different SwingLength input, therefore, the signals are different.
.png)
Update Notes: added hidden divergence type.
A hidden divergence is where price has a higher LOW, but the indicator has a relative lower value, as shown in the pic below.

There will be a 'H' drawn under a hidden bullish divergence.
A 'R' drawn under a regular bullish divergence.

It is also true if price has a lower HIGH, but the indicator has a relative higher value.
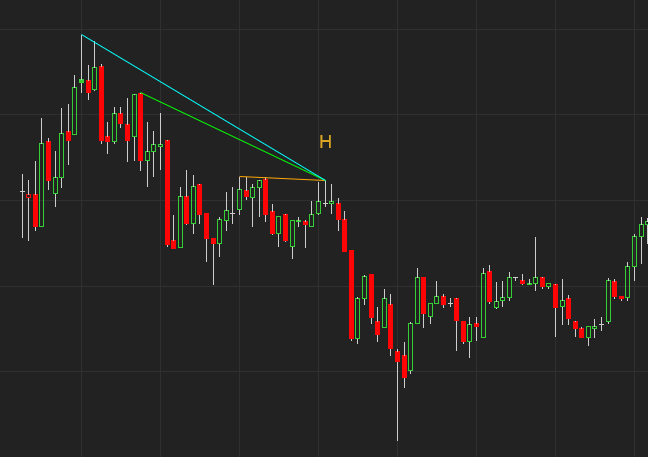
There will be a 'H' drawn under a hidden bearish divergence.
A 'R' drawn under a regular bearish divergence.

What is CCI Triple Divergence?
The concept of triple divergence is intuitional, if there are three continuous divergences in a row between current High and previous peak, then it will trigger a signal.
More signals are not necessary a bad thing, but a signal (Triple Divergence) is confirmed via short, mid and long terms could be more solid.
It doesn't necessarily mean the Triple Divergence is definitely better than the normal version, they detect signals from different angles.
There is no guaranty how many signals you will see in a certain period of time. If it concerns you, please purchase the 1-month trial first.
This video shows how it works in real time.
There are two signals plot, one for bullish signal and one for bearish signal which you can use from strategy and market analyzer.
Features:
- Instant signal on current(last) bar, no repaint.
- Alert when a signal appears.
- Select different sound alert files.
- Enable to show lines between Highs and Lows.
- Please note: it doesn't work in Renko chart.
- Market Analyzer with alert.
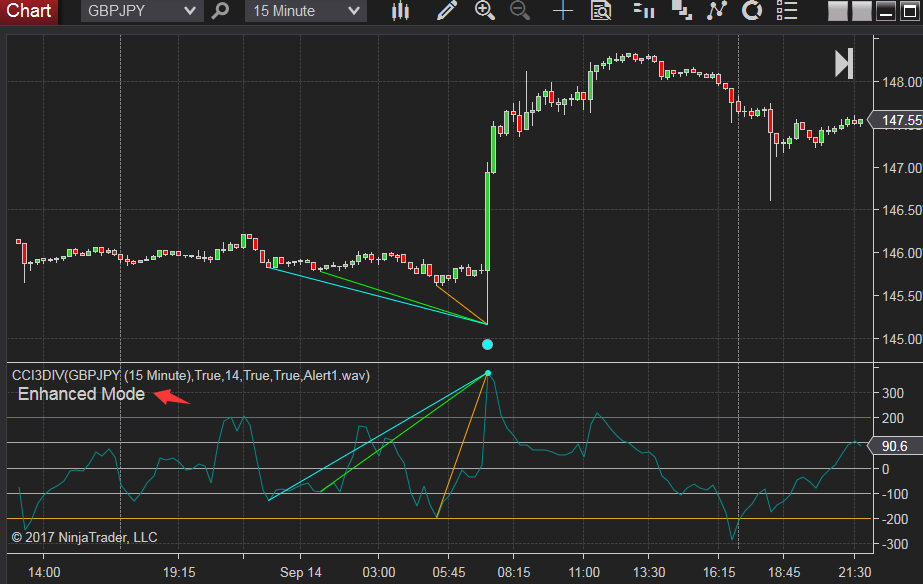
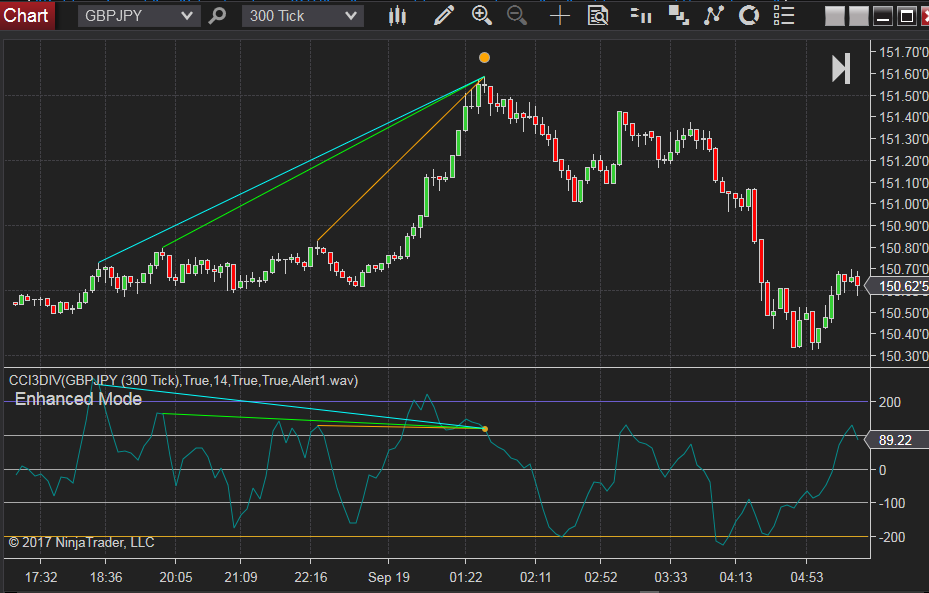
- Enhanced mode will check if all three divergence are consistent
- Works in all timeframes.
You can add new sound files to your NT8\sounds directory.
It also comes with a Market Analyzer which makes it possible to track signals within any timeframe. The input "Range" is used to check if there was a signal within the given number of bars.
You can add more than one column as different timeframes with different settings.

Why Triple Divergence? Is it better than normal divergence?
I have seen many divergence indicators on different platforms, but they only check the divergence in one of the three terms, short-term, midterm or long-term. The regular divergence indicator will not exam all three terms at the same time, but Triple Divergence is capable of completing the task.
Sometimes there are too many divergences appear in a short range for the normal divergence indicator.
Click an image to view at full size.


Write a review
Your Name:Your Review: Note: HTML is not translated!
Rating: Bad Good
Enter the code in the box below:


Latest

Welcome to Patternsmart
Converting your indicator from one platform to another.Custom Alert, Autotrader, Indicators, Scan, Screener, Strategy and Signals.
Copyright @ 2026 Patternsmart - All rights reserved
This website is for educational and informational
purposes only and should not be considered a solicitation to buy or sell a
futures contract or make any other type of investment decision. It's not recommended to use any single indicator as sole evaluation criteria. The companies
and services listed on this website are not to be considered a recommendation
and it is the reader's responsibility to evaluate any product, service, or
company. patternsmart is not responsible for the accuracy or content of any
product, service or company linked to on this website.
Futures trading
contains substantial risk and is not for every investor.Please read the following risk disclosure before considering the
trading of this product:
Futures Risk Disclosure. An investor could
potentially lose all or more than the initial investment. Risk capital is money
that can be lost without jeopardizing ones financial security or life style.
Only risk capital should be used for trading and only those with sufficient risk
capital should consider trading. Past performance is not necessarily indicative
of future results.
Trading stocks, options, futures and forex involves
speculation, and the risk of loss can be substantial.Investor must consider all
relevant risk factors, including their own personal financial situation, before
trading. Trading foreign exchange on margin carries a high level of risk, as
well as its own unique risk factors. Forex investments are subject to
counter-party risk, as there is no central clearing organization for these
transactions. Please read the following risk disclosure before considering the
trading of this product:
Forex Risk Disclosure. Spreads, Straddles, and other multiple-leg option
strategies can entail substantial transaction costs, including multiple
commissions, which may impact any potential return. Options are not suitable for
all investors as the special risks inherent to options trading may expose
investors to potentially rapid and substantial losses. Prior to trading options,
you should carefully read
Characteristics and Risks of Standardized Options.
patternsmart.com
will not be held liable for the loss of money or any damage caused from relying
on the information on this site. Any investment decision you make in your account is solely your responsibility.
TESTIMONIAL DISCLOSURE: TESTIMONIALS APPEARING ON OUR SITE MAY NOT BE REPRESENTATIVE OF THE EXPERIENCE OF OTHER CLIENTS OR CUSTOMERS AND IS NOT A GUARANTEE OF FUTURE PERFORMANCE OR SUCCESS.