Your shopping cart is empty!
Shopping Cart
0 item(s) - FreeCustomization and Conversion for: MetaTrader(MT4, MT5), Thinkorswim, NinjaTrader, MultiCharts, Tradingview, Prorealtime, SierraChart, etc.
License renew price will be 20% off for the 2nd year and after.
Featured


Critical Support & Resistance Level (Supply & Demand Zone) indicator for Tradingview
 indicator for Tradingview")
 indicator for Tradingview")
") (
(VIP member get 20% off, click here to become a VIP member.
This is 1 year access license.
Support & Resistance Level and Supply & Demand Zone are very common and popular jargon in technical analysis.
What is the difference between Support & Resistance Level and Supply & Demand Zone?
In my opinion, Support & Resistance Level is the value of price that tested a couple of times and hard to break. The zone is formed by two adjacent levels where price may oscillate between those two levels.
Imagine the levels as horizontal lines, and the zones are areas between two horizontal lines.
Why are they important?
In a nutshell, they indicate where the price direction may reverse, so you can act accordingly.
There are a couple of methods to draw the Support & Resistance Level and Supply & Demand Zone, In most case, people will use swing high or low, or pivot points as the level. But there are too many of them, and not all pivot points will become Support & Resistance Level.
Some support or resistance level is hard to break, but after the price break through that level, resistance will become support and vice versa, I define it as Critical Level.
If you draw a critical support or resistance level from the current bar and move backward to where it started, you will notice that some levels are formed by the pivot points from hundreds of bars ago. It's impossible to discover the Critical Levels if you don't have enough bars loaded on the chart.
The purpose of this indicator is to plot critical support and resistance level automatically on the chart.
It will work on all market, Stock, Forex and Futures. It also works on all timeframes.
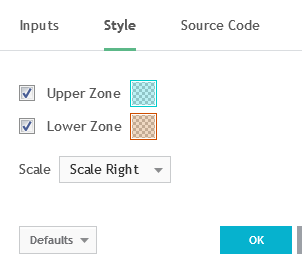
Inputs:
- The Strength inputs control the intensity of Support & Resistance Level.
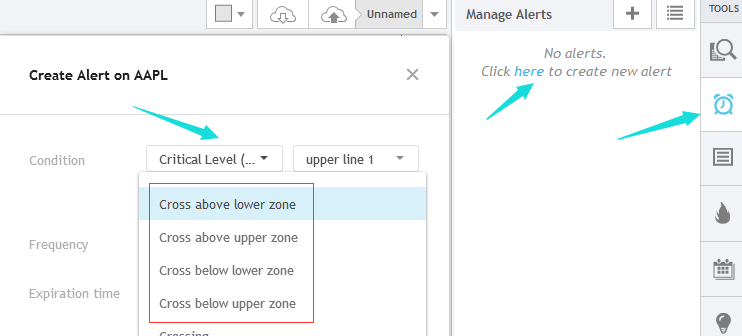
- The Alert input is the switch of alert function.
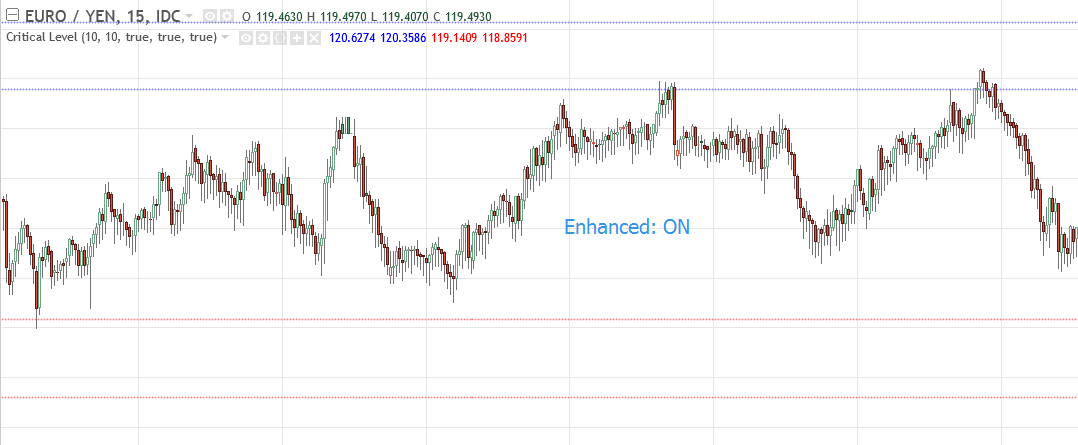
- By enable enhanced mode, the indicator will be more critical.
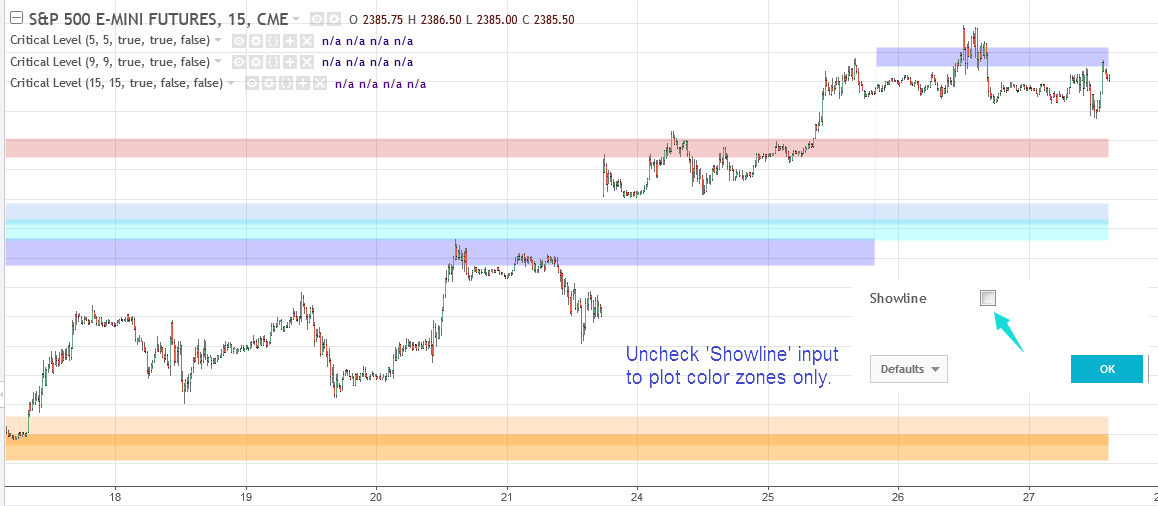
- Check Showline input to plot level lines on chart, otherwise, it will plot zones only.

You are able to turn on/off the Supply & Demand Zone plot.
If the Alert is enabled, it will give alert in the following conditions:
- When close price Cross above upper zone
- When close price Cross below upper zone
- When close price Cross above lower zone
- When close price Cross below lower zone
The following two charts show the difference between Enhanced mode 'ON' and 'OFF'.

The following chart is an example of showing both Support & Resistance Level and Supply & Demand Zone.
The following chart is an example of showing Support & Resistance Level only.
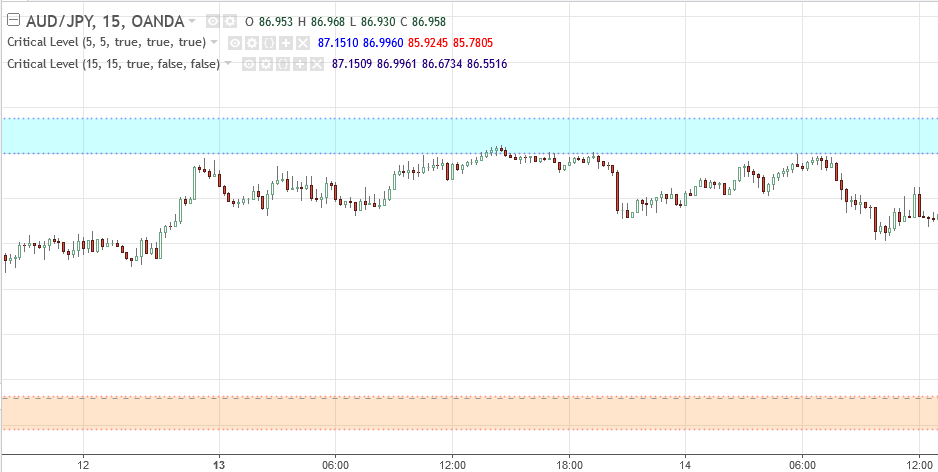
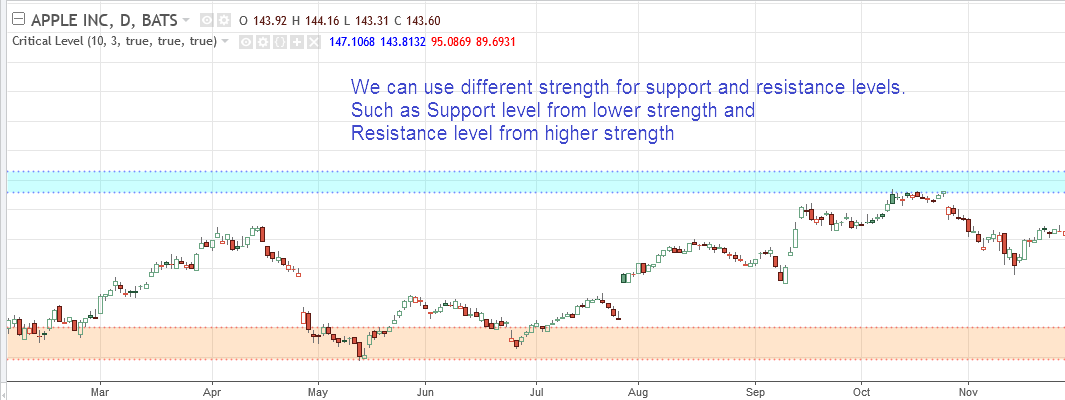
In some situations, to achieve a better result, different Strength values should be used for upper and lower levels, for example, in the chart blow, Strength 8 is used the upper level and 5 is used for the lower.
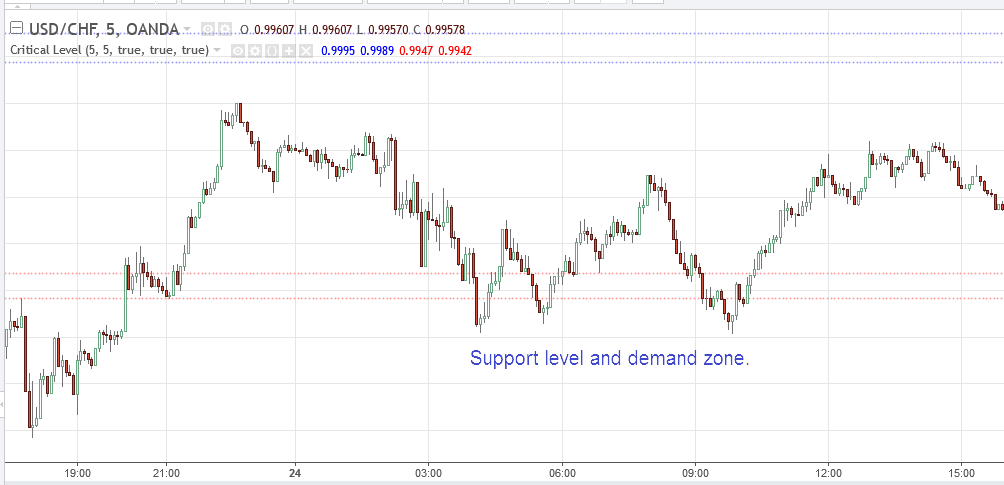
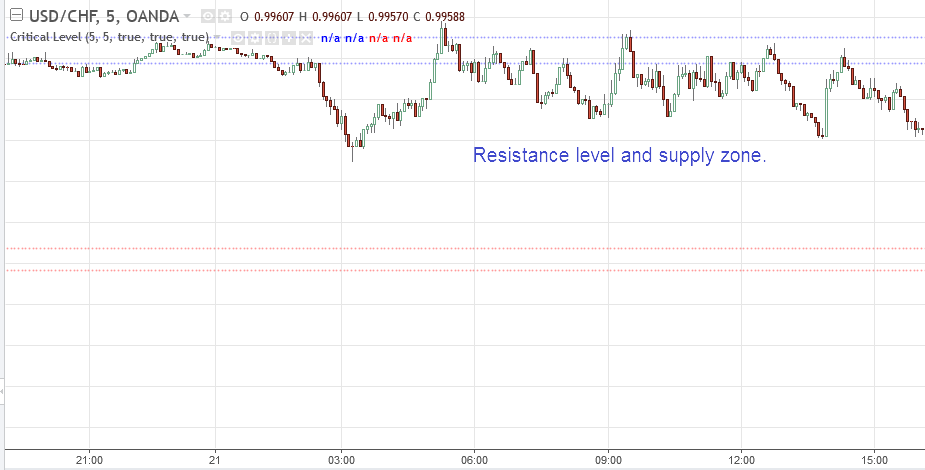
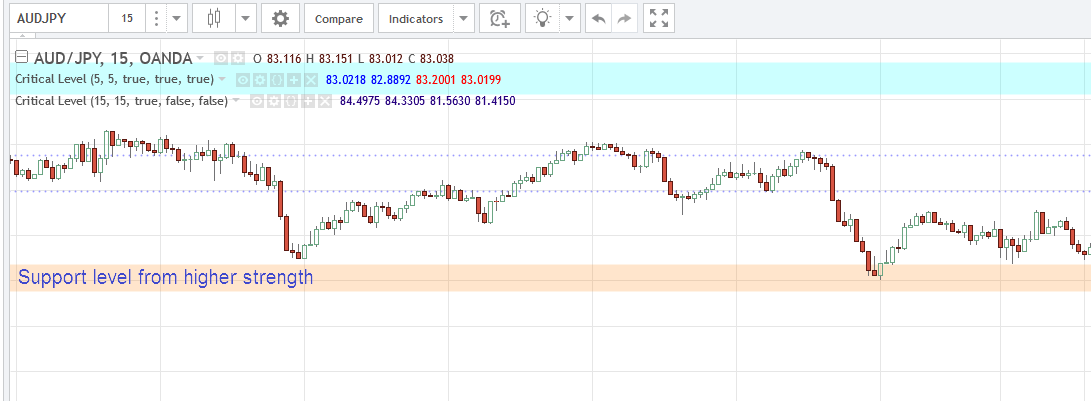
The following chart is an example of using two Critical Level indicators with different Strength inputs, one indicator is to show Support & Resistance Level only, and the another one shows Supply & Demand Zone only.
After the price broke through the Support level and demand zone from lower strength (input 5, the two horizontal lines, shown in light orange color) it became resistance level and supply zone. On the other hand, the Support level and demand zone from higher strength (input 15, the color zone at the bottom) hold steady.

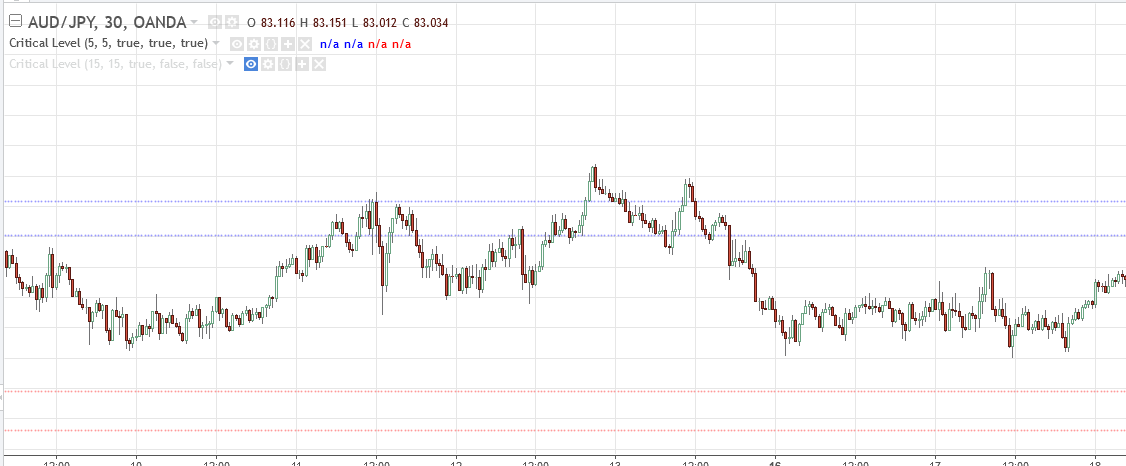
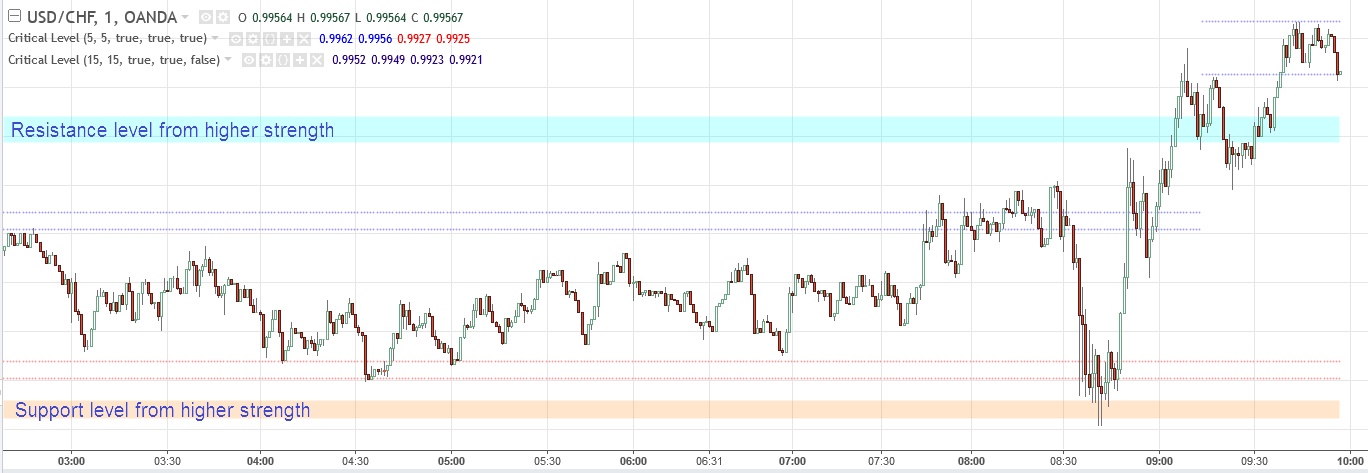
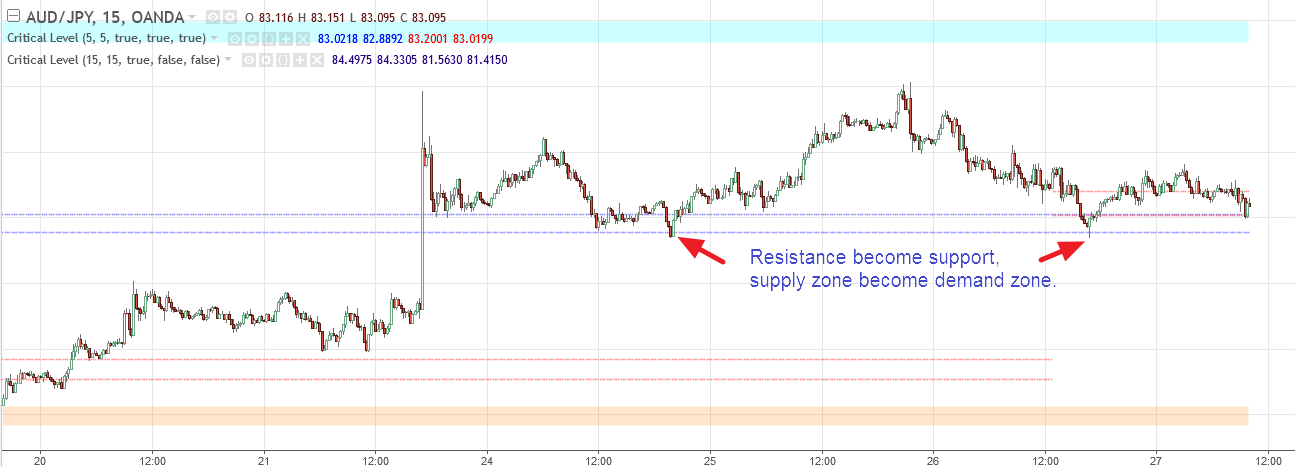
After the breakthrough, resistance will become support and supply zone will become demand zone.
It's a very common phenomenon, just like the chart shown in below.


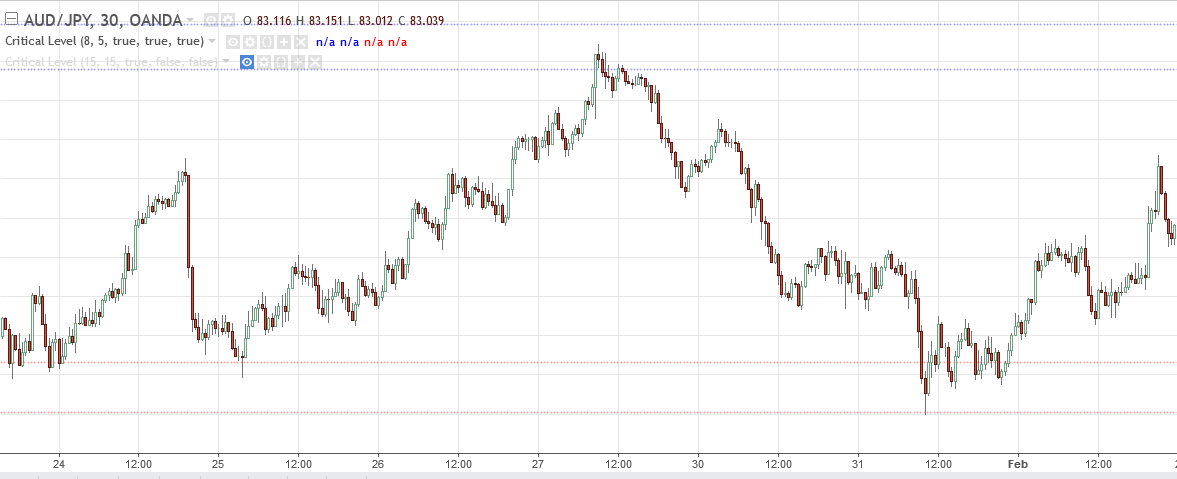
The chart below is an example of how the Critical Level indicator performs in a relatively long period of time.

Sometimes, price may cross over a support level or demand zone couple times until the next level is formed. The following image is a case where price cross above the support level and demand zone the second time, the three subsequent failed breakthrough attempts proved the support level and demand zone became stronger than before.
A critical level is harder to break than a normal support & resistance level.
A good example of support level which was built hundreds of bars ago.

How price reacts to different combinations of critical level.
Write a review
Your Name:Your Review: Note: HTML is not translated!
Rating: Bad Good
Enter the code in the box below:


Latest


Welcome to Patternsmart
Converting your indicator from one platform to another.Custom Alert, Autotrader, Indicators, Scan, Screener, Strategy and Signals.
Copyright @ 2023 Patternsmart - All rights reserved
This website is for educational and informational
purposes only and should not be considered a solicitation to buy or sell a
futures contract or make any other type of investment decision. It's not recommended to use any single indicator as sole evaluation criteria. The companies
and services listed on this website are not to be considered a recommendation
and it is the reader's responsibility to evaluate any product, service, or
company. patternsmart is not responsible for the accuracy or content of any
product, service or company linked to on this website.
Futures trading
contains substantial risk and is not for every investor.Please read the following risk disclosure before considering the
trading of this product:
Futures Risk Disclosure. An investor could
potentially lose all or more than the initial investment. Risk capital is money
that can be lost without jeopardizing ones financial security or life style.
Only risk capital should be used for trading and only those with sufficient risk
capital should consider trading. Past performance is not necessarily indicative
of future results.
Trading stocks, options, futures and forex involves
speculation, and the risk of loss can be substantial.Investor must consider all
relevant risk factors, including their own personal financial situation, before
trading. Trading foreign exchange on margin carries a high level of risk, as
well as its own unique risk factors. Forex investments are subject to
counter-party risk, as there is no central clearing organization for these
transactions. Please read the following risk disclosure before considering the
trading of this product:
Forex Risk Disclosure. Spreads, Straddles, and other multiple-leg option
strategies can entail substantial transaction costs, including multiple
commissions, which may impact any potential return. Options are not suitable for
all investors as the special risks inherent to options trading may expose
investors to potentially rapid and substantial losses. Prior to trading options,
you should carefully read
Characteristics and Risks of Standardized Options.
patternsmart.com
will not be held liable for the loss of money or any damage caused from relying
on the information on this site. Any investment decision you make in your account is solely your responsibility.
TESTIMONIAL DISCLOSURE: TESTIMONIALS APPEARING ON OUR SITE MAY NOT BE REPRESENTATIVE OF THE EXPERIENCE OF OTHER CLIENTS OR CUSTOMERS AND IS NOT A GUARANTEE OF FUTURE PERFORMANCE OR SUCCESS.