Your shopping cart is empty!
Shopping Cart
0 item(s) - FreeCustomization and Conversion for: MetaTrader(MT4, MT5), Thinkorswim, NinjaTrader, MultiCharts, Tradingview, Prorealtime, SierraChart, etc.
License renew price will be 20% off for the 2nd year and after.
Featured

Triangle Chart pattern indicator with Market Analyzer for NinjaTrader 8


") (
(Please note that this purchase is a 1-Year license. About License renew.
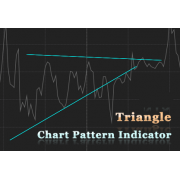
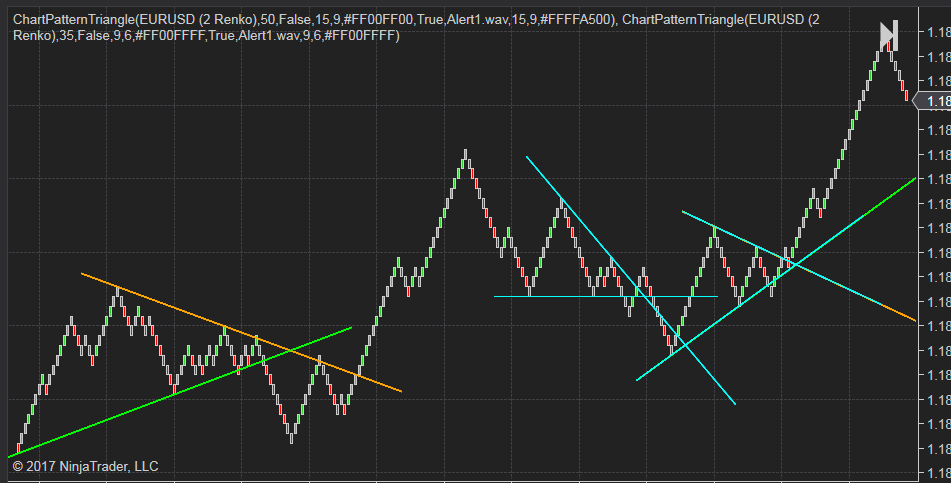
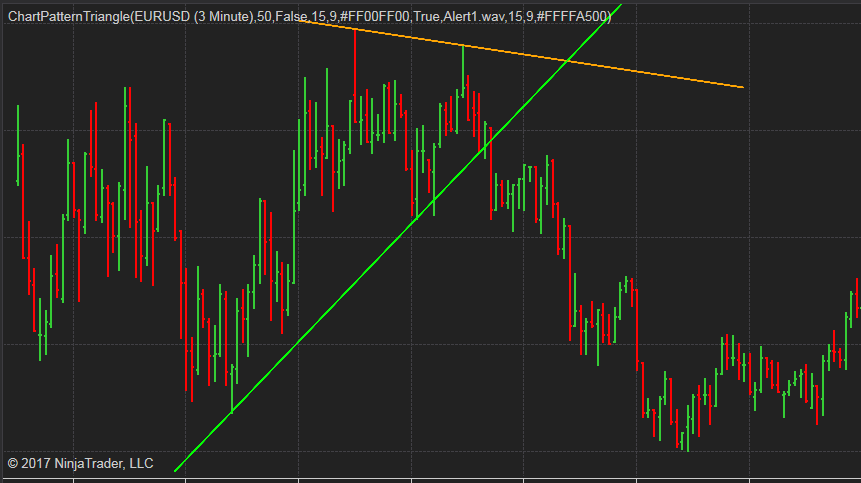
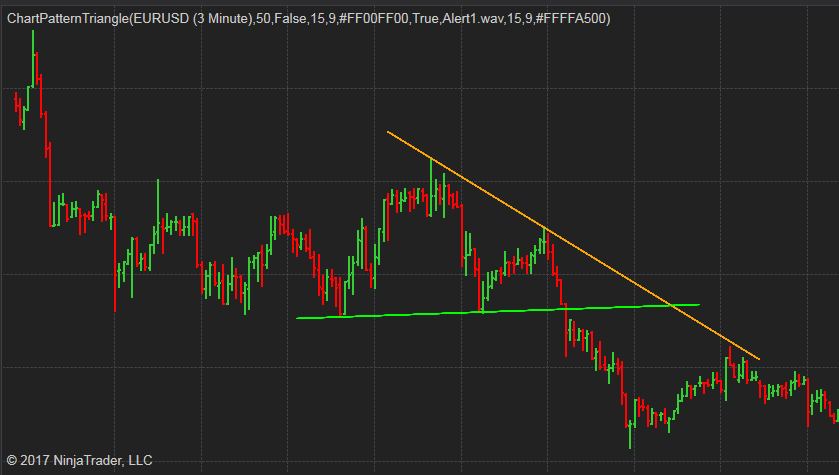
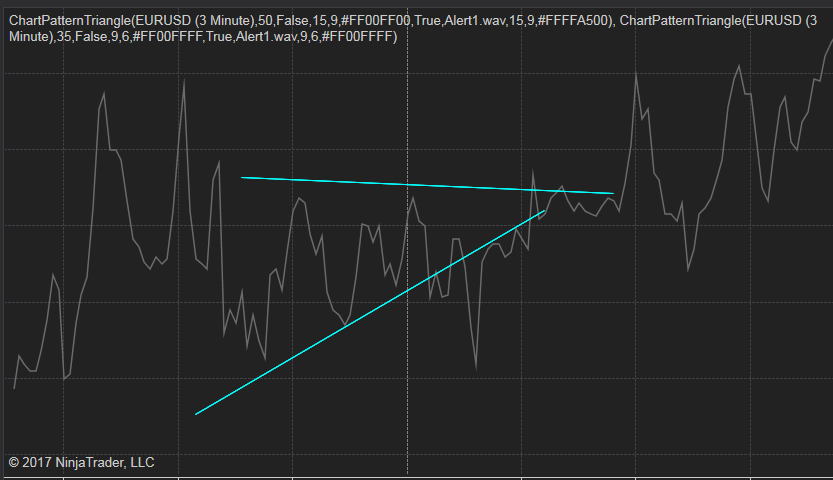
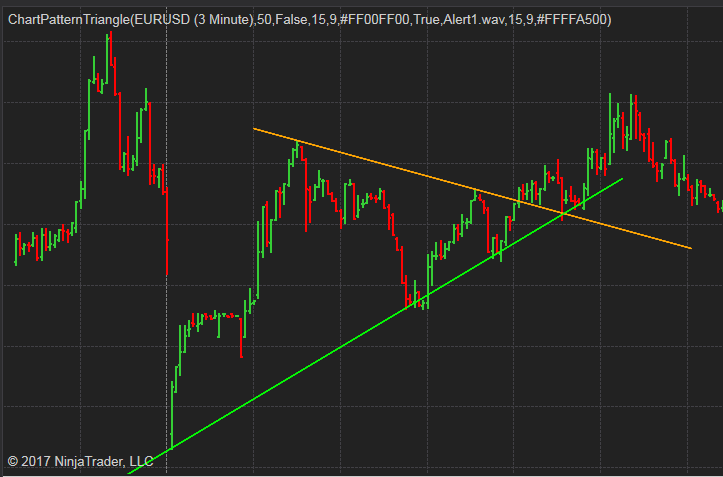
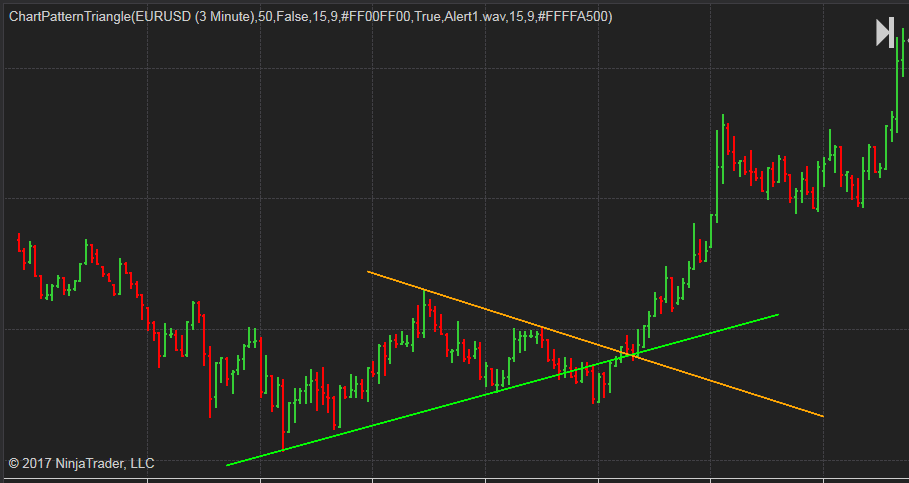
This indicator will automatically detect all three types of triangle chart patterns, the symmetrical triangle, the descending triangle and the ascending triangle.
It will draw two trend lines of the triangle on the chart when the pattern is formed.
Features:
- Drawing Triangle chart pattern for both real-time and historical data.
- Adjustable length of pattern legs.
- Using different combination of parameters, you can easily identify the Triangle pattern in short term, midterm and long term.
- It works on most of the time frames and chart types, including: minutes, daily, weekly, monthly, tick, renko, range, Heiken Ashi, etc.
- It works on all markets and symbols.
- Adjustable length of extension lines.
- Switch for showing the latest pattern only or show all history patterns found on chart.
- Select different sound alert files with switch.
- Editable trend line color.
- Show Fibonacci retracement automatically.
There is a plot that can be used from other NinjaScript, such as Strategy and Market Analyzer.
They will show up on current bar, no delay, no repaint or back-paint.
In default, the color is transparent, if you need to see the plots on the chart, just change its color to your desired ones.

This video shows how it works in real time.

The following image shows how alert works, whenever a Triangle pattern is detected you should be able to hear the alert sound. If the Alert log window is opened, you can also see the alert message listed there.

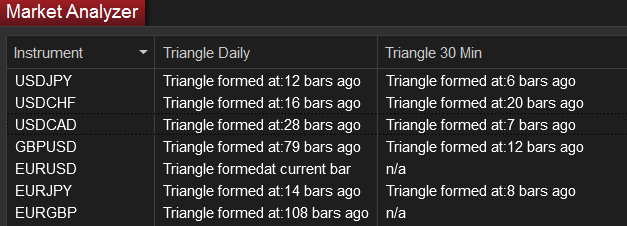
It also comes with a standalone Market Analyzer script.
This Market Analyzer script is able to show when the latest Triangle Chart pattern formed within a given range.
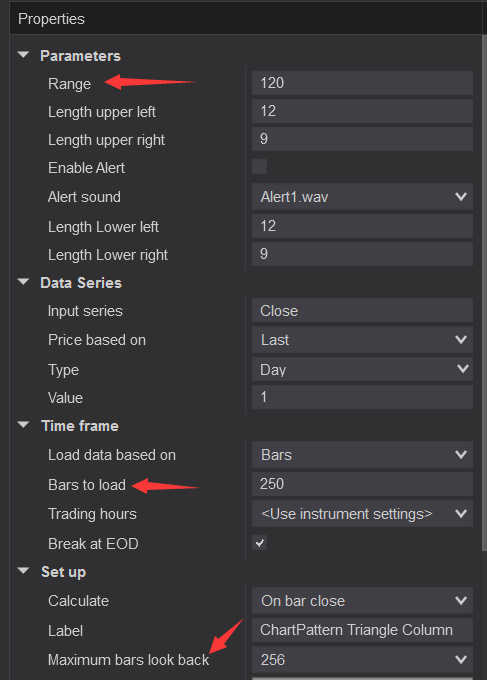
The only input you need to pay attention is the "Range" input, it defines the number of bars used to check when the latest Triangle Chart pattern formed.
Make sure the "Range" input is less than "Bars to load" and "Max bar look bar" settings.
It's better to use a relatively large number for "Bars to load", such as 500, depends on your "Range" input.
The following image is an example of how the Market Analyzer Column display.
In order to match the result on both chart and Market Analyzer, make sure the inputs used are exactly the same on both sides.
Click an image to view at full size
|
|
|
||||


Write a review
Your Name:Your Review: Note: HTML is not translated!
Rating: Bad Good
Enter the code in the box below:


-80x80.png)


Latest


Welcome to Patternsmart
Converting your indicator from one platform to another.Custom Alert, Autotrader, Indicators, Scan, Screener, Strategy and Signals.
Copyright @ 2023 Patternsmart - All rights reserved
This website is for educational and informational
purposes only and should not be considered a solicitation to buy or sell a
futures contract or make any other type of investment decision. It's not recommended to use any single indicator as sole evaluation criteria. The companies
and services listed on this website are not to be considered a recommendation
and it is the reader's responsibility to evaluate any product, service, or
company. patternsmart is not responsible for the accuracy or content of any
product, service or company linked to on this website.
Futures trading
contains substantial risk and is not for every investor.Please read the following risk disclosure before considering the
trading of this product:
Futures Risk Disclosure. An investor could
potentially lose all or more than the initial investment. Risk capital is money
that can be lost without jeopardizing ones financial security or life style.
Only risk capital should be used for trading and only those with sufficient risk
capital should consider trading. Past performance is not necessarily indicative
of future results.
Trading stocks, options, futures and forex involves
speculation, and the risk of loss can be substantial.Investor must consider all
relevant risk factors, including their own personal financial situation, before
trading. Trading foreign exchange on margin carries a high level of risk, as
well as its own unique risk factors. Forex investments are subject to
counter-party risk, as there is no central clearing organization for these
transactions. Please read the following risk disclosure before considering the
trading of this product:
Forex Risk Disclosure. Spreads, Straddles, and other multiple-leg option
strategies can entail substantial transaction costs, including multiple
commissions, which may impact any potential return. Options are not suitable for
all investors as the special risks inherent to options trading may expose
investors to potentially rapid and substantial losses. Prior to trading options,
you should carefully read
Characteristics and Risks of Standardized Options.
patternsmart.com
will not be held liable for the loss of money or any damage caused from relying
on the information on this site. Any investment decision you make in your account is solely your responsibility.
TESTIMONIAL DISCLOSURE: TESTIMONIALS APPEARING ON OUR SITE MAY NOT BE REPRESENTATIVE OF THE EXPERIENCE OF OTHER CLIENTS OR CUSTOMERS AND IS NOT A GUARANTEE OF FUTURE PERFORMANCE OR SUCCESS.