Your shopping cart is empty!
Shopping Cart
0 item(s) - FreeCustomization and Conversion for: MetaTrader(MT4, MT5), Thinkorswim, NinjaTrader, MultiCharts, Tradingview, Prorealtime, SierraChart, etc.
License renew price will be 20% off for the 2nd year and after.
Featured
Auto Fibonacci Fan indicator for tradingview


") (
(This tradingview indicator is able to draw the Fibonacci Fan automatically on the chart based on the input range of bars.
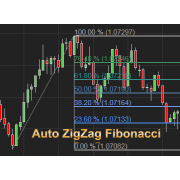
The lines of a Fibonacci fan used Fibonacci ratios determined by the Fibonacci series, typically 23.6 percent, 38.2 percent, 50 percent, 61.8 percent and 80.9 percent. They can be used to estimate support and resistance levels.
Fibonacci fan is a practical technique that uses Fibonacci ratios to draw out levels of support and resistance, see chart below as an example.
As the chart below shows, the fan lines can be either upwards (rising Fibonacci Fan) or downwards (Falling Fibonacci Fan), and the lines are drawn using Fibonacci ratios, typically 23.6%, 38.2%, 50%, 61.8% and 80.9%.
The video below shows how it works in real time.
.png)
How does it work?
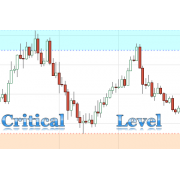
It helps to identify potential support/resistance as price moves towards to or along the Fibonacci Fan lines.
- Show Level Label, enable to show the fibo level labels.
- Range, it's the number of bars used to detect the highest and lowest price. The default value is 150 it means the indicator will plot the Fibonacci Fan based on the price range of last 150 bars.
- If you want to use different ratios other than the default ones, you can change them from input Level1 to Level5.
- You can change the color of each level line, from bottom to top.
- The highest and lowest level are auto-detected and update in real-time.
.png)
.png)
It works exactly the same as our Auto Fibonacci Fan indicator for MultiCharts, you can also get more info from there.
As circled in red in the chart below, price fails to break out 38.2% fan line twice, which make it a potential resistance level.
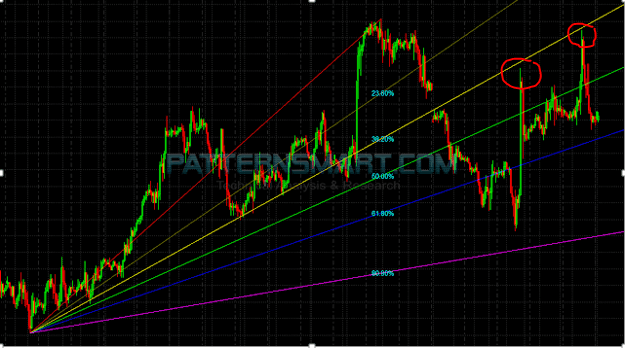
As circled in red in chart below, price bounces back after it moved close to 61.8% in three occasions, which made it a good support level in the upward trend. However, this is also a classic example of why Fibonacci Fan indicator should not be used alone to predict future reversals, after the price done flirting with 61.8% for the third time, it traded right through it and only stopped at next fan line 80.9%.

In the chart below, price moved along 50% fan line for an extend period of time, which shows demand is weakening, and the market is looking for directions either way. In times like this, some traders prefer to stay on the sidelines until a definitive signal is emerged and confirmed.

Write a review
Your Name:Your Review: Note: HTML is not translated!
Rating: Bad Good
Enter the code in the box below:


Latest


Welcome to Patternsmart
Converting your indicator from one platform to another.Custom Alert, Autotrader, Indicators, Scan, Screener, Strategy and Signals.
Copyright @ 2023 Patternsmart - All rights reserved
This website is for educational and informational
purposes only and should not be considered a solicitation to buy or sell a
futures contract or make any other type of investment decision. It's not recommended to use any single indicator as sole evaluation criteria. The companies
and services listed on this website are not to be considered a recommendation
and it is the reader's responsibility to evaluate any product, service, or
company. patternsmart is not responsible for the accuracy or content of any
product, service or company linked to on this website.
Futures trading
contains substantial risk and is not for every investor.Please read the following risk disclosure before considering the
trading of this product:
Futures Risk Disclosure. An investor could
potentially lose all or more than the initial investment. Risk capital is money
that can be lost without jeopardizing ones financial security or life style.
Only risk capital should be used for trading and only those with sufficient risk
capital should consider trading. Past performance is not necessarily indicative
of future results.
Trading stocks, options, futures and forex involves
speculation, and the risk of loss can be substantial.Investor must consider all
relevant risk factors, including their own personal financial situation, before
trading. Trading foreign exchange on margin carries a high level of risk, as
well as its own unique risk factors. Forex investments are subject to
counter-party risk, as there is no central clearing organization for these
transactions. Please read the following risk disclosure before considering the
trading of this product:
Forex Risk Disclosure. Spreads, Straddles, and other multiple-leg option
strategies can entail substantial transaction costs, including multiple
commissions, which may impact any potential return. Options are not suitable for
all investors as the special risks inherent to options trading may expose
investors to potentially rapid and substantial losses. Prior to trading options,
you should carefully read
Characteristics and Risks of Standardized Options.
patternsmart.com
will not be held liable for the loss of money or any damage caused from relying
on the information on this site. Any investment decision you make in your account is solely your responsibility.
TESTIMONIAL DISCLOSURE: TESTIMONIALS APPEARING ON OUR SITE MAY NOT BE REPRESENTATIVE OF THE EXPERIENCE OF OTHER CLIENTS OR CUSTOMERS AND IS NOT A GUARANTEE OF FUTURE PERFORMANCE OR SUCCESS.