Your shopping cart is empty!
Shopping Cart
0 item(s) - FreeCustomization and Conversion for: MetaTrader(MT4, MT5), Thinkorswim, NinjaTrader, MultiCharts, Tradingview, Prorealtime, SierraChart, etc.
License renew price will be 20% off for the 2nd year and after.
Featured

ADX Divergence Indicator all-in-one package for Thinkorswim

") (
(VIP member get 10% off, click here to become a VIP member.
This ADX divergence Indicator all-in-one package for Thinkorswim includes:
The Average Directional Index (ADX) divergence indicator is a technical analysis tool to determine the strength of a trend in a financial market. It can also be used to identify potential trend reversals.
The ADX indicator is typically shown as a line on a separate window below the main chart. The ADX line will fluctuate between 0 and 100, with readings above 25 indicating a strong trend and below 20 indicating a weak trend. A useful application of the ADX indicator is to confirm trend breakouts.
When a security's price breaks out above resistance or below support, it can indicate a change in trend. However, these breakouts can also be false, and traders should wait for confirmation before taking action. By using the ADX indicator, traders can confirm that a breakout is indeed a valid trend change by looking for an increase in the ADX reading above 25. Traders should also pay attention to the trend of the ADX line itself. If the ADX line is trending upward, it can indicate that a trend is gaining strength, while if the ADX line is trending downward, it can indicate that a trend is losing strength. Traders can use this information to adjust their trading strategy accordingly.
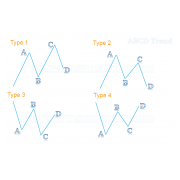
After studying the ADX line, the main action is to look for the divergence between the ADX line and the price action of the financial market you are analyzing. Divergence occurs when the ADX line is moving in the opposite direction of the price. For example, if the price of a security is making new highs, but the ADX line is failing to make new highs, this could indicate that the trend is losing momentum, and a potential reversal could be coming. Traders can use this bearish divergence as a single to either enter a short position or exit a long position. On the contrary, if the price of a security is making new lows, but the ADX line is failing to make new lows, this could indicate that the trend is still strong and a reversal is not likely.
It's also important to note that the ADX indicator is a lagging indicator, meaning it will only confirm a trend change after it has occurred. Therefore, it's best to use the ADX indicator in conjunction with leading indicators, such as moving averages or TPR, to get a more complete picture of the market.
In conclusion, the ADX divergence indicator can be a valuable tool for analyzing financial markets and identifying potential trend changes. By identifying trend strength, confirming trend breakouts, paying attention to the trend of the ADX line itself and looking for divergence between the ADX line and the price action, traders can gain valuable insight into the strength and direction of a trend. However, using this indicator in conjunction with other technical analysis tools and techniques is important for a more complete market analysis.
No matter what kind of strategy you have, timing is one of the most important elements in trading.
Everyone wants to be one step ahead of the game. But how and is it even possible?
A lot of traders rely on ADX indicator and most of them spend their day to stare at the charts for hours and waiting for ADX divergence to happen on current bar. Experienced traders can manage to follow multiple charts at the same time, if you are one of them, you know you have been doing this for years.
Now, imagine an indicator can automatically generate a sound alert whenever there is an ADX Divergence on the chart, if you are away from your computer it can even send you an SMS. This is one step ahead of others.
If you need to watch dozens of symbols at the same time, the chart indicator cannot give signals for all of them unless you open dozens of charts which obviously not an option. In order to get Divergence signals for all symbols in your watchlist, the ADX Divergence Custom Quotes is your best solution. It's capable to show Divergence signals in all timeframes you chose with separate columns. This is another step ahead of others.
If you don't want to wait for the signals to appear on watchlist, the ADX Divergence SCAN makes it possible for you to search the whole market with ADX Divergence together with any other criteria you like to add.
With these three products together, you are a few steps ahead of others.This ADX divergence Indicator all-in-one package for Thinkorswim includes:
- ADX Divergence indicator for Thinkorswim TOS
- ADX Divergence signals Custom Quotes for Thinkorswim TOS
- Advanced ADX Divergence SCAN for Thinkorswim TOS
The Average Directional Index (ADX) divergence indicator is a technical analysis tool to determine the strength of a trend in a financial market. It can also be used to identify potential trend reversals.
The ADX indicator is typically shown as a line on a separate window below the main chart. The ADX line will fluctuate between 0 and 100, with readings above 25 indicating a strong trend and below 20 indicating a weak trend. A useful application of the ADX indicator is to confirm trend breakouts.
When a security's price breaks out above resistance or below support, it can indicate a change in trend. However, these breakouts can also be false, and traders should wait for confirmation before taking action. By using the ADX indicator, traders can confirm that a breakout is indeed a valid trend change by looking for an increase in the ADX reading above 25. Traders should also pay attention to the trend of the ADX line itself. If the ADX line is trending upward, it can indicate that a trend is gaining strength, while if the ADX line is trending downward, it can indicate that a trend is losing strength. Traders can use this information to adjust their trading strategy accordingly.
After studying the ADX line, the main action is to look for the divergence between the ADX line and the price action of the financial market you are analyzing. Divergence occurs when the ADX line is moving in the opposite direction of the price. For example, if the price of a security is making new highs, but the ADX line is failing to make new highs, this could indicate that the trend is losing momentum, and a potential reversal could be coming. Traders can use this bearish divergence as a single to either enter a short position or exit a long position. On the contrary, if the price of a security is making new lows, but the ADX line is failing to make new lows, this could indicate that the trend is still strong and a reversal is not likely.
It's also important to note that the ADX indicator is a lagging indicator, meaning it will only confirm a trend change after it has occurred. Therefore, it's best to use the ADX indicator in conjunction with leading indicators, such as moving averages or TPR, to get a more complete picture of the market.
In conclusion, the ADX divergence indicator can be a valuable tool for analyzing financial markets and identifying potential trend changes. By identifying trend strength, confirming trend breakouts, paying attention to the trend of the ADX line itself and looking for divergence between the ADX line and the price action, traders can gain valuable insight into the strength and direction of a trend. However, using this indicator in conjunction with other technical analysis tools and techniques is important for a more complete market analysis.
Write a review
Your Name:Your Review: Note: HTML is not translated!
Rating: Bad Good
Enter the code in the box below:
Latest


Welcome to Patternsmart
Converting your indicator from one platform to another.Custom Alert, Autotrader, Indicators, Scan, Screener, Strategy and Signals.
Copyright @ 2023 Patternsmart - All rights reserved
This website is for educational and informational
purposes only and should not be considered a solicitation to buy or sell a
futures contract or make any other type of investment decision. It's not recommended to use any single indicator as sole evaluation criteria. The companies
and services listed on this website are not to be considered a recommendation
and it is the reader's responsibility to evaluate any product, service, or
company. patternsmart is not responsible for the accuracy or content of any
product, service or company linked to on this website.
Futures trading
contains substantial risk and is not for every investor.Please read the following risk disclosure before considering the
trading of this product:
Futures Risk Disclosure. An investor could
potentially lose all or more than the initial investment. Risk capital is money
that can be lost without jeopardizing ones financial security or life style.
Only risk capital should be used for trading and only those with sufficient risk
capital should consider trading. Past performance is not necessarily indicative
of future results.
Trading stocks, options, futures and forex involves
speculation, and the risk of loss can be substantial.Investor must consider all
relevant risk factors, including their own personal financial situation, before
trading. Trading foreign exchange on margin carries a high level of risk, as
well as its own unique risk factors. Forex investments are subject to
counter-party risk, as there is no central clearing organization for these
transactions. Please read the following risk disclosure before considering the
trading of this product:
Forex Risk Disclosure. Spreads, Straddles, and other multiple-leg option
strategies can entail substantial transaction costs, including multiple
commissions, which may impact any potential return. Options are not suitable for
all investors as the special risks inherent to options trading may expose
investors to potentially rapid and substantial losses. Prior to trading options,
you should carefully read
Characteristics and Risks of Standardized Options.
patternsmart.com
will not be held liable for the loss of money or any damage caused from relying
on the information on this site. Any investment decision you make in your account is solely your responsibility.
TESTIMONIAL DISCLOSURE: TESTIMONIALS APPEARING ON OUR SITE MAY NOT BE REPRESENTATIVE OF THE EXPERIENCE OF OTHER CLIENTS OR CUSTOMERS AND IS NOT A GUARANTEE OF FUTURE PERFORMANCE OR SUCCESS.