
Your shopping cart is empty!
Shopping Cart
0 item(s) - FreeCustomization and Conversion for: Ctrader, MetaTrader(MT4, MT5), Thinkorswim, NinjaTrader, MultiCharts, Tradingview, Prorealtime, SierraChart, etc.
License renew price will be 20% off for the 2nd year and after.
Featured





Momentum Double divergence indicator with alert for NinjaTrader 8.

 (
(Identify Momentum Shifts with Professional Double Divergence Analysis
Markets rarely reverse without warning. In many cases, price continues pushing higher or lower while underlying momentum begins to lose conviction. Recognizing these subtle changes before they become obvious on the chart is one of the ongoing challenges faced by experienced traders.
Momentum analysis helps address this problem by measuring the strength behind price movement rather than focusing solely on price itself. When momentum and price no longer move in harmony, traders often begin looking for additional evidence that market conditions may be changing. This is where the Momentum Double Divergence Indicator for NinjaTrader 8 provides valuable analytical support, combining momentum evaluation with PatternSmart's structured Double Divergence methodology.
Understanding Momentum in Technical Analysis
Momentum reflects the rate at which prices accelerate or decelerate. Strong trends are typically supported by healthy momentum, while weakening momentum may indicate that buying or selling pressure is becoming less convincing.
A slowing momentum reading does not automatically signal a reversal. Markets can remain overextended longer than expected. However, when weakening momentum appears alongside developing divergence, it may provide additional confirmation that traders should evaluate current market conditions more carefully.
Professional analysts therefore use momentum as part of a broader decision-making process rather than as a standalone signal.
Why Double Divergence Matters
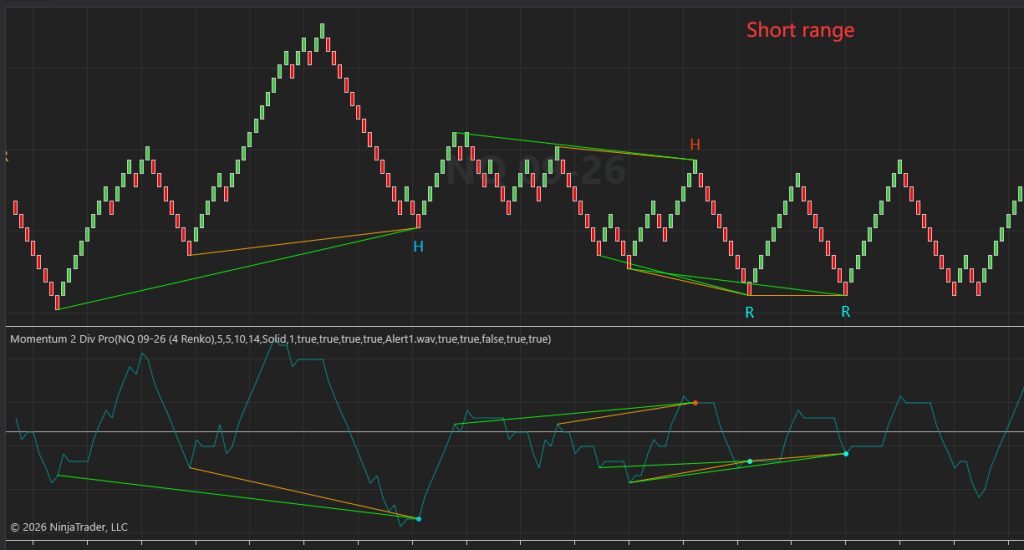
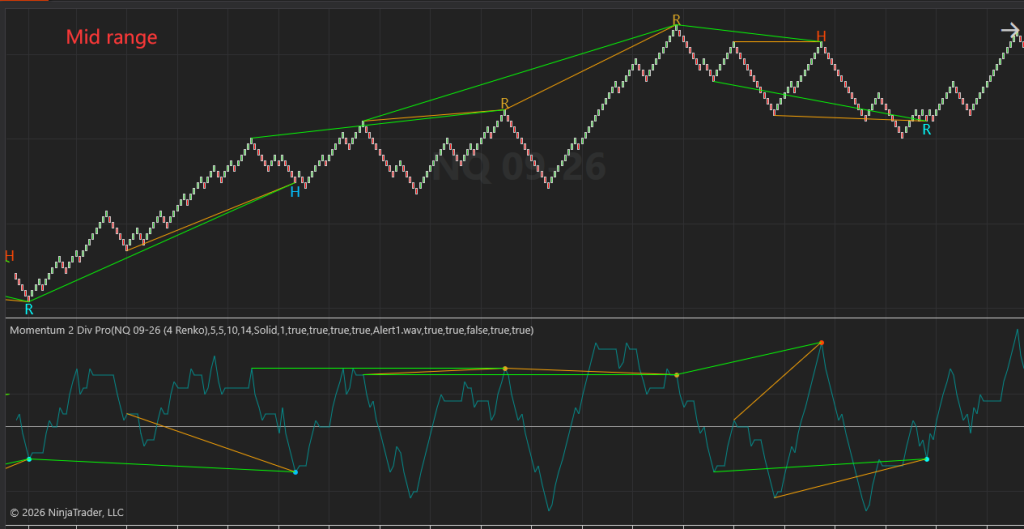
Traditional divergence identifies situations where price and an indicator begin moving differently. PatternSmart's Double Divergence methodology extends this concept by requiring a more structured relationship between multiple price swings and corresponding momentum swings before highlighting a signal.
Rather than reacting to every isolated divergence, the methodology seeks additional confirmation through a defined multi-swing analytical process. This structured approach is designed to reduce insignificant divergence patterns while emphasizing higher-quality analytical opportunities. The methodology supports both Regular Divergence, commonly associated with potential trend reversals, and Hidden Divergence, which often appears during trend continuation after corrective pullbacks. Throughout the process, the indicator remains a confirmation tool rather than a predictive trading system.
For example:
- A market may continue making higher highs while momentum forms progressively weaker highs, suggesting bullish participation is slowing.
- During an established uptrend, a temporary pullback may produce Hidden Bullish Divergence, indicating that the broader trend could still retain underlying strength.
In both situations, divergence should be evaluated alongside price action, market structure, and other technical evidence.
Why Use Momentum Double Divergence?
The Momentum Double Divergence Indicator focuses specifically on the relationship between price movement and momentum behavior.
Unlike oscillators that emphasize overbought or oversold conditions, momentum evaluates the speed of price movement itself. This makes divergence especially useful when traders want to determine whether an existing move continues to be supported by genuine market conviction.
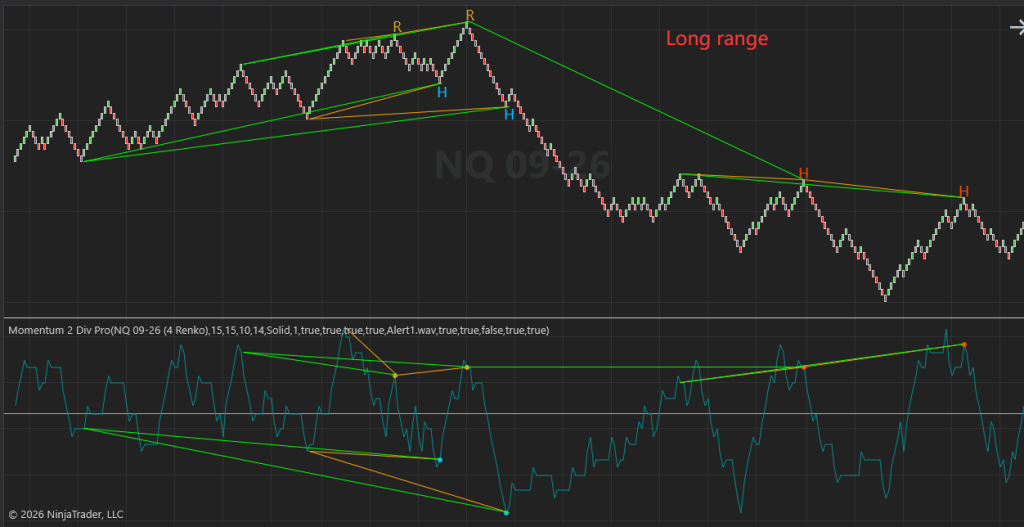
The indicator automatically evaluates both bullish and bearish Regular and Hidden Double Divergence patterns, allowing traders to spend more time interpreting market structure instead of manually comparing multiple swing points.
This analytical approach is particularly valuable during:
- Futures trend continuation analysis
- Intraday momentum exhaustion
- Swing reversal evaluation
- Pullback confirmation within established trends
- Multi-session market structure analysis
Designed for NinjaTrader 8 Workflows
NinjaTrader 8 is widely used by active futures traders and professional technical analysts because of its advanced chart customization, precision, and flexible analytical environment.
Rather than altering an existing workflow, the Momentum Double Divergence Indicator integrates naturally into NinjaTrader 8 workspaces, allowing traders to incorporate divergence analysis alongside their preferred technical studies. The platform's customizable charts and professional analytical tools make it well suited for evaluating momentum across multiple futures markets while maintaining an organized chart layout.
Key Features That Support Professional Analysis
Instead of overwhelming traders with unnecessary complexity, the indicator emphasizes features that directly contribute to disciplined market evaluation.
Automatic Regular and Hidden Double Divergence Detection
The indicator continuously evaluates price and momentum relationships to identify both reversal-oriented Regular Divergence and trend-continuation Hidden Divergence without requiring manual swing analysis.
Confirmation-Oriented Signal Filtering
Signal quality can be refined using features such as Enhanced Mode, which applies stricter structural filtering, and the optional Wait 1 Bar confirmation setting, allowing traders to balance responsiveness with additional confirmation depending on their analytical approach.
Flexible Market Adaptation
Settings including Divergence Bar Range, Divergence Lookback, and Filter Length allow traders to adapt the analysis to short-term intraday activity or broader swing structures while maintaining the same underlying methodology.
Integrated Alerts
The Enable Alert feature can notify traders when confirmed Double Divergence conditions develop, reducing the need to continuously monitor every instrument throughout the trading session.
Clear Visual Presentation
Optional divergence lines, labels, and chart display controls help organize technical evidence, making it easier to review completed patterns during both live analysis and historical chart studies.
Practical Benefits
The Momentum Double Divergence Indicator is designed to support structured technical analysis rather than replace trader judgment.
Practical advantages include:
- More objective evaluation of weakening momentum
- Additional confirmation during potential reversals
- Improved identification of trend continuation opportunities through Hidden Divergence
- Reduced manual comparison of historical swing points
- Better organization of technical evidence within NinjaTrader 8 workspaces
- Flexible adaptation across different trading styles and timeframes
Because the methodology emphasizes confirmation over prediction, it encourages disciplined market analysis instead of mechanical signal-following.
Frequently Asked Questions
What does the Momentum indicator measure?
Momentum measures the rate of price change. It helps traders evaluate whether buying or selling pressure is strengthening or weakening as price continues to move.
Does Double Divergence guarantee a market reversal?
No. Divergence represents analytical evidence rather than certainty. It should always be interpreted alongside price action, market structure, support and resistance, and other forms of technical confirmation.
Can the indicator identify both reversal and continuation opportunities?
Yes. The indicator evaluates both Regular Divergence, which may suggest potential reversals, and Hidden Divergence, which is commonly associated with trend continuation.
Is the indicator suitable for futures trading?
Yes. The Momentum Double Divergence Indicator integrates naturally with NinjaTrader 8 and can be applied to futures, indices, commodities, and other supported markets where momentum analysis is relevant.
Can experienced traders customize the analysis?
Yes. Multiple configuration options—including confirmation behavior, divergence range selection, filtering, alerts, and visualization controls—allow traders to tailor the indicator to their preferred analytical workflow while preserving the core Double Divergence methodology.
Conclusion
Momentum often begins changing before price visibly reflects those shifts. While no single indicator can fully explain market behavior, combining momentum analysis with a structured Double Divergence methodology provides additional context for evaluating both developing reversals and trend continuation opportunities.
Within NinjaTrader 8's professional analytical environment, the Momentum Double Divergence Indicator helps traders organize technical evidence more efficiently while maintaining an objective, confirmation-based approach to market analysis.
Explore the Momentum Double Divergence Indicator
If your analysis emphasizes momentum, confirmation, and disciplined chart interpretation, the PatternSmart Momentum Double Divergence Indicator for NinjaTrader 8 offers a structured way to evaluate evolving market conditions. Explore how its configurable divergence analysis, professional visualization tools, and confirmation-focused methodology can complement your existing NinjaTrader 8 workflow.
Technical Resources & Documentation
Looking for the complete mathematical breakdown, step-by-step optimization guides? Visit the Technical Inputs Manual: Double Divergence Pro for full parameter tuning.
Read the master guide on the Double Divergence Indicator Series. Explore our comprehensive documentation:Double Divergence Indicator Series.
Access our full suite of technical analysis and research articles on the Momentum Double Divergence Indicator here.
Write a review
Your Name:Your Review: Note: HTML is not translated!
Rating: Bad Good
Enter the code in the box below:

Latest


Welcome to Patternsmart
Converting your indicator from one platform to another.Custom Alert, Autotrader, Indicators, Scan, Screener, Strategy and Signals.
Copyright @ 2026 Patternsmart - All rights reserved
This website is for educational and informational
purposes only and should not be considered a solicitation to buy or sell a
futures contract or make any other type of investment decision. It's not recommended to use any single indicator as sole evaluation criteria. The companies
and services listed on this website are not to be considered a recommendation
and it is the reader's responsibility to evaluate any product, service, or
company. patternsmart is not responsible for the accuracy or content of any
product, service or company linked to on this website.
Futures trading
contains substantial risk and is not for every investor.Please read the following risk disclosure before considering the
trading of this product:
Futures Risk Disclosure. An investor could
potentially lose all or more than the initial investment. Risk capital is money
that can be lost without jeopardizing ones financial security or life style.
Only risk capital should be used for trading and only those with sufficient risk
capital should consider trading. Past performance is not necessarily indicative
of future results.
Trading stocks, options, futures and forex involves
speculation, and the risk of loss can be substantial.Investor must consider all
relevant risk factors, including their own personal financial situation, before
trading. Trading foreign exchange on margin carries a high level of risk, as
well as its own unique risk factors. Forex investments are subject to
counter-party risk, as there is no central clearing organization for these
transactions. Please read the following risk disclosure before considering the
trading of this product:
Forex Risk Disclosure. Spreads, Straddles, and other multiple-leg option
strategies can entail substantial transaction costs, including multiple
commissions, which may impact any potential return. Options are not suitable for
all investors as the special risks inherent to options trading may expose
investors to potentially rapid and substantial losses. Prior to trading options,
you should carefully read
Characteristics and Risks of Standardized Options.
patternsmart.com
will not be held liable for the loss of money or any damage caused from relying
on the information on this site. Any investment decision you make in your account is solely your responsibility.
TESTIMONIAL DISCLOSURE: TESTIMONIALS APPEARING ON OUR SITE MAY NOT BE REPRESENTATIVE OF THE EXPERIENCE OF OTHER CLIENTS OR CUSTOMERS AND IS NOT A GUARANTEE OF FUTURE PERFORMANCE OR SUCCESS.