
Your shopping cart is empty!
Shopping Cart
0 item(s) - FreeCustomization and Conversion for: Ctrader, MetaTrader(MT4, MT5), Thinkorswim, NinjaTrader, MultiCharts, Tradingview, Prorealtime, SierraChart, etc.
License renew price will be 20% off for the 2nd year and after.
Every Purchase Comes with a Coupon.
Share Your Experience. Help Other Traders Learn. Get Rewarded.
Share Your Experience. Help Other Traders Learn. Get Rewarded.
Featured
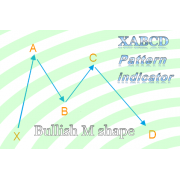
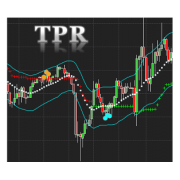
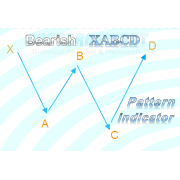
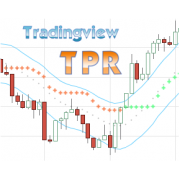


Chart Pattern Falling Wedge and Rising Wedge Indicator for cTrader
 (
Automatic Wedge Pattern Detection Built for cTrader
Wedges are some of the most watched reversal formations in technical analysis. Price tightens between two sloping boundary lines, momentum fades, and the market often prepares to change direction. They are also notoriously tricky to draw by hand, because the lines depend on which swings you choose and how you connect them.
The Chart Pattern Falling Wedge and Rising Wedge indicator for cTrader takes that subjectivity out of the process. It scans your chart for both wedge types, draws the boundary lines, projects them forward and alerts you when a new formation appears. It was written specifically for cTrader, using the platform's native chart objects, parameter panel and notification system, so it fits into your workspace like a built-in tool.
What Are Falling and Rising Wedges?
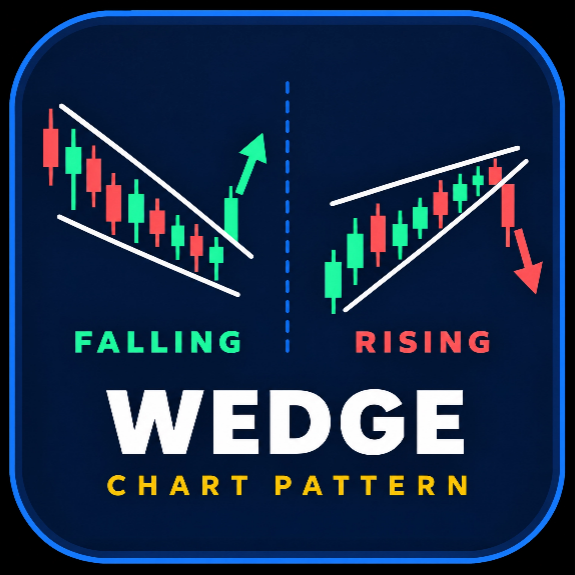
A wedge forms when price consolidates between two trend lines that slope in the same direction but converge as the pattern develops.
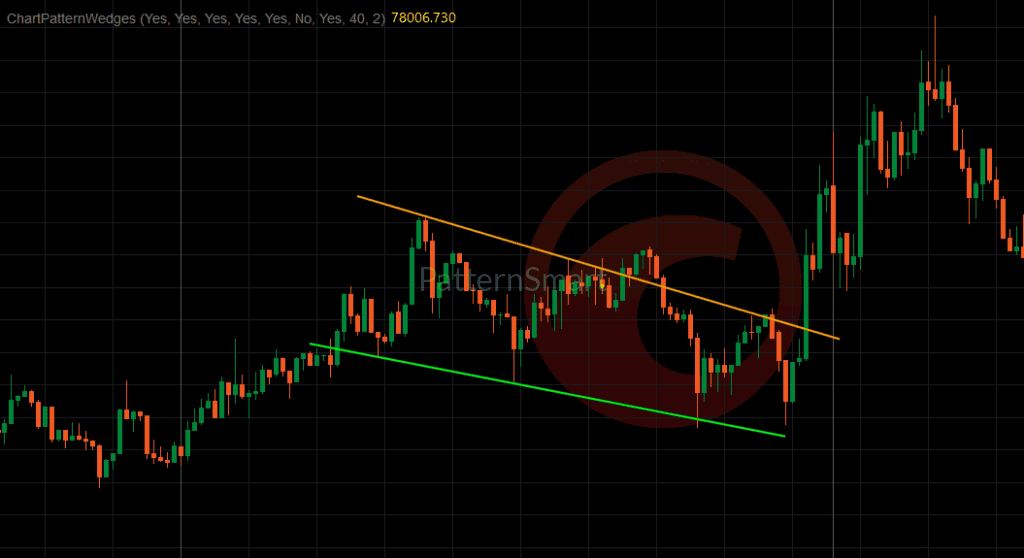
- Falling wedge (bullish): Both boundaries slope downward, with the upper line falling faster than the lower. Traders often watch it as a sign that selling pressure is fading and a bullish reversal may be near, particularly after a decline.
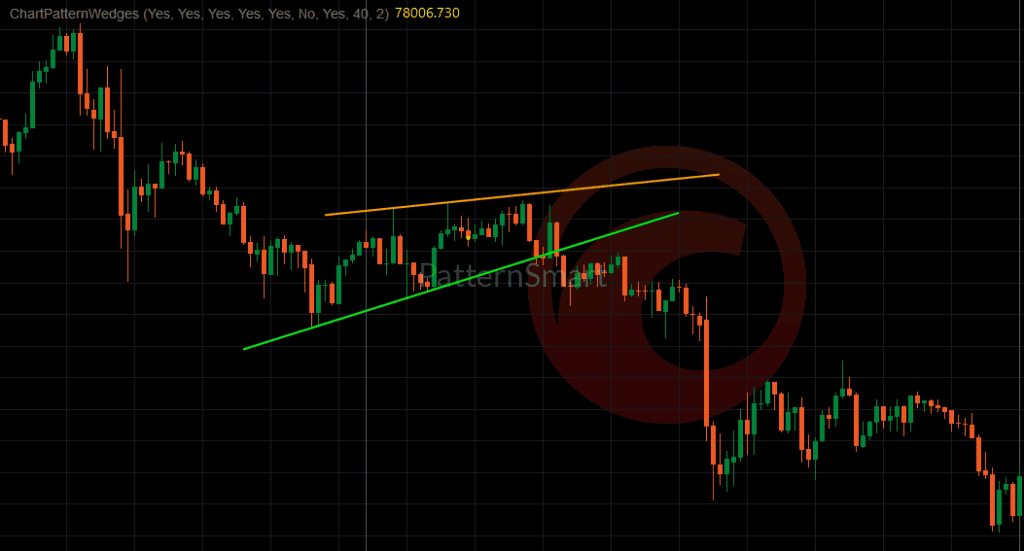
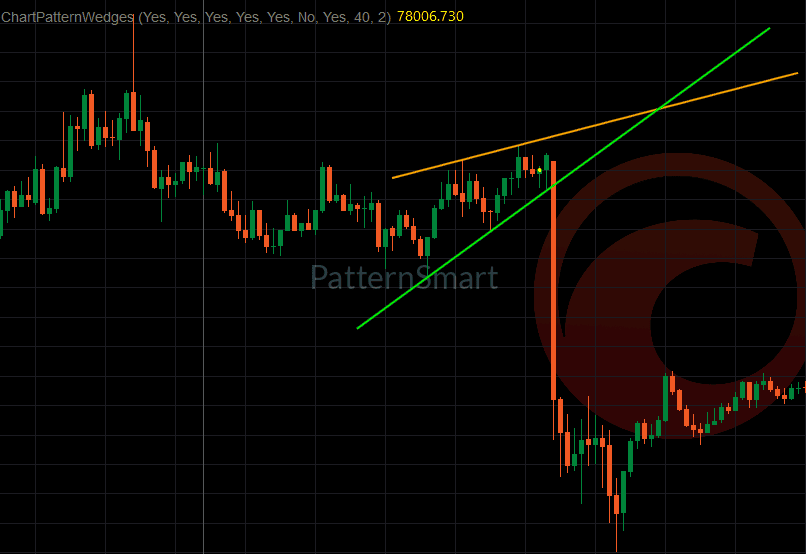
- Rising wedge (bearish): Both boundaries slope upward, with the lower line rising faster than the upper. Traders often watch it as a sign that buying momentum is weakening and a bearish reversal may follow.
Each wedge gives you clear reference lines for planning entries, stops and targets, which is why they are popular with reversal, swing and counter-trend traders.
Key Features
Bullish and Bearish Wedges in One Indicator
Scan for falling wedges, rising wedges or both at the same time. Each type has its own on/off switch, so a trader focused on buying reversals can show falling wedges only, while a trader looking for short setups can show rising wedges only.
Context-Aware Bullish Detection
The falling wedge detection takes the preceding price action into account, looking for a meaningful prior decline before a formation is highlighted. This helps keep bullish signals relevant to the kind of setup traders actually look for, rather than flagging any narrowing range.
Three Pattern Sizes
Match the indicator to your trading style by enabling any combination of sizes:
- Small patterns for short-term wedges on fast charts
- Medium patterns for intraday and swing setups
- Large patterns for major structures on higher timeframes
Use one size for a clean chart, or enable all three to see wedges forming at multiple scales.
Automatic Boundary Lines
When a wedge is identified, the indicator draws an upper trend line and a lower trend line in separate colors, so the structure is easy to read at a glance. The lines begin slightly before the first anchor point so the full shape of the formation is visible.
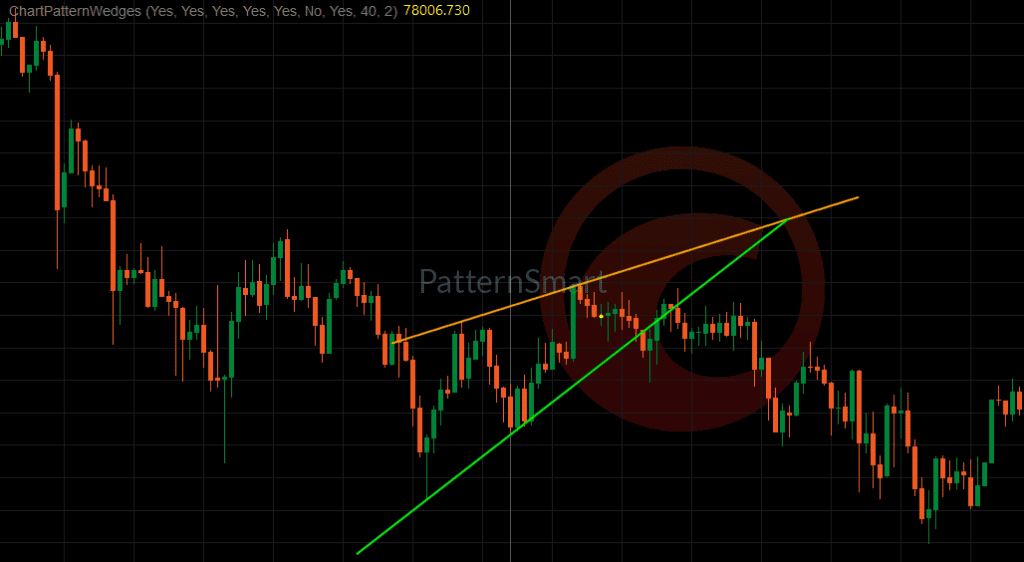
Forward-Projected Lines
The boundary lines continue into the future along their natural slope, showing where the wedge is heading and where price may meet the lines next. You choose how many bars to project, or set the value to zero to switch projection off.
Clear Signal Marker
A marker is plotted on the first bar where a new wedge is confirmed. It does not repeat while the same structure persists, so your chart stays free of duplicate signals and scrolling back through history remains clean.
Show Last Pattern Only
For a minimal workspace, enable the last-pattern option and the indicator keeps only the most recent wedge on the chart, replacing older drawings rather than stacking them.
Built-In Sound Alert
With alerts enabled, the indicator plays a sound when a new wedge is detected on the live bar. Choose any audio file you like. Alerts stay quiet while you scroll through historical data, so you are only notified about what is happening now.
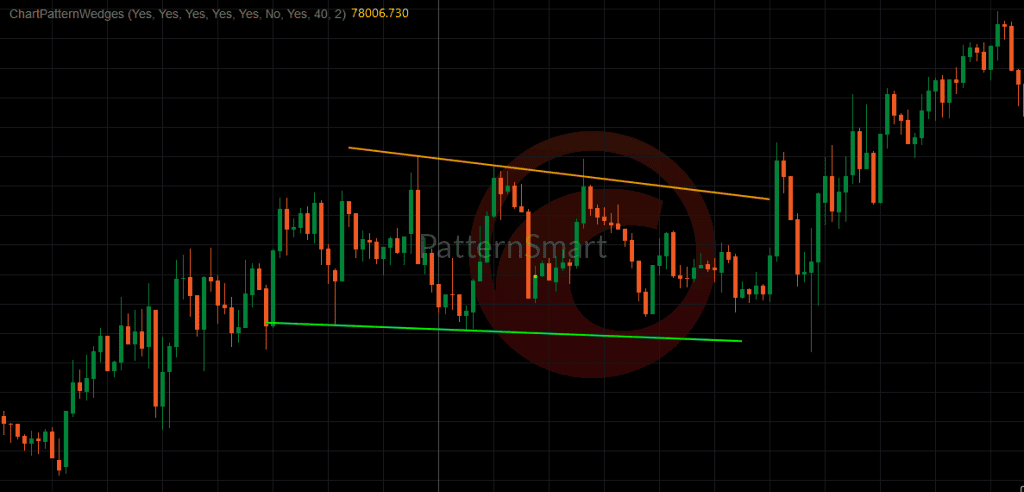
Fully Customizable Appearance
- Upper line color
- Lower line color
- Line width for any monitor or resolution
- Marker styling through the standard cTrader indicator output settings
Platform-Specific Advantages for cTrader Users
This version is a native cTrader indicator, not a port of a tool built for another platform. That brings practical benefits:
- Native chart objects: Wedge lines are drawn as standard cTrader trend lines. You can select, inspect, restyle or delete them just like any line you draw yourself.
- Overlay on the price chart: The indicator sits directly on your candles, so the formation, its boundaries and your own analysis share the same view.
- Organized parameter panel: Settings are grouped into pattern selector, pattern sizes, behavior and line style, making configuration in the cTrader indicator dialog quick and tidy.
- Native color and output controls: Line colors use the platform's own color pickers, and the signal marker can be restyled from the indicator's outputs, consistent with your other indicators.
- Platform-native notifications: Alerts use cTrader's built-in sound notification with the audio file of your choice.
- Safe by design: The indicator runs with no external access rights. It does not connect to the internet or outside services, which is a real advantage when adding third-party tools to a trading platform.
- Fits the cTrader workflow: Use it on any symbol and timeframe your broker provides, save it in your chart templates and workspaces, and run it on several charts at once so alerts show you which market needs attention.
- Useful alongside cTrader Automate: As a standard indicator, it works as a visual reference next to your own cBots and indicators while you build or monitor strategies.
Why Traders Choose This Indicator
- Saves time: No more hunting for converging swings and drawing sloping lines by hand
- Consistent detection: The same rules are applied to every bar, reducing subjectivity
- Both reversal directions covered: Bullish and bearish wedges in one tool
- Works on any market: Forex, indices, commodities, metals, stocks and crypto CFDs
- Works on any timeframe: From one-minute charts to daily and weekly
- Pairs well with your strategy: Combine it with trend filters, momentum oscillators, volume or higher-timeframe support and resistance for added confluence
Who Is It For?
- Reversal and swing traders who look for exhaustion at the end of a move
- Counter-trend traders seeking structured setups
- Price action traders who rely on classic chart patterns
- Beginners learning to tell rising and falling wedges apart
- Experienced traders who want automated scanning across many charts
How to Use It
- Add the indicator to your cTrader chart.
- Choose whether to show falling wedges, rising wedges or both.
- Select the pattern sizes that match your timeframe and style.
- Set the extension length, colors, line width and alert preferences.
- Wait for the signal marker and boundary lines to appear.
- Watch how price behaves around the projected lines, then confirm with your own analysis, including trend context, key levels and risk management, before making any trading decision.
Settings Overview
| Setting | Purpose |
|---|---|
| Show Falling Wedge (Bullish) / Show Rising Wedge (Bearish) | Choose which wedge types are displayed |
| Enable Small / Medium / Large | Choose which pattern sizes are scanned |
| Show Last Pattern Only | Keep only the most recent wedge on the chart |
| Alert | Turn the sound notification on or off |
| Extension Bars | How far the boundary lines are projected forward |
| Line Width | Thickness of the drawn lines |
| Upper / Lower Line Color | Colors of the upper and lower boundaries |
| Sound Alert File | Alert sound for a new wedge |
Frequently Asked Questions
Does this indicator work on all symbols and timeframes?
Yes. It can be applied to any instrument and timeframe available in your cTrader account. Make sure enough historical bars are loaded on the chart so the indicator has price history to work with.
Can I show only bullish or only bearish wedges?
Yes. Falling wedges and rising wedges each have their own on/off setting.
Will it alert me when a pattern forms?
Yes. With alerts enabled, a sound plays when a new wedge is detected on the current bar.
Can I project the lines further into the future?
Yes. The extension setting controls how many bars the lines run forward, and it can be turned off entirely.
How do I keep my chart clean?
Enable only the sizes and types you need, and switch on the last-pattern-only option.
Can I change the colors and line thickness?
Yes. Upper and lower line colors and line width are fully adjustable.
Does it guarantee profitable trades?
No indicator can. It is a decision-support tool that helps you identify wedge structures and potential reversal areas. Always apply sound risk management.
Does it need special permissions?
No. It runs with no external access rights.
Spot Reversals Before They Become Obvious
If you trade reversals and exhaustion moves, the Chart Pattern Falling Wedge and Rising Wedge indicator for cTrader gives you automatic detection of both wedge types, clean boundary lines, forward projections and instant alerts in one lightweight, platform-native tool.
Add it to your cTrader chart today and let the market's wedges come to you.
Risk disclaimer: Trading leveraged products carries a high level of risk and may not be suitable for all investors. This indicator is an analytical tool and does not constitute financial advice or a guarantee of future results. Past performance is not indicative of future outcomes.
Write a review
Your Name:Your Review: Note: HTML is not translated!
Rating: Bad Good
Enter the code in the box below:


Latest
Welcome to Patternsmart
Converting your indicator from one platform to another.Custom Alert, Autotrader, Indicators, Scan, Screener, Strategy and Signals.
Copyright @ 2026 Patternsmart - All rights reserved
This website is for educational and informational
purposes only and should not be considered a solicitation to buy or sell a
futures contract or make any other type of investment decision. It's not recommended to use any single indicator as sole evaluation criteria. The companies
and services listed on this website are not to be considered a recommendation
and it is the reader's responsibility to evaluate any product, service, or
company. patternsmart is not responsible for the accuracy or content of any
product, service or company linked to on this website.
Futures trading
contains substantial risk and is not for every investor.Please read the following risk disclosure before considering the
trading of this product:
Futures Risk Disclosure. An investor could
potentially lose all or more than the initial investment. Risk capital is money
that can be lost without jeopardizing ones financial security or life style.
Only risk capital should be used for trading and only those with sufficient risk
capital should consider trading. Past performance is not necessarily indicative
of future results.
Trading stocks, options, futures and forex involves
speculation, and the risk of loss can be substantial.Investor must consider all
relevant risk factors, including their own personal financial situation, before
trading. Trading foreign exchange on margin carries a high level of risk, as
well as its own unique risk factors. Forex investments are subject to
counter-party risk, as there is no central clearing organization for these
transactions. Please read the following risk disclosure before considering the
trading of this product:
Forex Risk Disclosure. Spreads, Straddles, and other multiple-leg option
strategies can entail substantial transaction costs, including multiple
commissions, which may impact any potential return. Options are not suitable for
all investors as the special risks inherent to options trading may expose
investors to potentially rapid and substantial losses. Prior to trading options,
you should carefully read
Characteristics and Risks of Standardized Options.
patternsmart.com
will not be held liable for the loss of money or any damage caused from relying
on the information on this site. Any investment decision you make in your account is solely your responsibility.
TESTIMONIAL DISCLOSURE: TESTIMONIALS APPEARING ON OUR SITE MAY NOT BE REPRESENTATIVE OF THE EXPERIENCE OF OTHER CLIENTS OR CUSTOMERS AND IS NOT A GUARANTEE OF FUTURE PERFORMANCE OR SUCCESS.