
Your shopping cart is empty!
Shopping Cart
0 item(s) - FreeCustomization and Conversion for: Ctrader, MetaTrader(MT4, MT5), Thinkorswim, NinjaTrader, MultiCharts, Tradingview, Prorealtime, SierraChart, etc.
License renew price will be 20% off for the 2nd year and after.
Every Purchase Comes with a Coupon.
Share Your Experience. Help Other Traders Learn. Get Rewarded.
Share Your Experience. Help Other Traders Learn. Get Rewarded.
Featured







CCI Double Divergence Pro for MultiCharts


 (
(Spot Real Momentum Shifts with Precision Dual-Swing CCI Divergence Analysis
Eliminate visual clutter and eliminate false signals. CCI Double Divergence Pro automatically scans, plots, and alerts on Regular and Hidden divergence structures across both price chart candles and subchart momentum panels in MultiCharts.
Pain Points & Solution
| Common Trading Challenge | How CCI Double Divergence Pro Helps |
| Subjective Trendline Drawing: Manually connecting swing highs and lows to oscillator peaks creates inconsistency and analytical bias. | Automated Dual-Swing Plotting: Draws double anchor trendlines directly between valid swing points on price and the indicator subpane. |
| Premature Signal Execution: Entering trades intra-bar often leads to fakeouts as real-time price bars fluctuate before closing. | Confirmed Bar Execution (Wait1): Optional bar-close filtering ensures signals evaluate only after the signal bar completes, preventing mid-candle repainting. |
| Differentiating Reversals vs. Continuations: Single-line divergence indicators fail to distinguish between trend exhaustion and trend pullbacks. | Complete 4-Way Classification: Detects and labels both Regular Bullish/Bearish (reversal) and Hidden Bullish/Bearish (continuation) setups. |
| Chart Noise & Overlapping Signals: Rapid market moves generate redundant back-to-back signal markers that obscure chart reading. | Smart Signal Suppression: Suppresses duplicate signals within a user-defined bar window (OnlyShowLastSignalWithinBars) to clean up historical visuals. |
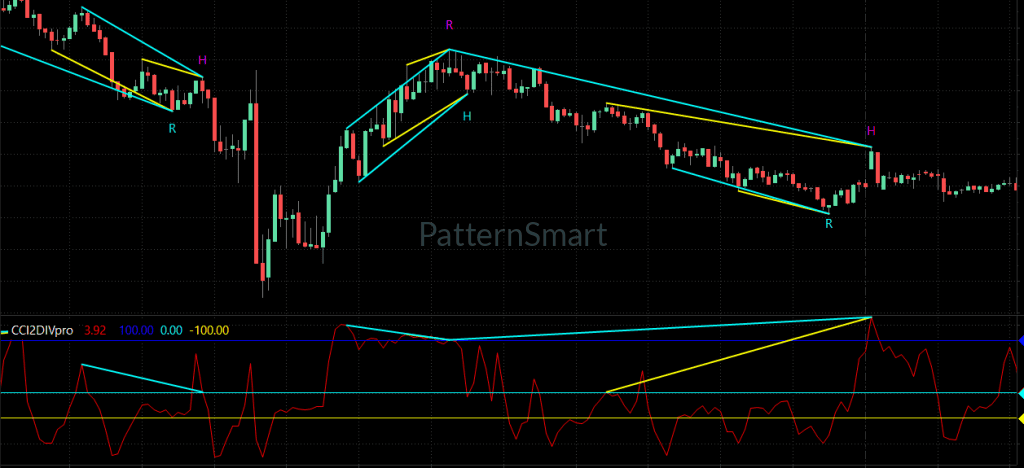
Key Features
1. Dual-Anchor Swing Tracking
-
What It Does: Calculates two consecutive swing anchor points across price peaks/troughs and corresponding CCI extremes rather than relying on an isolated single peak.
-
Why It Matters: Single-peak divergences frequently trigger false signals in strong trends. Requiring dual-swing validation increases structural conviction.
-
How Traders Can Use It: Compare the slope of the double trendlines plotted on price candles against the slope of the trendlines in the subchart pane.
2. Multi-Horizon Range Scanning (
DivRangeMode)-
What It Does: Allows traders to toggle between three distinct swing lookback ranges: ShortRange, MidRange, and LongRange.
-
Why It Matters: Scalpers require tight swing structures, while swing traders need broader macro waves.
-
How Traders Can Use It: Switch range settings depending on timeframe and strategy without needing to recalculate complex indicator inputs manually.
3. Enhanced Structure Mode (
EnhancedMode)-
What It Does: Applies an additional structural filter to evaluate the hierarchy between consecutive swing points.
-
Why It Matters: Filters out inconsistent swing progressions where price structure lacks structural alignment.
-
How Traders Can Use It: Toggle
EnhancedMode = trueduring noisy or choppy consolidation phases to isolate higher-conviction setups.
4. Dual-Pane Visualization & ATR-Adjusted Markers
-
What It Does: Displays visual character tags ("R" for Regular, "H" for Hidden) positioned using Average True Range offsets near price bars, while drawing structural lines on both panels.
-
Why It Matters: Keeps entry context immediately clear without forcing the trader to constantly shift focus between subcharts and price candles.
-
How Traders Can Use It: Identify key exhaustion points directly on price candles while verifying oscillator slope behavior below.
Signal / Repaint Behavior
The indicator provides configurable bar-confirmation logic via the
Wait1 parameter:-
When
Wait1 = true(Default): The indicator evaluates conditions on bar close and confirms the signal on the next bar. Once a bar closes, confirmed historical signals, text markers, and trendlines remain fixed and do not repaint. -
When
Wait1 = false: Signals evaluate dynamically intra-bar in real time. Signal lines and text tags may appear or disappear as current price updates until the bar officially completes. -
Signal Limiting: The
OnlyShowLastSignalWithinBarsparameter automatically removes redundant visual markers of the same type if a new signal forms within the designated bar window, keeping the workspace clutter-free.
Timeframes & Markets
-
Timeframe Agnosticism: Engineered to function across intraday tick/minute charts, hourly timeframes, daily, and weekly charts.
-
Asset Compatibility: Compatible with all financial instruments supported in MultiCharts, including Index Futures, Forex currency pairs, Equities, Crypto, and Commodities.
-
Parameter Adaptability: Key settings like
CCI_Period,CCI_Smooth, andDivRangeModecan be adjusted to account for individual market volatility and cyclical characteristics.
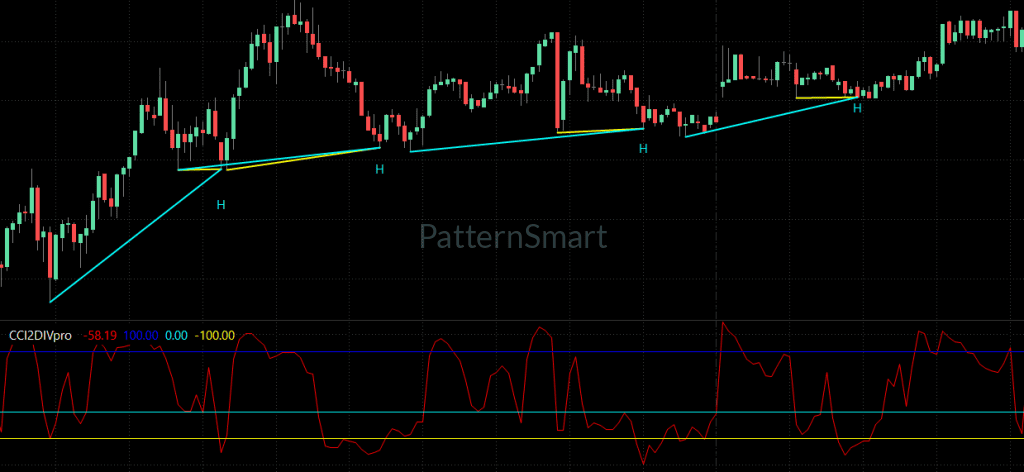
What You Actually See on the Chart
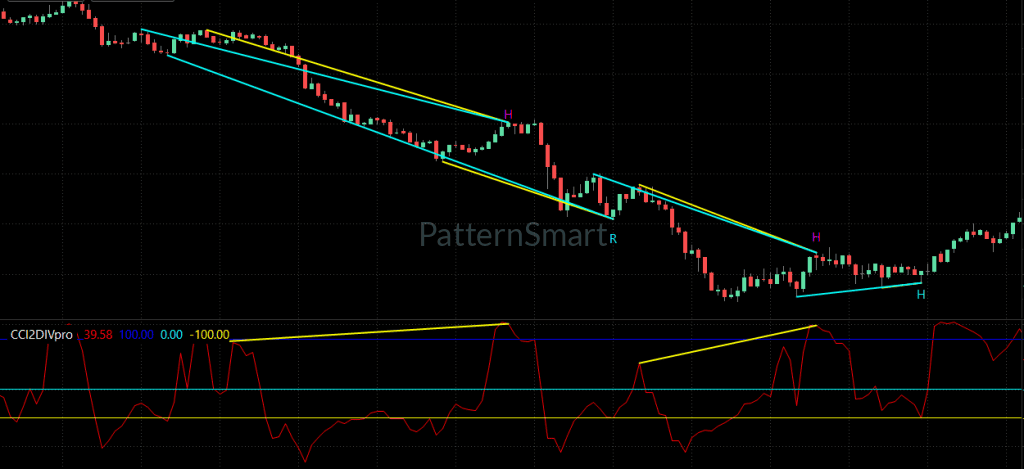
Main Price Panel:
-
Candlestick Alignment: Price action showing market highs and lows.
-
Signal Characters: Cyan markers ("R" or "H") placed below bullish setup bars; Magenta markers ("R" or "H") placed above bearish setup bars.
-
Price Trendlines: Color-coded connecting lines drawn directly between price swing points across the chart.
Indicator Subchart Panel:
-
CCI Oscillator Line: Main Commodity Channel Index plot accompanied by its smoothed moving average.
-
Reference Levels: Overbought line (default: +100), Zero Middle Line (default: 0), and Oversold line (default: -100).
-
Subchart Divergence Lines: Matching dual trendlines connecting corresponding indicator swing points to show momentum expansion or contraction.
How It Works
The indicator translates momentum deviation into actionable trade setups using a systematic visual process:
-
Price Expansion Observation: The indicator tracks price swings to establish clear market peaks or troughs.
-
CCI Velocity Tracking: Simultaneously measures how far price deviates from its statistical average using the CCI oscillator.
-
Dual Anchor Comparison: Compares two distinct swing points on price with their corresponding CCI values.
-
Classification:
-
Regular Divergence: Price pushes to a new extreme, but CCI fails to reach a matching extreme (signals potential trend exhaustion/reversal).
-
Hidden Divergence: Price holds a higher low or lower high, but CCI makes an extreme push (signals potential trend continuation).
-
-
Bar Confirmation & Alerting: Upon bar completion (when
Wait1is enabled), visual markers are locked, and native MultiCharts alerts are triggered.
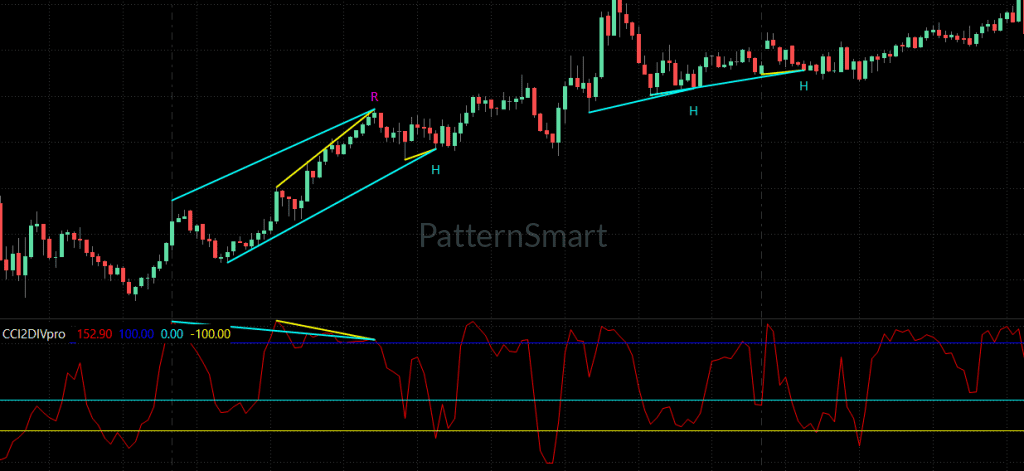
Trade Setups & Practical Application
Bullish Regular Divergence (Trend Reversal Setup)
-
Market Context: Downtrend or test of key support level.
-
Indicator Condition: Price forms a lower low, but CCI forms a higher low, accompanied by a Cyan "R" character below the bar.
-
Confirmation: Signal bar closes bullish (or wait for price to cross above immediate short-term market structure).
-
Execution Concept: Enter long on subsequent bar open following bar-close confirmation.
-
Risk Management: Place stop-loss below the recent swing low; set initial target at the intermediate swing high or key resistance zone.
Bullish Hidden Divergence (Trend Continuation Setup)
-
Market Context: Established uptrend undergoing a temporary pullback.
-
Indicator Condition: Price forms a higher low, but CCI forms a lower low, accompanied by a Cyan "H" character.
-
Confirmation: Price holding above key moving average or dynamic support.
-
Execution Concept: Enter long in alignment with the broader macro uptrend.
-
Risk Management: Place stop-loss below the pullback low; target key expansion levels or previous trend highs.
Confirmation & Market Context
No indicator should be used in complete isolation. High-probability execution requires integrating divergence signals with broad market context:
Signal Detection → Market Context → Technical Confirmation → Risk Management
-
Support & Resistance: Prioritize Regular Divergence signals that align with major support/resistance zones, daily pivot points, or high-volume nodes.
-
Higher Timeframe Trend: Use Hidden Divergence setups in the direction of the dominant higher timeframe trend.
-
Price Action Confirmation: Wait for candlestick confirmation (e.g., engulfing bars, pin bars, or structural breaks) prior to entry.
Practical Benefits
-
Objective Identification: Eliminates subjective manual trendline drawing across subcharts.
-
Complete Market Perspective: Captures both reversal entries (Regular) and pullback entries (Hidden) within one tool.
-
Reduced Execution Anxiety: Bar-close confirmation ensures traders execute on finalized setups rather than intra-bar noise.
-
Streamlined Visual Workspace: Clean chart tags and signal suppression keep historical charts readable.
Key Settings & User Inputs
| Parameter Name | Default Value | Description / Practical Guidance |
Wait1 |
true |
When set to true, enforces bar-close confirmation to eliminate repainting. |
ShowRegularBullish / ShowRegularBearish |
true |
Toggles visualization of Regular (reversal) divergence setups. |
ShowHiddenBullish / ShowHiddenBearish |
true |
Toggles visualization of Hidden (continuation) divergence setups. |
EnhancedMode |
false |
When set to true, applies stricter structural filtering rules to remove lower-quality setups. |
CCI_Period |
14 |
Sets the baseline period calculation for the Commodity Channel Index. |
CCI_Smooth |
3 |
Smoothing factor applied to internal momentum comparisons. |
DivRangeMode |
0 |
Selects lookback scale: 0 (ShortRange), 1 (MidRange), or 2 (LongRange). |
OnlyShowLastSignalWithinBars |
10 |
De-clutters charts by deleting previous same-type signals if a new one forms within specified bars. |
EnableAlert |
true |
Enables native MultiCharts audio/visual popup alerts when confirmed setups trigger. |
Who Is This Indicator For?
-
Swing Traders: Seeking high-probability pullback entries in trending markets via Hidden Divergence.
-
Counter-Trend & Reversal Traders: Looking for early warnings of momentum depletion at key market extremes.
-
Systematic Analysts: Requiring precise, rule-based visual setup identification without manual chart drawing.
-
Multi-Market Traders: Managing watchlists across Futures, Forex, Stocks, and Crypto using automated platform alerts.
Platform: MultiCharts
Built specifically for MultiCharts (PowerLanguage), utilizing native drawing objects and alert triggers.
-
Fully integrated with native MultiCharts Alert windows.
-
Utilizes high-performance chart plotting routines for smooth historical backprocessing.
-
Supports customizable color palettes, line widths, and line styles directly from the indicator properties panel.
Frequently Asked Questions
Is this indicator suitable for beginners?
Yes, provided the trader understands basic price structure and oscillator concepts. The automated line plotting and visual "R" / "H" characters simplify identification.
Does CCI Double Divergence Pro repaint?
When
Wait1 is set to true (default), signals evaluate upon bar completion. Confirmed signals and drawing lines remain permanently fixed on historical charts.What is the difference between Regular and Hidden divergence?
Regular divergence occurs when price makes a higher high or lower low unsupported by CCI, signaling potential reversal. Hidden divergence occurs when price holds a higher low or lower high while CCI makes a strong push, signaling potential trend continuation.
Which markets and timeframes work best?
The indicator works across all markets supported by MultiCharts (Futures, Forex, Crypto, Stocks). Lookback sensitivity can be tailored using the
DivRangeMode input.Can I set up audio alerts?
Yes. Enabling
EnableAlert = true triggers native MultiCharts alerts whenever a valid signal completes on the chart.
Looking for the complete mathematical breakdown, step-by-step optimization guides, and advanced trading strategies? Explore our comprehensive documentation:
Visit the Technical Inputs Manual: Double Divergence Pro for full parameter tuning.
Read the master guide on the Double Divergence Indicator Series.
Write a review
Your Name:Your Review: Note: HTML is not translated!
Rating: Bad Good
Enter the code in the box below:


Latest

Welcome to Patternsmart
Converting your indicator from one platform to another.Custom Alert, Autotrader, Indicators, Scan, Screener, Strategy and Signals.
Copyright @ 2026 Patternsmart - All rights reserved
This website is for educational and informational
purposes only and should not be considered a solicitation to buy or sell a
futures contract or make any other type of investment decision. It's not recommended to use any single indicator as sole evaluation criteria. The companies
and services listed on this website are not to be considered a recommendation
and it is the reader's responsibility to evaluate any product, service, or
company. patternsmart is not responsible for the accuracy or content of any
product, service or company linked to on this website.
Futures trading
contains substantial risk and is not for every investor.Please read the following risk disclosure before considering the
trading of this product:
Futures Risk Disclosure. An investor could
potentially lose all or more than the initial investment. Risk capital is money
that can be lost without jeopardizing ones financial security or life style.
Only risk capital should be used for trading and only those with sufficient risk
capital should consider trading. Past performance is not necessarily indicative
of future results.
Trading stocks, options, futures and forex involves
speculation, and the risk of loss can be substantial.Investor must consider all
relevant risk factors, including their own personal financial situation, before
trading. Trading foreign exchange on margin carries a high level of risk, as
well as its own unique risk factors. Forex investments are subject to
counter-party risk, as there is no central clearing organization for these
transactions. Please read the following risk disclosure before considering the
trading of this product:
Forex Risk Disclosure. Spreads, Straddles, and other multiple-leg option
strategies can entail substantial transaction costs, including multiple
commissions, which may impact any potential return. Options are not suitable for
all investors as the special risks inherent to options trading may expose
investors to potentially rapid and substantial losses. Prior to trading options,
you should carefully read
Characteristics and Risks of Standardized Options.
patternsmart.com
will not be held liable for the loss of money or any damage caused from relying
on the information on this site. Any investment decision you make in your account is solely your responsibility.
TESTIMONIAL DISCLOSURE: TESTIMONIALS APPEARING ON OUR SITE MAY NOT BE REPRESENTATIVE OF THE EXPERIENCE OF OTHER CLIENTS OR CUSTOMERS AND IS NOT A GUARANTEE OF FUTURE PERFORMANCE OR SUCCESS.