
Your shopping cart is empty!
Shopping Cart
0 item(s) - FreeCustomization and Conversion for: Ctrader, MetaTrader(MT4, MT5), Thinkorswim, NinjaTrader, MultiCharts, Tradingview, Prorealtime, SierraChart, etc.
License renew price will be 20% off for the 2nd year and after.
Every Purchase Comes with a Coupon.
Share Your Experience. Help Other Traders Learn. Get Rewarded.
Share Your Experience. Help Other Traders Learn. Get Rewarded.
Featured




WilliamsR Double Divergence Pro for MultiCharts


 (
(Institutional-Grade Momentum Divergence & Trend Continuation Engine
Unlock high-probability trading setups with WilliamsR Double Divergence Pro for MultiCharts, the ultimate momentum divergence indicator engineered for professional traders, quantitative analysts, and active market participants. Built upon the classic Williams %R oscillator framework, this advanced tool goes far beyond standard divergence detectors by identifying dual-point double divergence structures across multiple swing horizons simultaneously.
Whether you trade stocks, futures, forex, or cryptocurrencies, WilliamsR Double Divergence Pro delivers crystal-clear on-chart visual signals, dynamic trendlines, and customizable real-time alerts so you never miss a critical market turning point or trend continuation setup.
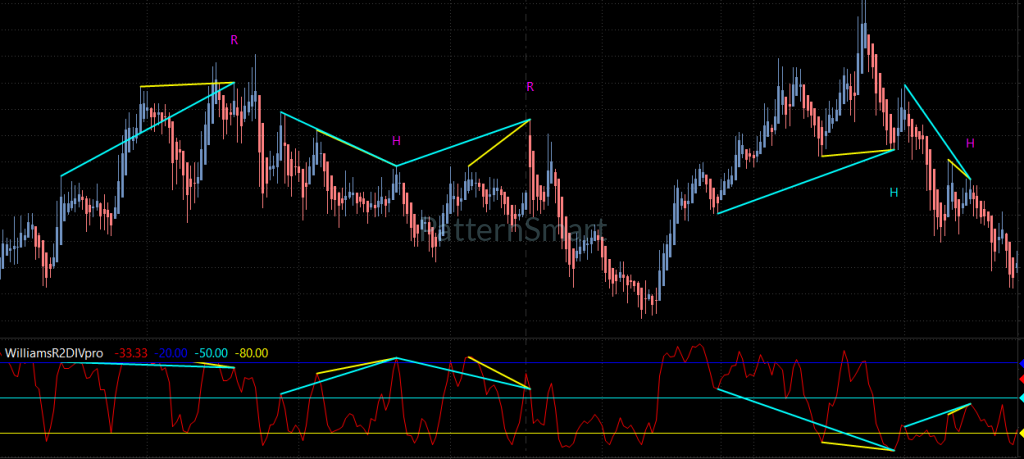
Key Trading Advantages
- Dual-Point Double Divergence Precision: Detects true structural divergence by analyzing two distinct historical swing points relative to momentum extremes, ensuring higher statistical significance than simple single-bar divergences.
- 4-in-1 Signal Detection Engine: Simultaneously monitors Regular Bullish (reversal), Hidden Bullish (continuation), Regular Bearish (reversal), and Hidden Bearish (continuation) momentum patterns.
- Multi-Horizon Swing Analysis: Effortlessly scans across Short-Range, Mid-Range, and Long-Range swing structures to match your trading timeframe and strategy style.
- Zero-Repaint Bar Confirmation (
Wait1): Optional bar-close validation ensures signals are confirmed only after bar completion, eliminating false triggers during intra-bar market noise. - Automatic Dual-Pane Trendline Visuals: Automatically draws customized divergence trendlines across both price action and the Williams %R sub-chart for instant visual verification.
- Smart Noise Reduction & Signal Pruning: Built-in signal suppression automatically prunes older, redundant markers to maintain clean, clutter-free charts.
Core Features Breakdown
1. Quad-Signal Divergence Architecture
The indicator provides complete coverage across all market conditions by classifying signals into four distinct tactical categories:
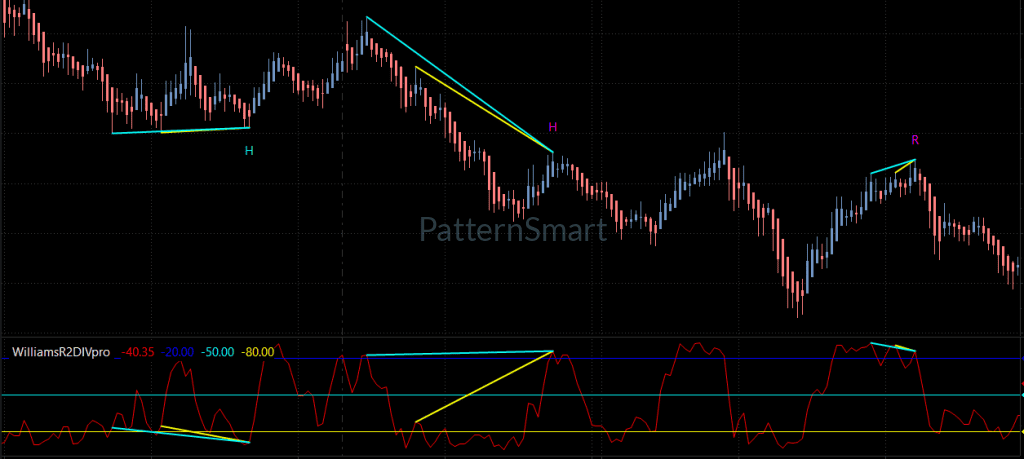
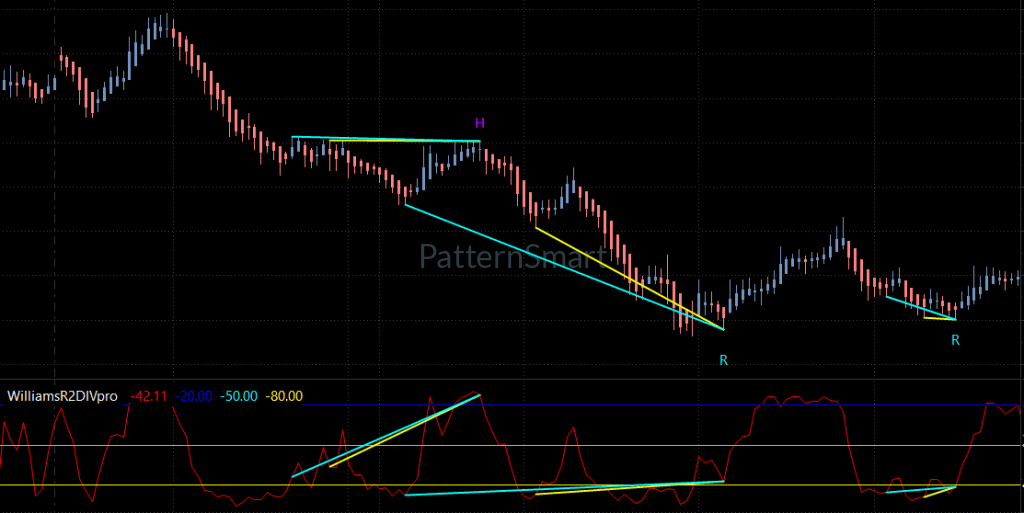
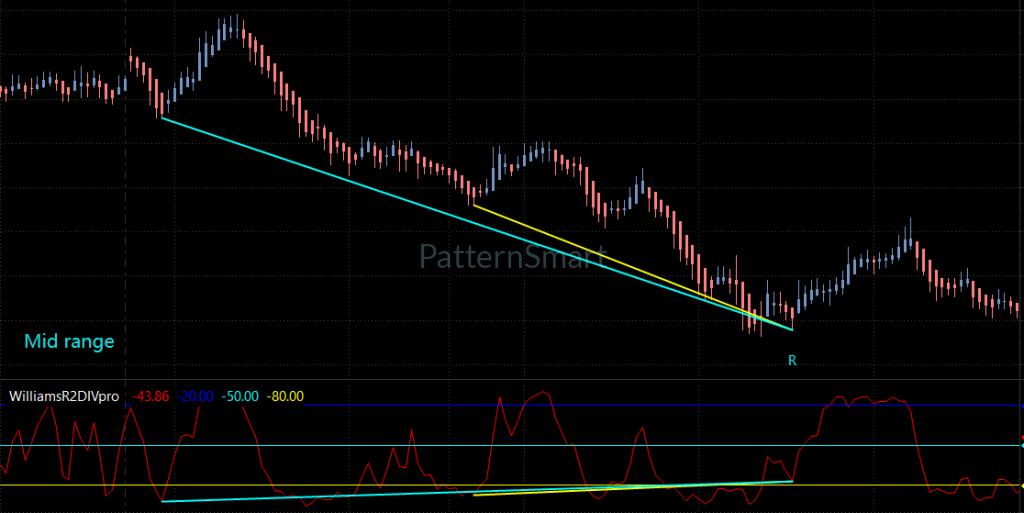
- Regular Bullish Divergence (“R” Cyan Label): Identifies momentum exhaustion when price forms equal or lower lows while the Williams %R oscillator establishes higher momentum lows beneath the middle filter threshold.
- Hidden Bullish Divergence (“H” Cyan Label): Pinpoints high-probability trend continuation entries when price holds higher lows while Williams %R prints lower momentum lows.
- Regular Bearish Divergence (“R” Magenta Label): Signals potential macro reversals when price makes equal or higher highs while Williams %R exhibits weaker momentum highs above the middle filter threshold.
- Hidden Bearish Divergence (“H” Magenta Label): Captures bearish continuation setups when price creates lower highs while Williams %R hits higher momentum highs.
2. Multi-Range Horizon Engine
Markets move in complex cycles. WilliamsR Double Divergence Pro features an adaptable swing search engine with three selectable range horizons: * Short-Range Mode: Focuses on micro-swings, ideal for scalpers and fast-paced intraday setups. * Mid-Range Mode: Evaluates intermediate swings, perfect for day traders seeking core intraday trends. * Long-Range Mode: Analyzes macro-swings, designed for swing traders and position management.
3. Structural Filtering & Enhanced Validation Mode
To shield traders from whipsaws in choppy markets, the indicator incorporates multi-layered structural validation filters: * Momentum Filter Baseline: Requires oscillator values to reside on the correct side of the smooth average baseline (FilterLength) before qualifying a signal. * Overbought & Oversold Boundary Rules: Validates signals against standard Williams %R oversold (-80), middle (-50), and overbought (-20) reference levels. * Enhanced Mode Filter: Enables strict swing hierarchy validation to ensure that historical swing points maintain structural integrity prior to signal firing.
4. Non-Repainting Bar Close Confirmation (Wait1)
Intra-bar price spikes can frequently trigger false divergence readings that vanish before the candle closes. With the Wait1 mode enabled, the indicator delays final signal drawing and alert firing until the bar completes and satisfies color alignment (close greater than open for bullish setups, close less than open for bearish setups).
5. Seamless Visual Customization & Automatic Trendline Mapping
Enjoy complete control over your chart visuals: * On-Chart Character Markers: Displays distinct Cyan “R” or “H” letters for bullish setups and Magenta “R” or “H” letters for bearish setups, offset dynamically by Average True Range (ATR) to avoid overlapping price bars. * Dynamic Trendline Plots: Renders custom connecting trendlines across price swing points and corresponding Williams %R sub-chart peaks/troughs. * Full Aesthetic Control: Customize line colors (Divergence_Line1_Color, Divergence_Line2_Color), line width (LineWidth), and line style (LineStyle).
6. Built-in Alert Notification System
Stay connected to the market without staring at your screens constantly. The integrated alert system (EnableAlert) delivers real-time notifications on the final chart bar whenever a regular or hidden bullish/bearish setup completes.
Technical Specifications & Default Input Parameters
Below is a complete reference of configurable inputs available in MultiCharts:
| Parameter Name | Default Value | Description |
|---|---|---|
Wait1 |
true |
Enables bar completion safety mode to prevent intra-bar repainting. |
ShowRegularBullish |
true |
Toggles display of Regular Bullish Reversal setups. |
ShowHiddenBullish |
true |
Toggles display of Hidden Bullish Continuation setups. |
ShowRegularBearish |
true |
Toggles display of Regular Bearish Reversal setups. |
ShowHiddenBearish |
true |
Toggles display of Hidden Bearish Continuation setups. |
EnhancedMode |
false |
Enables strict structural swing hierarchy filtering. |
EnableAlert |
true |
Enables audio and visual alert triggers on signal bar. |
ShowChar |
true |
Shows on-chart character labels (“R” for Regular, “H” for Hidden). |
ShowLine |
true |
Draws visual trendlines on price pane and indicator sub-pane. |
OnlyShowLastSignalWithinBars |
10 |
Auto-prunes older signal lines within specified bar window to clear chart clutter. |
Divergence_Line1_Color |
Yellow |
Primary divergence trendline color. |
Divergence_Line2_Color |
Cyan |
Secondary divergence trendline color. |
LineWidth |
1 |
Visual trendline thickness. |
LineStyle |
0 |
Visual trendline style (solid, dashed, dotted). |
WilliamsR_Period |
14 |
Calculation lookback period for Williams %R oscillator. |
WilliamsR_Smooth |
3 |
Smoothing factor for indicator baseline moving average. |
ShortRange |
true |
Enables micro swing range analysis. |
MidRange |
false |
Enables intermediate swing range analysis. |
LongRange |
false |
Enables macro swing range analysis. |
DivergenceLookback |
5 |
Lookback window for min/max momentum extremes. |
FilterLength |
5 |
Lookback window for average baseline smoothing filter. |
SwingSearchBars |
500 |
Maximum historical bar lookback depth for swing identification. |
OverBought |
-20 |
Standard overbought boundary threshold line. |
MiddleLine |
-50 |
Neutral baseline threshold line. |
OverSold |
-80 |
Standard oversold boundary threshold line. |
How to Trade with WilliamsR Double Divergence Pro
Strategy 1: Catching Macro Market Reversals (Regular Divergence)
When price pushes to new lows while the Williams %R oscillator prints a higher low beneath the -50 middle line, the indicator fires a Regular Bullish Divergence signal (“R” in Cyan). This signals that downside selling pressure is exhausting despite lower prices. Traders can look for long entry opportunities upon bar completion. Conversely, when price hits new highs but Williams %R forms a lower high above -50, a Regular Bearish Divergence signal (“R” in Magenta) indicates buying weakness and potential downside reversal.
Strategy 2: Riding Established Trends (Hidden Divergence)
During strong trending markets, pullbacks offer the safest low-risk entry points. A Hidden Bullish Divergence signal (“H” in Cyan) occurs when price stays above a prior swing low while Williams %R pulls back deeply to make a lower momentum low. This indicates that institutional buyers are defending structural support, confirming that the main uptrend is intact and ready to resume.
Strategy 3: Multi-Horizon Alignment
By toggling ShortRange, MidRange, or LongRange modes, traders can align micro entry signals with macro trend direction. When a short-range signal coincides with a mid-range or long-range divergence, signal probability increases exponentially.
Frequently Asked Questions (FAQ)
Q: Does WilliamsR Double Divergence Pro repaint historical signals?
A: No. When Wait1 is set to true, all signals, trendlines, and alerts wait for the bar to close and satisfy strict completion conditions before triggering. Once a bar closes, confirmed signals remain permanently fixed on your MultiCharts workspace.
Q: Can I use this indicator on intra-day tick, volume, or time-based charts?
A: Yes. The underlying swing and momentum logic adapts dynamically across any bar type, including time-based candles (1-min, 5-min, 60-min, daily), volume charts, tick charts, and range bars.
Q: How does the signal cleanup feature work?
A: The OnlyShowLastSignalWithinBars parameter monitors active signals within your chosen bar window. If a new signal triggers within that window, older redundant trendlines and labels are automatically deleted (TL_Delete and Text_Delete), keeping your MultiCharts workspace clean and readable.
Elevate Your MultiCharts Workspace Today
Stop relying on lagging indicators or manual trendline drawing. Transform your trading performance with WilliamsR Double Divergence Pro for MultiCharts—the definitive momentum divergence tool built for clarity, precision, and performance.
Looking for the complete mathematical breakdown, step-by-step optimization guides, and advanced trading strategies? Explore our comprehensive documentation:
Visit the Technical Inputs Manual: Double Divergence Pro for full parameter tuning.
Read the master guide on the Double Divergence Indicator Series.
Write a review
Your Name:Your Review: Note: HTML is not translated!
Rating: Bad Good
Enter the code in the box below:


Latest

Welcome to Patternsmart
Converting your indicator from one platform to another.Custom Alert, Autotrader, Indicators, Scan, Screener, Strategy and Signals.
Copyright @ 2026 Patternsmart - All rights reserved
This website is for educational and informational
purposes only and should not be considered a solicitation to buy or sell a
futures contract or make any other type of investment decision. It's not recommended to use any single indicator as sole evaluation criteria. The companies
and services listed on this website are not to be considered a recommendation
and it is the reader's responsibility to evaluate any product, service, or
company. patternsmart is not responsible for the accuracy or content of any
product, service or company linked to on this website.
Futures trading
contains substantial risk and is not for every investor.Please read the following risk disclosure before considering the
trading of this product:
Futures Risk Disclosure. An investor could
potentially lose all or more than the initial investment. Risk capital is money
that can be lost without jeopardizing ones financial security or life style.
Only risk capital should be used for trading and only those with sufficient risk
capital should consider trading. Past performance is not necessarily indicative
of future results.
Trading stocks, options, futures and forex involves
speculation, and the risk of loss can be substantial.Investor must consider all
relevant risk factors, including their own personal financial situation, before
trading. Trading foreign exchange on margin carries a high level of risk, as
well as its own unique risk factors. Forex investments are subject to
counter-party risk, as there is no central clearing organization for these
transactions. Please read the following risk disclosure before considering the
trading of this product:
Forex Risk Disclosure. Spreads, Straddles, and other multiple-leg option
strategies can entail substantial transaction costs, including multiple
commissions, which may impact any potential return. Options are not suitable for
all investors as the special risks inherent to options trading may expose
investors to potentially rapid and substantial losses. Prior to trading options,
you should carefully read
Characteristics and Risks of Standardized Options.
patternsmart.com
will not be held liable for the loss of money or any damage caused from relying
on the information on this site. Any investment decision you make in your account is solely your responsibility.
TESTIMONIAL DISCLOSURE: TESTIMONIALS APPEARING ON OUR SITE MAY NOT BE REPRESENTATIVE OF THE EXPERIENCE OF OTHER CLIENTS OR CUSTOMERS AND IS NOT A GUARANTEE OF FUTURE PERFORMANCE OR SUCCESS.