
Your shopping cart is empty!
Shopping Cart
0 item(s) - FreeCustomization and Conversion for: Ctrader, MetaTrader(MT4, MT5), Thinkorswim, NinjaTrader, MultiCharts, Tradingview, Prorealtime, SierraChart, etc.
License renew price will be 20% off for the 2nd year and after.
Every Purchase Comes with a Coupon.
Share Your Experience. Help Other Traders Learn. Get Rewarded.
Share Your Experience. Help Other Traders Learn. Get Rewarded.
Featured





CCI Double Divergence Pro for MultiCharts x.NET


 (
(Understanding CCI Double Divergence on MultiCharts x.NET
Financial markets rarely move in a straight line. Periods of aggressive expansion are often followed by contractions, consolidations, or sharp mean-reversions. For traders analyzing market dynamics, one of the most persistent technical challenges is determining whether an extended price move has true underlying momentum or if it is becoming statistically overstretched.
The Commodity Channel Index (CCI) is specifically designed to measure how far price has deviated from its historical statistical average. While standard momentum oscillators track velocity, the CCI highlights extreme price expansions relative to a moving average. When combined with PatternSmart's Double Divergence methodology on the MultiCharts x.NET platform, traders gain a powerful analytical framework for evaluating price behavior, identifying weakening market conviction, and confirming potential reversal opportunities.
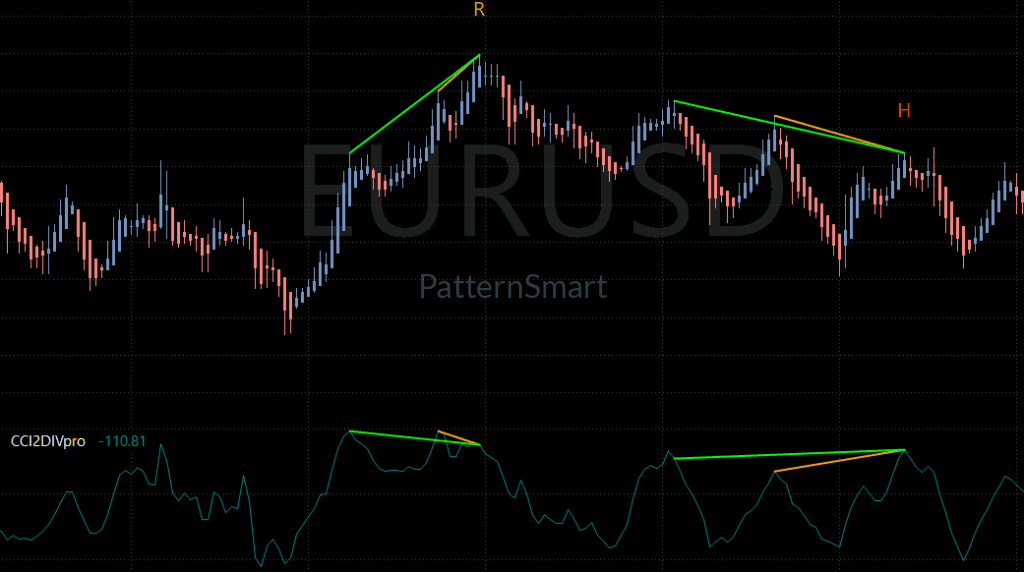
The Analytical Challenge: Evaluating Extended Price Movement
A common trap in technical analysis is assuming that a strong price run will automatically continue or immediately collapse. When price advances rapidly, retail traders often chase the breakout, assuming momentum is accelerating. Conversely, counter-trend traders frequently attempt to "pick tops" simply because price appears high.
Both approaches carry significant risk when executed without structural confirmation. Price can remain extended far longer than anticipated during powerful trends. However, in cyclical or range-bound environments, extended price moves frequently exhaust themselves once buying or selling pressure fades.
The central problem isn't identifying that price has moved far from its average; it is evaluating whether the market still possesses the internal momentum required to sustain that movement. This is where comparing price action against indicator behavior becomes essential.
What Is the Commodity Channel Index (CCI)?
Developed by Donald Lambert, the Commodity Channel Index is an oscillator that measures the difference between price's current level and its statistical moving average, adjusted for average deviation.
-
Baseline Equilibrium: The zero line represents the historical statistical average.
-
Extreme Price Expansion: Values above +100 or below -100 indicate that price has moved significantly away from its mean.
-
Cyclical Normalization: Because price naturally fluctuates around its statistical mean, extreme readings suggest the market may eventually normalize or revert toward equilibrium.
While standard technical indicators measure pure speed, the CCI measures statistical distance. This makes it an ideal analytical tool for identifying overextended conditions and evaluating cyclical market behavior.
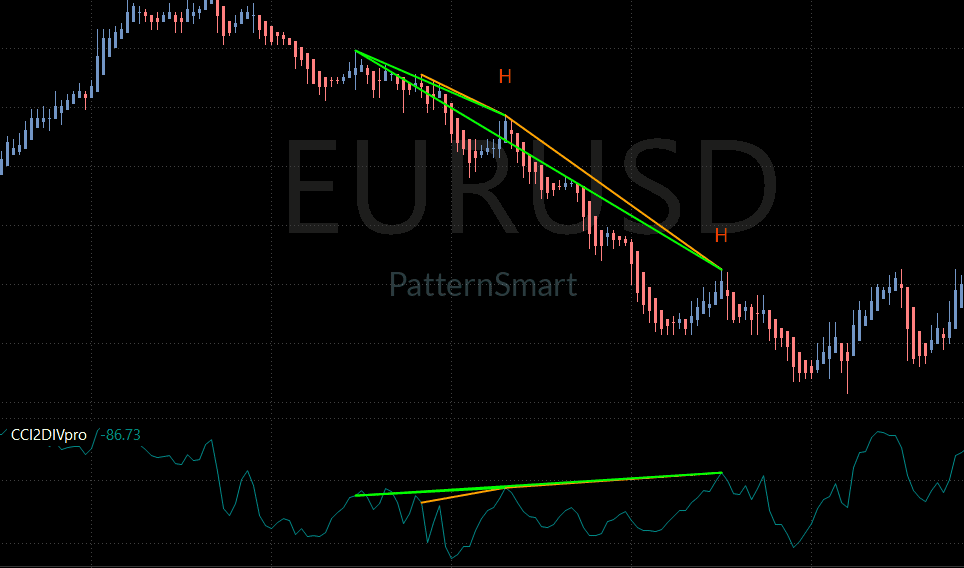
Why Double Divergence Matters in Price Analysis
Divergence occurs when price action and an indicator move in opposite directions. Under normal conditions, a new high in price should be accompanied by a corresponding new high in the indicator. When price establishes a new high but the indicator fails to reach a new peak, a disagreement—or divergence—exists.
Traditional divergence analysis often relies on a single comparison between two swing points. However, isolated divergence signals can occasionally produce noise during strong trends. PatternSmart’s Double Divergence methodology addresses this by applying a multi-layered, confirmation-first approach to structural detection.
Rather than predicting a guaranteed market reversal, Double Divergence provides analytical confirmation that internal market behavior is changing relative to visible price action.
Signal Classifications
-
Bullish Regular Divergence: Price forms a lower low, but the CCI forms a higher low. This indicates that despite lower prices, the downward statistical deviation is losing intensity, suggesting potential downside exhaustion.
-
Bearish Regular Divergence: Price forms a higher high, but the CCI forms a lower high. This indicates that while price reached a new peak, its relative statistical expansion is weakening, highlighting potential buying exhaustion.
-
Bullish Hidden Divergence: Price forms a higher low, but the CCI forms a lower low. This often reflects underlying structural strength during a pullback within an established uptrend.
-
Bearish Hidden Divergence: Price forms a lower high, but the CCI forms a higher high. This often suggests underlying weakness during a temporary bounce within an established downtrend.
Integrating CCI Double Divergence into MultiCharts x.NET
MultiCharts x.NET is a premier platform built for professional technical analysis, quantitative research, and automated strategy development. Offering native C# integration via the .NET framework, it provides high-performance charting and precision data evaluation.
The PatternSmart Double Divergence product family is engineered to maintain identical analytical logic across all platforms while taking full advantage of each platform's native workspace capabilities. On MultiCharts x.NET, the indicator integrates directly into your workspace, providing structured visual confirmation without cluttering your charts.
By utilizing high-performance calculations, the indicator processes historical price structures in real time, delivering clear visual plots and reliable system events for discretionary traders and quantitative developers alike.
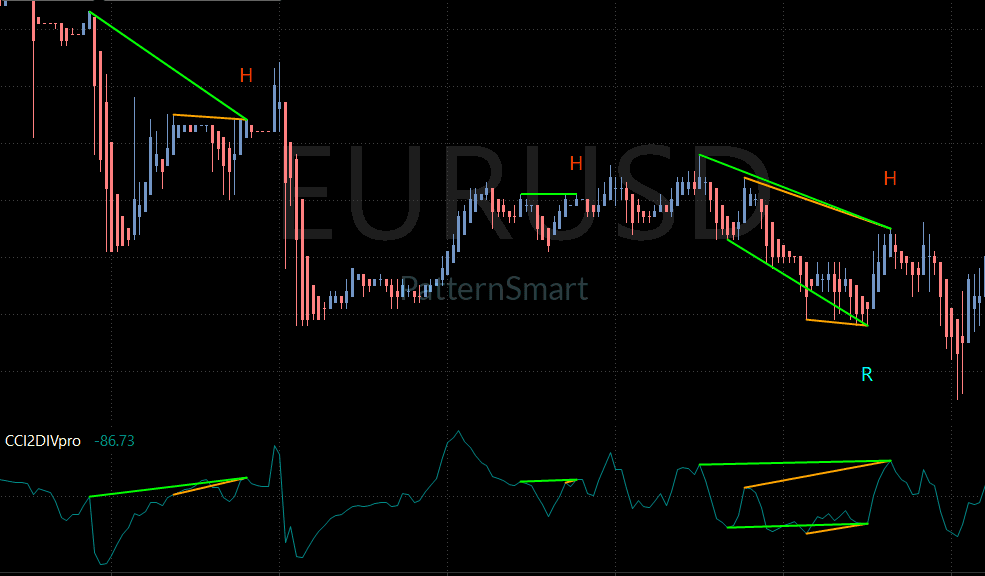
Core Software Capabilities
The CCI Double Divergence Indicator for MultiCharts x.NET offers several configurable inputs to refine structural detection and customize your visual interface.
1. Wait 1 Bar
The Wait 1 Bar setting controls signal confirmation timing. When set to
True, the indicator requires one completed price bar to close after detecting a divergence structure before finalizing the signal. This additional confirmation bar helps prevent premature signal generation during volatile price spikes.2. Enhanced Mode
Located within the signal filtering architecture, Enhanced Mode applies an additional layer of structural validation to detected divergence events. When enabled, the software evaluates specific geometric and historical relationships between swing points, filtering out lower-quality setups and emphasizing robust structural configurations.
3. Divergence Bar Range
The Divergence Bar Range parameter controls the historical search boundary used to locate divergence anchor points. Configurable as
ShortRange, MidRange, or LongRange, it allows traders to adjust whether the calculation engine evaluates tight, short-term price swings or broader, macro-level chart structures.4. Divergence Lookback
The Divergence Lookback setting controls the number of historical bars evaluated when identifying local swing highs and swing lows. Adjusting this value alters the indicator's sensitivity to market turning points, ensuring alignment with your preferred charting timeframe.
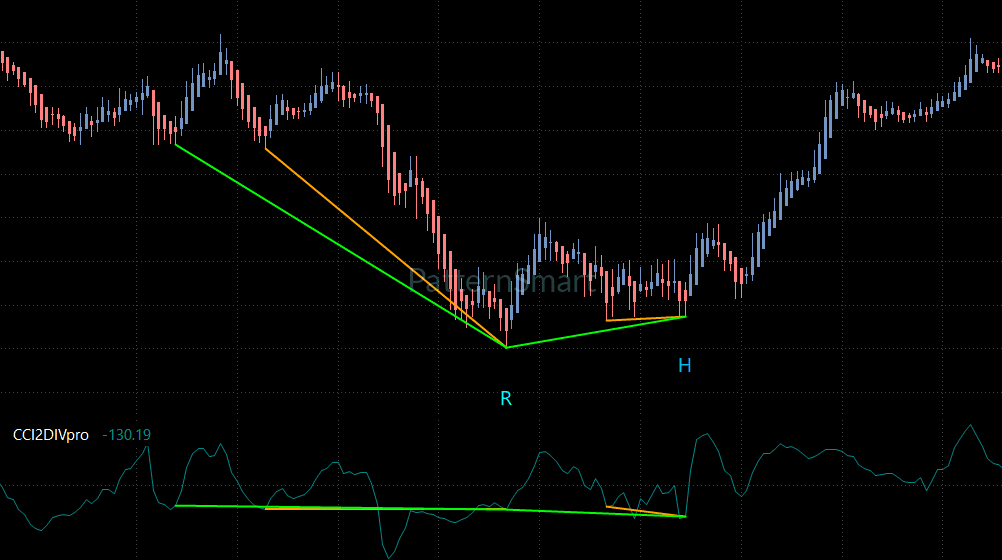
Practical Analytical Benefits
Integrating the CCI Double Divergence Indicator into your technical workflow provides several key advantages:
-
Objective Extreme Identification: Replaces subjective guessing with statistical evaluation of price deviation.
-
Multi-Layered Confirmation: Reduces signal noise by requiring structured validation across multiple price anchor points.
-
Visual Clarity: Plots clear divergence lines and custom labels directly on your charts, simplifying complex structural analysis.
-
Workflow Efficiency: Native MultiCharts x.NET alerts notify you immediately when confirmed setups occur, eliminating the need to monitor every bar manually.
Frequently Asked Questions
Is the Commodity Channel Index the same as the Relative Strength Index (RSI)?
No. While both are momentum oscillators, the RSI measures the speed and magnitude of directional price changes on a bounded scale of 0 to 100. The CCI measures price's statistical deviation from a moving average and is unbounded, making it uniquely suited for analyzing cyclical extremes and mean-reversion potential.
Does a double divergence signal guarantee a market reversal?
No technical indicator guarantees future price movement. Double divergence provides objective evidence that price and indicator momentum are out of alignment. Traders should always evaluate signals within the broader market context, considering key support and resistance levels, market structure, and risk management guidelines.
Can I use the CCI Double Divergence Indicator on any timeframe?
Yes. The underlying analytical methodology is timeframe-independent. Whether applied to 5-minute intraday futures charts or daily stock charts, the structural evaluation of divergence remains constant.
Looking for the complete mathematical breakdown, step-by-step optimization guides, and advanced trading strategies? Explore our comprehensive documentation:
Visit the Technical Inputs Manual: Double Divergence Pro for full parameter tuning.
Read the master guide on the Double Divergence Indicator Series.
Conclusion
Evaluating overextended price movement requires a disciplined framework that separates true momentum from market exhaustion. By combining Donald Lambert’s Commodity Channel Index with PatternSmart’s double divergence detection engine, traders can analyze price deviations with clarity and precision.
When deployed within the professional charting environment of MultiCharts x.NET, the CCI Double Divergence Indicator equips discretionary analysts and systematic traders with the objective confirmation needed to evaluate market structure effectively.
Take the Next Step
Enhance your technical analysis on MultiCharts x.NET with precision divergence detection. Explore the PatternSmart Double Divergence product suite today to bring objective structural confirmation and advanced workflow efficiency to your trading platform.
Write a review
Your Name:Your Review: Note: HTML is not translated!
Rating: Bad Good
Enter the code in the box below:


Latest

Welcome to Patternsmart
Converting your indicator from one platform to another.Custom Alert, Autotrader, Indicators, Scan, Screener, Strategy and Signals.
Copyright @ 2026 Patternsmart - All rights reserved
This website is for educational and informational
purposes only and should not be considered a solicitation to buy or sell a
futures contract or make any other type of investment decision. It's not recommended to use any single indicator as sole evaluation criteria. The companies
and services listed on this website are not to be considered a recommendation
and it is the reader's responsibility to evaluate any product, service, or
company. patternsmart is not responsible for the accuracy or content of any
product, service or company linked to on this website.
Futures trading
contains substantial risk and is not for every investor.Please read the following risk disclosure before considering the
trading of this product:
Futures Risk Disclosure. An investor could
potentially lose all or more than the initial investment. Risk capital is money
that can be lost without jeopardizing ones financial security or life style.
Only risk capital should be used for trading and only those with sufficient risk
capital should consider trading. Past performance is not necessarily indicative
of future results.
Trading stocks, options, futures and forex involves
speculation, and the risk of loss can be substantial.Investor must consider all
relevant risk factors, including their own personal financial situation, before
trading. Trading foreign exchange on margin carries a high level of risk, as
well as its own unique risk factors. Forex investments are subject to
counter-party risk, as there is no central clearing organization for these
transactions. Please read the following risk disclosure before considering the
trading of this product:
Forex Risk Disclosure. Spreads, Straddles, and other multiple-leg option
strategies can entail substantial transaction costs, including multiple
commissions, which may impact any potential return. Options are not suitable for
all investors as the special risks inherent to options trading may expose
investors to potentially rapid and substantial losses. Prior to trading options,
you should carefully read
Characteristics and Risks of Standardized Options.
patternsmart.com
will not be held liable for the loss of money or any damage caused from relying
on the information on this site. Any investment decision you make in your account is solely your responsibility.
TESTIMONIAL DISCLOSURE: TESTIMONIALS APPEARING ON OUR SITE MAY NOT BE REPRESENTATIVE OF THE EXPERIENCE OF OTHER CLIENTS OR CUSTOMERS AND IS NOT A GUARANTEE OF FUTURE PERFORMANCE OR SUCCESS.