Your shopping cart is empty!
Shopping Cart
0 item(s) - FreeCustomization and Conversion for: Ctrader, MetaTrader(MT4, MT5), Thinkorswim, NinjaTrader, MultiCharts, Tradingview, Prorealtime, SierraChart, etc.
License renew price will be 20% off for the 2nd year and after.
Featured

MACD Divergence indicator for Thinkorswim TOS


") (
(VIP member get 20% off, click here to become a VIP member.
The price is for the package.
This product is part of the: MACD Divergence Indicator all-in-one package for Thinkorswim
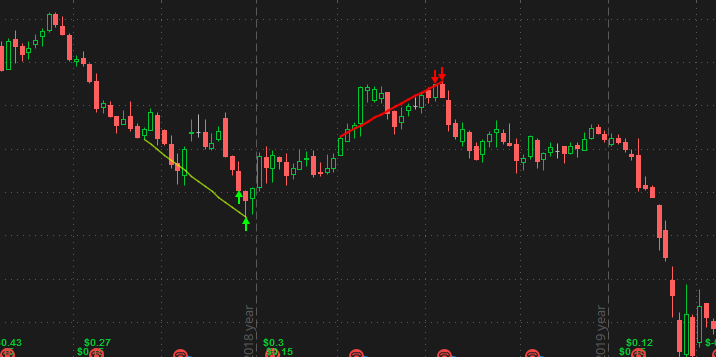
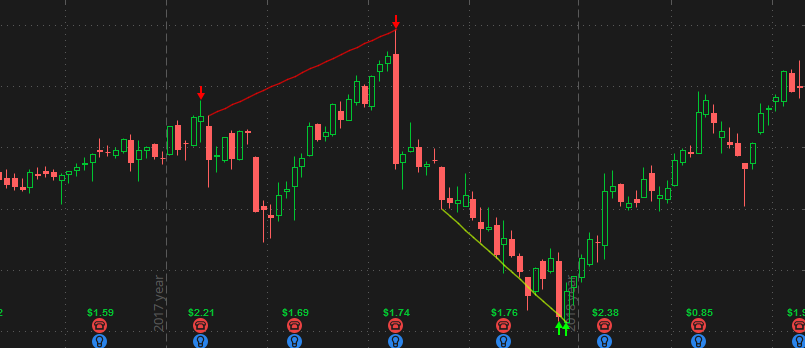
Divergence emerges when price and oscillator indicator move in different directions.
For instance, an uptrend Negative Divergence occurs when price reaches a higher high, but the indicator fails to follow. In a downtrend, positive divergence occurs when price reaches a lower low, yet the indicator does not reach a lower low.
For instance, an uptrend Negative Divergence occurs when price reaches a higher high, but the indicator fails to follow. In a downtrend, positive divergence occurs when price reaches a lower low, yet the indicator does not reach a lower low.
For the most part, oscillator indicators and price trailing each other and move in the same direction. However, when they start to drift apart, the current trade may consolidate or exhibit a reverse pattern.
The indicator will plot the divergence trend line for the latest signal only, it will reduce loading time and consume less computer resources.

MACD divergence is one of the most powerful and widely-used techniques in technical analysis because it signals shifts in momentum that often precede price reversals. Here's why it's so valuable for traders:
Core Reason for Usefulness: MACD divergence highlights a growing disconnect between price action and the underlying momentum measured by the MACD. This warns that the current trend is weakening and may be nearing exhaustion, potentially leading to a reversal.
Key Benefits & Why Traders Use It:
-
Early Reversal Warning (Leading Indicator):
-
Like Stochastic divergence, MACD divergence often appears before the price actually reverses. This gives traders a potential head-start to prepare for entries or exits.
-
Example: Price makes a new high, but the MACD histogram makes a lower peak or the MACD line makes a lower high. This "bearish divergence" signals fading upside momentum despite the higher price, hinting at a potential downturn.
-
-
Identifies Trend Exhaustion: It objectively shows when a strong trend is running out of steam, even if the price is still making marginal new highs/lows. This helps avoid chasing moves near their end.
-
Confirms Price Action Signals: Divergence adds weight to other reversal signals:
-
A bearish candlestick pattern (like a shooting star) at resistance plus bearish MACD divergence is a much stronger signal than either alone.
-
A break of a trendline plus divergence increases confidence in the breakout's significance.
-
-
Pinpoints High-Probability Entry/Exit Zones:
-
Bullish Divergence (Price Lower Low, MACD Higher Low): Signals potential upside reversal. Traders look for entries near support, anticipating a bounce.
-
Bearish Divergence (Price Higher High, MACD Lower High): Signals potential downside reversal. Traders look to exit longs, tighten stops, or initiate shorts near resistance.
-
Hidden Divergence (Less Common but Powerful for Continuation):
-
Hidden Bullish: Price makes a Higher Low (pullback), but MACD makes a Lower Low. Suggests the pullback is weak and the uptrend is likely to resume.
-
Hidden Bearish: Price makes a Lower High (correction), but MACD makes a Higher High. Suggests the correction is weak and the downtrend is likely to resume.
-
-
-
Works Across Timeframes: Effective on intraday charts for short-term trades and daily/weekly charts for swing/position trading (though longer timeframes are generally more reliable).
-
Focus on Momentum Shift: MACD is inherently a momentum indicator. Divergence directly shows a change in the momentum driving the price, which is often the precursor to a price change.
Important Considerations & Limitations:
-
Not a Standalone Signal: ALWAYS CONFIRM with other technical tools:
-
Price Action: Support, Resistance, Trendlines, Chart Patterns .
-
Volume: Increasing volume on the reversal move validates the divergence.
-
Candlestick Patterns: Reversal patterns at the divergence point add significant weight.
-
Market Context: Is the divergence occurring within a larger trend, at key S/R, or during overbought/oversold conditions?
-
-
False Signals: Divergence can appear, but the trend continues ("Divergence Resolution"). This is more common in very strong, persistent trends. The trend is your friend until the end.
-
Timing: Divergence signals potential reversal, not immediate reversal. The reversal might take time to materialize. Patience is key.
-
Histogram is Key: The MACD histogram is often the most sensitive and earliest component to show divergence due to its focus on the acceleration/deceleration between the MACD line and Signal line.
-
Stronger Signals:
-
Divergence appearing on longer timeframes (Daily, Weekly) is more significant.
-
Convergence of signals (divergence + S/R break + reversal candle) is strongest.
-
Divergence at clear support/resistance levels is high-probability.
-
In Summary:
MACD divergence is useful because it provides an early, objective warning of weakening momentum within a trend, often foreshadowing reversals or significant corrections. By identifying these momentum shifts, traders can:
-
Anticipate potential trend reversals for better entry/exit timing.
-
Manage risk by signaling when a trend might be losing steam.
-
Avoid chasing moves near exhaustion points.
-
Gain high-probability trading signals when divergence aligns with other technical confirmation (price action, volume, patterns).
Think of it as the market whispering, "Hey, this push higher/lower isn't as strong as it looks..." Mastering MACD divergence, especially using the histogram, and combining it with sound price action analysis significantly enhances a trader's ability to read the market and identify high-potential opportunities. Remember: Confirmation is crucial.
The indicator will plot the divergence trend line for the latest signal only, it will reduce loading time and consume less computer resources.
Features:
- Alert: provide both sound and message alert whenever a divergence is found. You can turn it on or off.
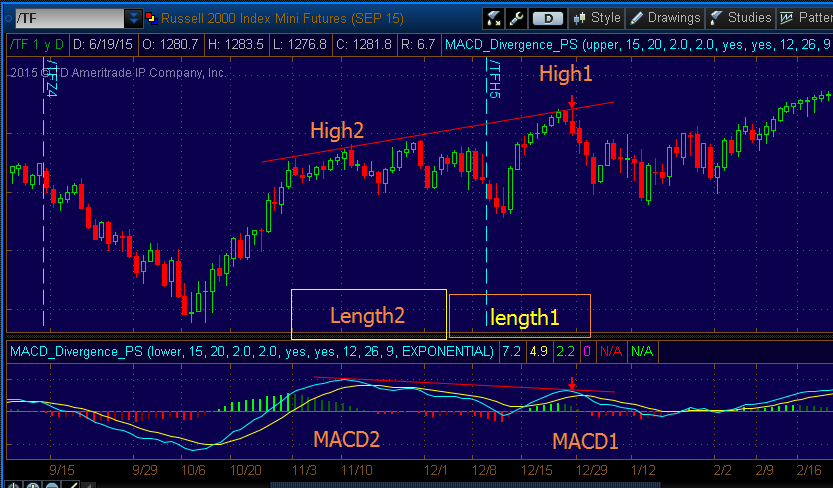
- Length 1&2: Define the range of bars which are used to calculate the recent High and previous High, as shown in the picture.
- MACD_mode: Choose "Upper" to only plot signal arrows on price chart.
Choose "lower" it will plot as a MACD indicator with divergence signals.
- Percent: The difference between High1 and High2, as shown in picture.
- MACD_Percent: The difference between MACD1 and MACD2, as shown in picture.
- All Parameters of MACD: Adjust the inputs of MACD indicator.
There are more than one algorithm can be used to define a divergence.
This divergence indicator used the following method to check if there is a divergence signal on the chart.
First, it will locate the recent price high (High1) within the given range(from input length1) and the MACD1 value at the same bar of High1.
Secondly, it will locate the previous price high (High2) (from input length2) and the MACD2 value at the same bar of High2.
Then it will check if there is a divergence based on High1, High2, MACD1 and MACD2.
For example, if High1 is greater than High2 and MACD1 is less than MACD2, then it will plot an arrow right away.
The following chart is a demonstration of the inputs listed above.
How to use:
The purpose of divergence indicator is to point when price trend are moving into opposite direction.
Negative divergence:
First, we need to locate the recent High1 and its MACD1 value within the given range(length1).
Secondly, we find the previous High2 and its MACD2 value within the given range(length2).
Then we compare the ratio of these 2 Highs and MACD values to determine if they meet the percentage you set.

For example, if you set "percent=3", then it will check if High1 is greater than High2 by 3%. If you set "MACD percent=5" then it will check if MACD1 is less than MACD2 by 5%.
If both percent conditions are met, there will be a red arrow pointing downward.
Positive divergence:
The indicator will find the recent Low1 and its MACD1 value within the given range(length1).
And then it will find the previous Low2 and its MACD2 value within the given range(length2).
If you set "percent=1", then it will check if Low1 is less than Low2 by 1%. If you set "MACD percent=5" then it will check if MACD1 is greater than MACD2 by 5%.
If both percent conditions are met, there will be a green arrow pointing upward.
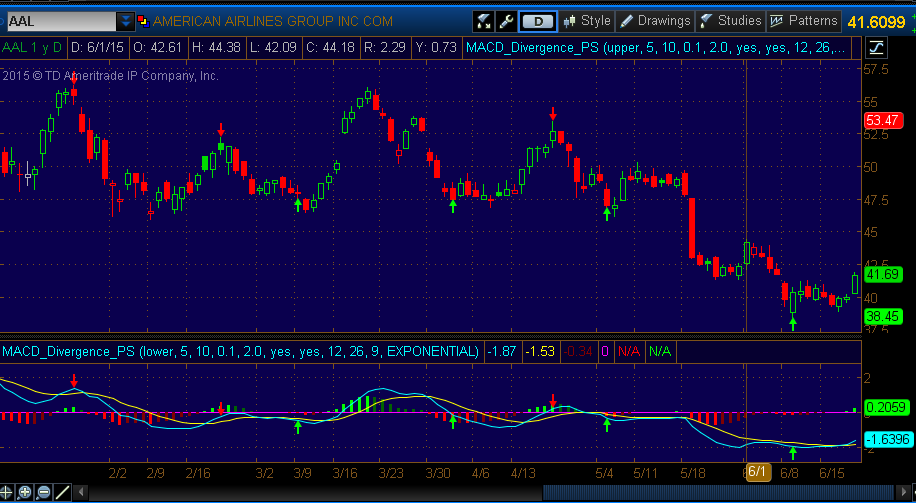
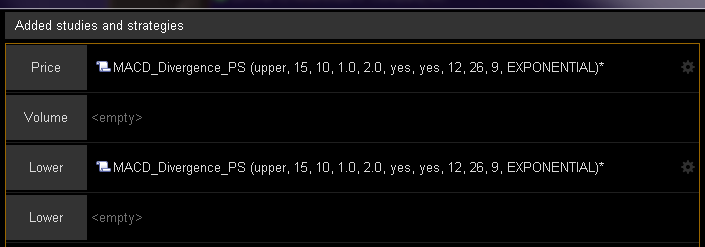
Please note: in order to plot this indicator on both price chart and lower chart, you need to load it in two places. And set MACD_mode to "Upper" in Price chart and MACD_mode to "lower" in Lower chart. As shown in the following picture.
If you want the same signals on both charts, all parameters have to be consistent on both sides.
This indicator works in any time period and applicable for all securities(Stocks, Futures, Forex, Options, ETF, etc.).
When you use this indicator in a minute chart, it's better to set "percent" less than 1, otherwise, lots of signals will be filtered.
If you want to add any feature to this indicator, please send us a Customization request.
Write a review
Your Name:Your Review: Note: HTML is not translated!
Rating: Bad Good
Enter the code in the box below:


Latest


")


Welcome to Patternsmart
Converting your indicator from one platform to another.Custom Alert, Autotrader, Indicators, Scan, Screener, Strategy and Signals.
Copyright @ 2025 Patternsmart - All rights reserved
This website is for educational and informational
purposes only and should not be considered a solicitation to buy or sell a
futures contract or make any other type of investment decision. It's not recommended to use any single indicator as sole evaluation criteria. The companies
and services listed on this website are not to be considered a recommendation
and it is the reader's responsibility to evaluate any product, service, or
company. patternsmart is not responsible for the accuracy or content of any
product, service or company linked to on this website.
Futures trading
contains substantial risk and is not for every investor.Please read the following risk disclosure before considering the
trading of this product:
Futures Risk Disclosure. An investor could
potentially lose all or more than the initial investment. Risk capital is money
that can be lost without jeopardizing ones financial security or life style.
Only risk capital should be used for trading and only those with sufficient risk
capital should consider trading. Past performance is not necessarily indicative
of future results.
Trading stocks, options, futures and forex involves
speculation, and the risk of loss can be substantial.Investor must consider all
relevant risk factors, including their own personal financial situation, before
trading. Trading foreign exchange on margin carries a high level of risk, as
well as its own unique risk factors. Forex investments are subject to
counter-party risk, as there is no central clearing organization for these
transactions. Please read the following risk disclosure before considering the
trading of this product:
Forex Risk Disclosure. Spreads, Straddles, and other multiple-leg option
strategies can entail substantial transaction costs, including multiple
commissions, which may impact any potential return. Options are not suitable for
all investors as the special risks inherent to options trading may expose
investors to potentially rapid and substantial losses. Prior to trading options,
you should carefully read
Characteristics and Risks of Standardized Options.
patternsmart.com
will not be held liable for the loss of money or any damage caused from relying
on the information on this site. Any investment decision you make in your account is solely your responsibility.
TESTIMONIAL DISCLOSURE: TESTIMONIALS APPEARING ON OUR SITE MAY NOT BE REPRESENTATIVE OF THE EXPERIENCE OF OTHER CLIENTS OR CUSTOMERS AND IS NOT A GUARANTEE OF FUTURE PERFORMANCE OR SUCCESS.