
Your shopping cart is empty!
Shopping Cart
0 item(s) - FreeCustomization and Conversion for: Ctrader, MetaTrader(MT4, MT5), Thinkorswim, NinjaTrader, MultiCharts, Tradingview, Prorealtime, SierraChart, etc.
License renew price will be 20% off for the 2nd year and after.
Every Purchase Comes with a Coupon.
Share Your Experience. Help Other Traders Learn. Get Rewarded.
Share Your Experience. Help Other Traders Learn. Get Rewarded.
Featured





Stochastics Double Divergence Pro Indicator for cTrader

 (
(Introduction
In modern technical analysis, the challenge is rarely a lack of information; it is the difficulty of filtering noise from genuine market transitions. While standard oscillator studies often highlight localized extreme points, they frequently fail to distinguish between normal minor corrections and structural exhaustion.
The Stochastics Double Divergence indicator for cTrader provides a disciplined, professional solution to this challenge. By combining PatternSmart’s structured Double Divergence methodology with the highly responsive mechanics of the Stochastics oscillator, this tool provides systematic visual evidence of changing market dynamics. Rather than relying on simple, unconfirmed overbought or oversold levels, this indicator analyzes the relationship between multi-point price swings and oscillator behavior to deliver higher-quality, confirmation-first technical observations directly onto your cTrader charts.
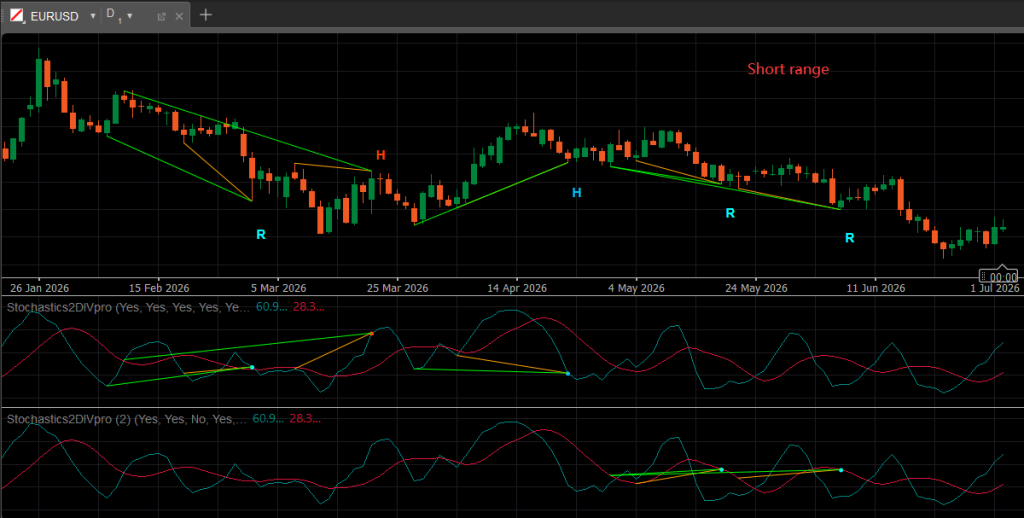
Understanding Stochastics & Double Divergence
The classic Stochastics oscillator measures the relative position of a financial instrument's closing price within its recent high-low range. Under normal conditions, closing prices tend to cluster near the upper end of the range during expansions and near the lower end during corrections.
A traditional divergence occurs when this relationship breaks down—for instance, when price establishes a lower low, but the Stochastics indicator stabilizes and forms a higher low. This indicates that despite the drop in price, the internal closing momentum is shifting.
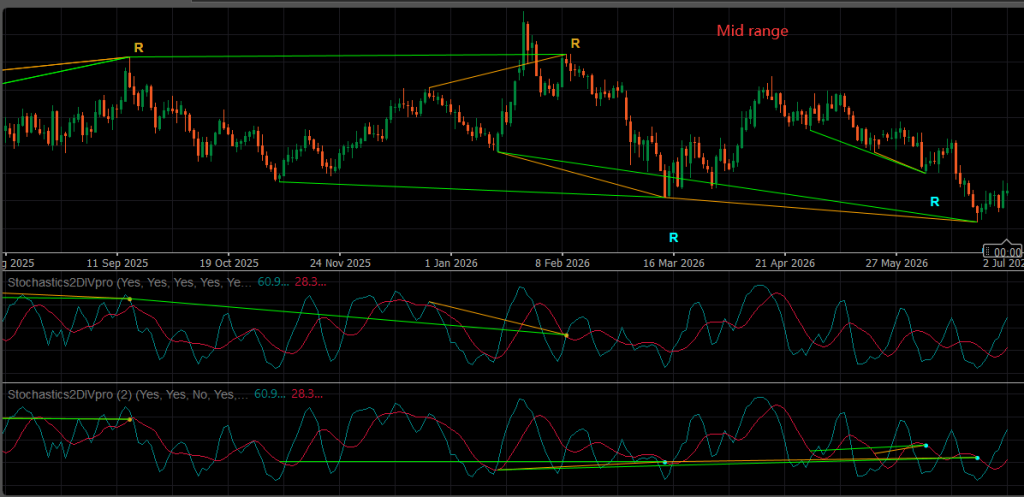
The Double Divergence Advantage
Traditional divergence indicators often track isolated, two-point comparisons that can generate excessive market noise. The PatternSmart Double Divergence methodology addresses this limitation by emphasizing technical confirmation.
Instead of treating every localized divergence as a trading signal, the methodology:
-
Evaluates structured multi-point swings to verify that a discrepancy between price and momentum is mathematically robust.
-
Categorizes observations systematically, enabling traders to differentiate between potential trend reversals and trend continuation patterns.
-
Minimizes isolated signals in favor of clustered evidence, aligning with the core philosophy that price action leads, while indicators confirm.
Signal Classification Framework
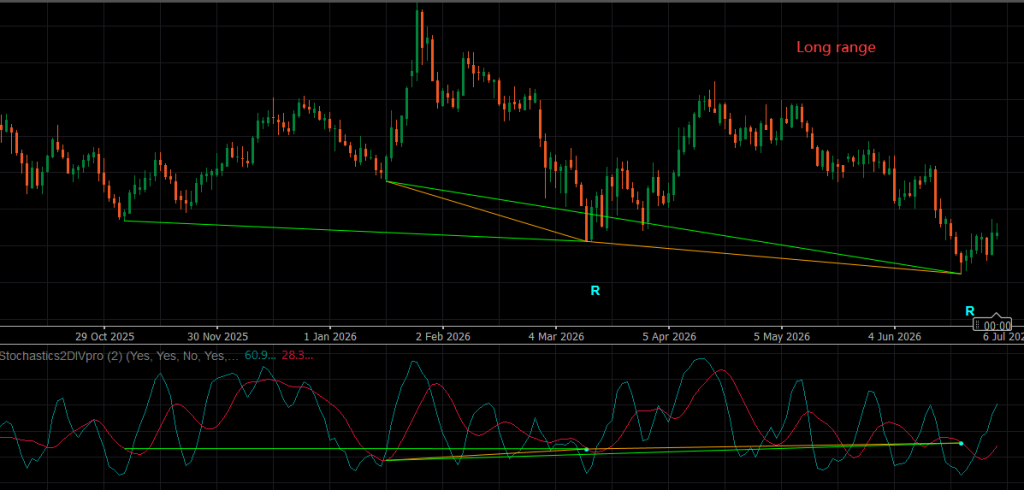
The Stochastics Double Divergence indicator automatically identifies and visualizes four key divergence categories on your cTrader charts. These categories organize market observations into distinct, structured concepts:
1. Bullish Regular Divergence
-
Structure: Price forms a lower low, while the Stochastics oscillator forms a higher low.
-
Analytical Interpretation: This indicates that selling pressure is losing intensity relative to the underlying price movement. It serves as potential evidence of a shift in short-term bearish momentum.
2. Bearish Regular Divergence
-
Structure: Price forms a higher high, while the Stochastics oscillator forms a lower high.
-
Analytical Interpretation: This suggests that buying pressure is stalling despite rising prices, presenting potential evidence that short-term bullish momentum is exhausting.
3. Bullish Hidden Divergence
-
Structure: Price forms a higher low, while the Stochastics oscillator forms a lower low.
-
Analytical Interpretation: This typically occurs during temporary corrections within an established bullish market structure. It suggests that underlying upward momentum remains intact despite a deeper pullback in the oscillator, supporting potential trend continuation analysis.
4. Bearish Hidden Divergence
-
Structure: Price forms a lower high, while the Stochastics oscillator forms a higher high.
-
Analytical Interpretation: Commonly found during corrective bounces within a broader downward trend. It indicates that the bearish trend remains technically consistent despite short-term upward price fluctuations.
Note on Probability: Within the PatternSmart philosophy, these classifications represent structured visual evidence of momentum discrepancies. They are probabilistic observations rather than predictive guarantees or direct trading instructions.
The cTrader User Experience
The cTrader platform is celebrated for its highly responsive charting engine, modern C#-based API, and clean user interface. The Stochastics Double Divergence indicator has been built natively for cTrader to maximize these platform-specific workflows:
+---------------------------------------------------------+
| [Price Chart]                                           |
|       /\            /\ (Bearish Regular Divergence)     |
|      /  \    /\    /  \      [Red Trendline on Price]   |
|     /    \__/  \__/    \                                |
+---------------------------------------------------------+
| [Stochastics Window]                                    |
|       /\                                                |
|      /  \    /\    /\        [Red Trendline on Osc]     |
|     /    \__/  \__/  \                                  |
|                 (Lower High)                            |
+---------------------------------------------------------+
-
Seamless Rendering: Multi-point divergence lines are drawn cleanly on both the main price chart and the sub-window Stochastics panel.
-
Intelligent Tooltips & Labels: Hovering over a detected divergence displays precise structural data (e.g., structural price points and corresponding Stochastic percentages).
-
Asynchronous Alert Engine: Leverages cTrader’s native notification system to deliver immediate, real-time alerts (visual pop-ups, sound cues, and email/Telegram routing integrations) at the precise moment a divergence structure is validated on the bar close.
-
Unified Workspace Integration: Adapts beautifully to multi-timeframe layouts, allowing you to synchronize and monitor multiple charts simultaneously without performance degradation.
Practical Trading Applications & Best Practices
To extract the highest analytical value from Stochastics Double Divergence, traders should integrate the indicator into a broader, disciplined technical workflow:
Analyze Before Acting
The appearance of a divergence line should never trigger an immediate market entry. Instead, view it as an analytical prompt to assess the surrounding market structure. Always execute analysis in a structured sequence:
$$\text{Observe Divergence} \longrightarrow \text{Evaluate Context} \longrightarrow \text{Seek Confirmation} \longrightarrow \text{Execute Decision}$$
Look for Support and Resistance Alignment
Regular divergences carry significantly higher analytical weight when they develop near major historical levels:
-
A Bullish Regular Divergence forming precisely at a major daily support level suggests that the support zone is actively holding, as backed by shifting short-term momentum.
-
A Bearish Regular Divergence forming at a key overhead resistance level increases the probability of a pullback, as the buying pressure is visibly drying up at structural extremes.
Leverage Multi-Timeframe Confirmation
To filter out short-term market noise, always compare observations across multiple horizons:
-
Identify the Broad Trend: Determine the market direction on a higher timeframe chart (e.g., 4-Hour or Daily).
-
Scan the Execution Chart: Look for Hidden Divergences on your primary trading timeframe (e.g., 15-Minute or 1-Hour) that align with that higher-timeframe trend. Trading in the direction of the dominant trend significantly improves decision quality.
FAQs (Frequently Asked Questions)
Is Stochastics Double Divergence suitable for day trading or swing trading?
The indicator is highly versatile and applies to any timeframe supported by cTrader. Swing traders often benefit from the reduced noise of daily and 4-hour charts, whereas day traders use it on 5-minute or 15-minute charts to identify short-term momentum shifts. On shorter timeframes, incorporating independent technical confirmation is critical to filter out intraday noise.
Does this indicator repaint historical signals?
No. To maintain complete technical accuracy, the Stochastics Double Divergence indicator validates its swing structures and divergence lines only upon the official close of a bar. Once a divergence is confirmed and plotted, it remains fixed in place on your historical charts.
Can I customize the Stochastics periods and sensitivity?
Yes. Via the standard cTrader indicator settings, you can fully configure the $\%K$ period, $\%D$ period, slowing factor, and price source, alongside the specific swing-point lookback criteria used to identify the multi-point price peaks and troughs.
Should I use other indicators alongside this tool?
Yes. No individual technical tool provides a complete market picture. The PatternSmart methodology strongly encourages combining Stochastics Double Divergence with complementary, non-redundant technical tools such as support/resistance zones, candlestick price action, or trend strength indicators like the ADX.
Conclusion
The Stochastics Double Divergence indicator for cTrader elevates a classic oscillator study into a highly structured, professional analysis tool. By automating the identification of multi-point regular and hidden divergences, it enables traders to look past raw price movement and monitor the momentum shifting underneath. When utilized within a disciplined, confirmation-first workflow, this tool becomes an invaluable asset for navigating changing market dynamics with precision.
Looking for the complete mathematical breakdown, step-by-step optimization guides, and advanced trading strategies? Explore our comprehensive documentation:
-
Read the master guide on the Double Divergence Indicator Series.
-
Visit the Technical Inputs Manual: Double Divergence Pro for full parameter tuning.
Write a review
Your Name:Your Review: Note: HTML is not translated!
Rating: Bad Good
Enter the code in the box below:

Latest

Welcome to Patternsmart
Converting your indicator from one platform to another.Custom Alert, Autotrader, Indicators, Scan, Screener, Strategy and Signals.
Copyright @ 2026 Patternsmart - All rights reserved
This website is for educational and informational
purposes only and should not be considered a solicitation to buy or sell a
futures contract or make any other type of investment decision. It's not recommended to use any single indicator as sole evaluation criteria. The companies
and services listed on this website are not to be considered a recommendation
and it is the reader's responsibility to evaluate any product, service, or
company. patternsmart is not responsible for the accuracy or content of any
product, service or company linked to on this website.
Futures trading
contains substantial risk and is not for every investor.Please read the following risk disclosure before considering the
trading of this product:
Futures Risk Disclosure. An investor could
potentially lose all or more than the initial investment. Risk capital is money
that can be lost without jeopardizing ones financial security or life style.
Only risk capital should be used for trading and only those with sufficient risk
capital should consider trading. Past performance is not necessarily indicative
of future results.
Trading stocks, options, futures and forex involves
speculation, and the risk of loss can be substantial.Investor must consider all
relevant risk factors, including their own personal financial situation, before
trading. Trading foreign exchange on margin carries a high level of risk, as
well as its own unique risk factors. Forex investments are subject to
counter-party risk, as there is no central clearing organization for these
transactions. Please read the following risk disclosure before considering the
trading of this product:
Forex Risk Disclosure. Spreads, Straddles, and other multiple-leg option
strategies can entail substantial transaction costs, including multiple
commissions, which may impact any potential return. Options are not suitable for
all investors as the special risks inherent to options trading may expose
investors to potentially rapid and substantial losses. Prior to trading options,
you should carefully read
Characteristics and Risks of Standardized Options.
patternsmart.com
will not be held liable for the loss of money or any damage caused from relying
on the information on this site. Any investment decision you make in your account is solely your responsibility.
TESTIMONIAL DISCLOSURE: TESTIMONIALS APPEARING ON OUR SITE MAY NOT BE REPRESENTATIVE OF THE EXPERIENCE OF OTHER CLIENTS OR CUSTOMERS AND IS NOT A GUARANTEE OF FUTURE PERFORMANCE OR SUCCESS.