Your shopping cart is empty!
Shopping Cart
0 item(s) - FreeCustomization and Conversion for: Ctrader, MetaTrader(MT4, MT5), Thinkorswim, NinjaTrader, MultiCharts, Tradingview, Prorealtime, SierraChart, etc.
License renew price will be 20% off for the 2nd year and after.
Featured
RSI divergence indicator special edition for Thinkorswim TOS

") (
(VIP member get 10% off, click here to become a VIP member.
RSI divergence indicator package include:
-
RSI divergence indicator special edition
-
The special edition contains two parts: a main chart and a lower chart with normal RSI plot. Both charts come with arrows to point out an occurrence of a divergence.
-
-
RSI divergence special edition SCAN
-
This customized scanner will find all Positive/Negative (bearish/bullish) RSI Divergence based on your settings.
-
-
RSI divergence special edition custom quote(watchlist column)
-
This custom quote will help you to quickly identify the RSI Divergence signals in the Watchlist. It will detect all Positive/Negative (bearish/bullish) RSI Divergence based on your settings.
-
Sometimes, there are too many divergence signals, and that is not a good thing for traders. Hence, we developed this special edition package to help you pinpoint the most valuable signals.
Unlike the regular divergence indicator, this special edition used a unique algorithm to filter out some noises(minor divergence).
You may only see one signal in six months on a daily chart.RSI divergence is one of the most trusted tools in technical trading because it reveals hidden momentum shifts that often precede price reversals. Here’s why it’s powerful, how to use it, and its edge over other indicators:
Why RSI Divergence Matters: Core Strengths
-
Flags Exhaustion in Trends
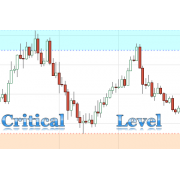
RSI divergence signals when a trend is losing momentum despite price pushing to new extremes. This often occurs at market tops/bottoms.-
Bearish Divergence: Price ↑ (higher high), RSI ↓ (lower high) → Selling pressure builds.
-
Bullish Divergence: Price ↓ (lower low), RSI ↑ (higher low) → Buying pressure builds.
-
-
Works at Key Overbought/Oversold Zones
RSI divergence near RSI > 70 (overbought) or RSI < 30 (oversold) amplifies reversal odds:-
Bearish divergence + RSI > 70 = High-probability sell signal.
-
Bullish divergence + RSI < 30 = High-probability buy signal.
-
-
Fewer False Signals Than Price Action
Unlike support/resistance breaks (which can fake out), RSI divergence reflects internal momentum decay – a more reliable reversal predictor. -
Identifies Continuations (Hidden Divergence)
-
Hidden Bullish Divergence: Price ↑ (higher low), RSI ↓ (lower low) → Uptrend likely to resume.
-
Hidden Bearish Divergence: Price ↓ (lower high), RSI ↑ (higher high) → Downtrend likely to resume.
-
Real Trading Applications & Examples
Scenario 1: Reversing a Downtrend (Bullish Divergence)
-
Price: Makes a new low (LL2).
-
RSI: Forms a higher low (HL) > 30 (oversold).
-
Action:
-
Watch for a bullish candle (e.g., hammer) at LL2.
-
Enter long with stop-loss below LL2.
-
Target: Nearest resistance level.
→ Signals exhaustion of sellers, impending bounce.
-
Scenario 2: Topping an Uptrend (Bearish Divergence)
-
Price: Makes a new high (HH2).
-
RSI: Forms a lower high (LH) < 70 (overbought).
-
Action:
-
Short on confirmation (e.g., bearish engulfing candle).
-
Stop-loss above HH2.
-
Target: Support or 1.5x risk.
→ Signals fading buyers, reversal imminent.
-
Scenario 3: Trend Continuation (Hidden Divergence)
-
Uptrend Pullback: Price ↑ (higher low), RSI ↓ (lower low).
-
Action: Buy the dip → Confirms trend strength.
Why RSI Divergence Beats Other Indicators
| Feature | RSI | Stochastic/MACD/Williams %R |
|---|---|---|
| Overbought/Oversold | Clear thresholds (30/70) | Less defined zones |
| Sensitivity | Balanced – fewer false signals | Williams %R more volatile |
| Trend Confirmation | Hidden divergence for continuations | MACD better for trends |
| Ease of Use | Simple visual divergences | MACD histogram complex for beginners |
Limitations & Risk Management
-
Not Standalone: Always pair with:
-
Price structure (support/resistance, trendlines).
-
Volume surges (confirms momentum shift).
-
Candlestick patterns (e.g., doji at divergence point).
-
-
False Signals in Strong Trends:
-
In parabolic moves, RSI can diverge early → Wait for price confirmation (e.g., break of trendline).
-
-
Timeframe Sensitivity:
-
Daily/weekly divergence > hourly > 5-min.
-
-
RSI Settings:
-
Default: 14 periods. Shorten (e.g., 9) for day trading; lengthen (e.g., 21) for swing trades.
-
Tactical Edge: How Pros Use It
-
Swing Traders: Spot reversals at key S/R with 4H/daily RSI divergence.
-
Day Traders: Combine 15-min RSI divergence with VWAP and volume profiles.
-
Crypto Traders: Use RSI divergence to fade extreme FOMO pumps/dumps.
Classic Example:
NASDAQ 100 (2020 COVID crash):
-
Price made lower lows in March.
-
RSI printed higher lows (bullish divergence) → Preceded a 70% rally.
Key Takeaway
RSI divergence works because it:
✅ Exposes momentum decay before price reverses.
✅ Adds conviction to overbought/oversold readings.
✅ Fits multiple strategies (reversal, continuation).
Always wait for confirmation – divergence alone isn’t a trigger. When aligned with price action and volume, it becomes a high-probability weapon in your trading arsenal.
") RSI div sp01
RSI div sp01") RSI div sp02
RSI div sp02") RSI div sp03
RSI div sp03") RSI div sp04
RSI div sp04") RSI div sp05
RSI div sp05") RSI div sp06
RSI div sp06") RSI div sp07
RSI div sp07") RSI div sp08
RSI div sp08") RSI div sp09
RSI div sp09") RSI div sp10
RSI div sp10
Write a review
Your Name:Your Review: Note: HTML is not translated!
Rating: Bad Good
Enter the code in the box below:


Latest
Welcome to Patternsmart
Converting your indicator from one platform to another.Custom Alert, Autotrader, Indicators, Scan, Screener, Strategy and Signals.
Copyright @ 2026 Patternsmart - All rights reserved
This website is for educational and informational
purposes only and should not be considered a solicitation to buy or sell a
futures contract or make any other type of investment decision. It's not recommended to use any single indicator as sole evaluation criteria. The companies
and services listed on this website are not to be considered a recommendation
and it is the reader's responsibility to evaluate any product, service, or
company. patternsmart is not responsible for the accuracy or content of any
product, service or company linked to on this website.
Futures trading
contains substantial risk and is not for every investor.Please read the following risk disclosure before considering the
trading of this product:
Futures Risk Disclosure. An investor could
potentially lose all or more than the initial investment. Risk capital is money
that can be lost without jeopardizing ones financial security or life style.
Only risk capital should be used for trading and only those with sufficient risk
capital should consider trading. Past performance is not necessarily indicative
of future results.
Trading stocks, options, futures and forex involves
speculation, and the risk of loss can be substantial.Investor must consider all
relevant risk factors, including their own personal financial situation, before
trading. Trading foreign exchange on margin carries a high level of risk, as
well as its own unique risk factors. Forex investments are subject to
counter-party risk, as there is no central clearing organization for these
transactions. Please read the following risk disclosure before considering the
trading of this product:
Forex Risk Disclosure. Spreads, Straddles, and other multiple-leg option
strategies can entail substantial transaction costs, including multiple
commissions, which may impact any potential return. Options are not suitable for
all investors as the special risks inherent to options trading may expose
investors to potentially rapid and substantial losses. Prior to trading options,
you should carefully read
Characteristics and Risks of Standardized Options.
patternsmart.com
will not be held liable for the loss of money or any damage caused from relying
on the information on this site. Any investment decision you make in your account is solely your responsibility.
TESTIMONIAL DISCLOSURE: TESTIMONIALS APPEARING ON OUR SITE MAY NOT BE REPRESENTATIVE OF THE EXPERIENCE OF OTHER CLIENTS OR CUSTOMERS AND IS NOT A GUARANTEE OF FUTURE PERFORMANCE OR SUCCESS.