Your shopping cart is empty!
Shopping Cart
0 item(s) - FreeCustomization and Conversion for: Ctrader, MetaTrader(MT4, MT5), Thinkorswim, NinjaTrader, MultiCharts, Tradingview, Prorealtime, SierraChart, etc.
License renew price will be 20% off for the 2nd year and after.
Featured


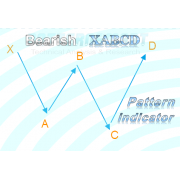
Rising Wedge Chart pattern indicator for NinjaTrader 8

") (
(Please note that this purchase is a 1-Year license. About License renew.
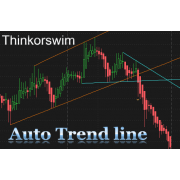
It will draw two trend lines of the Rising Wedge on chart when the pattern is formed.
Features:
There is a plot that can be used from other NinjaScript, such as Strategy and Market Analyzer.
They will show up on current bar, no delay, no repaint or back-paint.
In default, the color is transparent, if you need to see the plots on the chart, just change its color to your desired ones.

Click an image to view at full size.
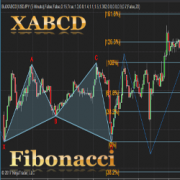
The Rising Wedge is a powerful and highly reliable chart pattern that traders prize for its ability to signal an impending breakdown. Its usefulness stems from its ability to identify a period of weakening momentum and distribution during an uptrend, often preceding a significant drop.
Think of it as a tightening coil of optimism that eventually snaps under its own weight.
Here’s a detailed breakdown of why it's such a valuable, if not cautionary, tool for traders.
1. It Captures a Specific Market Psychology: Weakening of Buyers
The pattern tells a story of a struggle where buyers are progressively losing conviction, even as they push prices to marginal new highs.
-
What it shows: It is formed by two converging, ascending trendlines. Both the highs and the lows are rising, but the highs are rising at a slower rate than the lows. This causes the wedge to slope upward and contract.
-
Psychology:
-
At a Top (Reversal Signal): This is the most common context. Each new high is achieved with less and less conviction (often on declining volume). While buyers are still able to make higher highs, they are struggling to do so. The increasingly shallow lows show that sellers are becoming more aggressive at lower price points. This creates a bearish divergence between price and buying pressure.
-
In a Downtrend (Continuation Signal - Bear Flag variant): This represents a weak counter-trend rally within a larger downtrend. The upward slope is seen as a relief bounce or short covering, but the converging nature shows that the bounce is weak and that sellers are ready to reassert control.
-
-
Why it's useful: It frames an upward move not as strengthening bullish momentum, but as a loss of momentum and a potential "distribution" phase where smart money is selling into strength. This prevents you from mistaking a weakening rally for renewed bullish strength.
2. It Provides a Clear, High-Probability Entry Signal for Shorts
The entire purpose of identifying the wedge is to prepare for the potential breakdown.
-
The pattern is confirmed when the price breaks below the lower, slower-rising trendline of the wedge. This is the signal that the support structure has failed and sellers have taken full control.
-
Why it's useful: It offers a precise, objective entry point for a short trade. You are not guessing the top; you are selling the confirmed break of structure and momentum. The tighter the coil, the more powerful the eventual breakdown tends to be.
3. It Offers a Measured Price Target
This is a critical feature for profit-taking and risk management. The Rising Wedge provides a quantifiable profit-taking objective.
-
How it works: You measure the height of the wedge at its widest point (the initial high to the initial low of the pattern). This same distance is then projected downward from the point of the breakdown.
-
Why it's useful: It allows you to calculate the potential reward before you enter the trade, which is essential for determining if the trade offers a favorable risk-to-reward ratio.
Visual Example:
(Imagine a chart where a stock begins its wedge with a high of $40 and a low of $30—a $10 range. The wedge converges over time. The price finally breaks below the lower trendline at $33. The $10 height is projected downward from $33, giving a minimum target of $23.)
4. It Enables Excellent Risk Management
The pattern’s well-defined structure provides a logical level for a stop-loss order.
-
How it works: The most logical place for a stop-loss for a short entry is just above the upper, steeper trendline of the wedge. Since the pattern is bearish, a move back inside the wedge (and especially a break above it) invalidates the setup.
-
Why it's useful: This allows for a clear calculation of risk. The converging nature of the wedge often allows for a tighter stop-loss relative to the projected target, creating the potential for excellent risk-to-reward ratios.
Practical Trading Example (Reversal Context)
-
Identify the Pattern:
-
Stock XYZ has been in an uptrend. It begins to make higher highs and higher lows, but the rallies are becoming weaker and the range is narrowing, forming a clear Rising Wedge. Volume often declines during the formation.
-
-
Entry & Risk Management:
-
Entry Signal: The price breaks below the lower trendline of the wedge at $50 on a surge in volume. You enter a short position at $49.50.
-
Stop-Loss: You place your stop-loss order at $52.10, just above the upper wedge trendline. Your total risk per share is $2.60.
-
-
Profit Target:
-
Measuring the Pattern: The initial height of the wedge is $15 (e.g., from $60 to $45).
-
Setting the Target: You project this $15 downward from the breakdown point at $50. Your price target is $35.
-
Your potential profit per share is $14.50 ($49.50 - $35).
-
-
Reward-to-Risk Analysis:
-
Potential Reward: $14.50
-
Potential Risk: $2.60
-
This is a 5.6:1 reward-to-risk ratio. This is an exceptional setup that justifies the trade.
-
Rising Wedge vs. Other Patterns
-
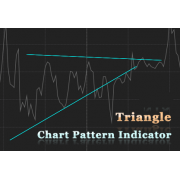
vs. Ascending Triangle: An Ascending Triangle has a flat resistance level and ascending lows. It is typically a bullish continuation pattern. A Rising Wedge has both ascending highs and ascending lows (that converge) and is a bearish pattern. Confusing these two is a common but costly mistake.
-
vs. Bull Flag: Bull Flags are small, downward-sloping parallelograms that form on low volume and are bullish continuation patterns. A Rising Wedge slopes upward and has bearish implications.
Crucial Limitations and Tips for Use
-
Volume is Key: The pattern's reliability is heavily dependent on volume confirmation.
-
During the Wedge: Volume should noticeably contract, signaling a lack of new buying interest.
-
On the Breakdown: Volume must expand significantly. A low-volume breakdown is less trustworthy.
-
-
False Breakouts (Bull Traps): Sometimes the price will make a final fake-out move above the wedge before reversing sharply and breaking down. This is why a confirmed break of the lower trendline is the true signal.
-
Pattern Duration: Rising Wedges can take several weeks to form. The longer the consolidation, the more significant the eventual breakdown tends to be.
-
Context is Everything: As a reversal pattern, it is most potent after a sustained uptrend. As a continuation pattern, it's a powerful bearish signal within a larger downtrend.
Summary: Why the Rising Wedge is Useful
In essence, the Rising Wedge is useful because it provides a complete, high-probability bearish blueprint:
-
Narrative: It reveals the story of waning buying pressure and underlying distribution.
-
Signal: A precise breakdown level for a short entry.
-
Target: A measurable profit objective.
-
Risk Management: A logical stop-loss level.
It acts as a sophisticated early warning system, allowing traders to anticipate potential trend reversals or continuations and position themselves for a downward move with clearly defined risk and high potential reward. It is the ultimate pattern for identifying when a rally is running out of steam.
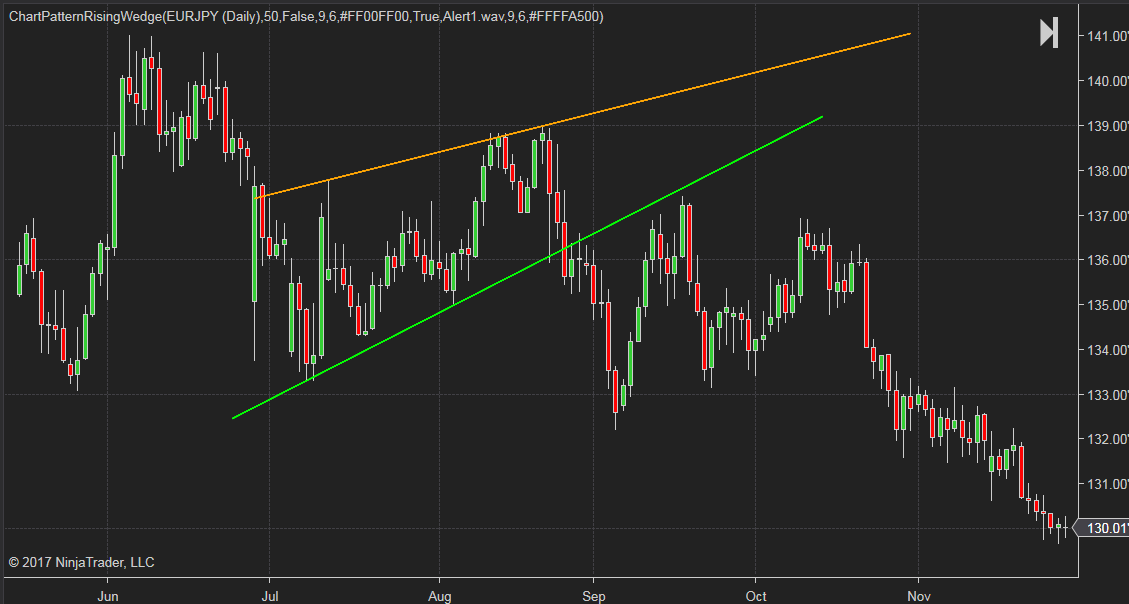
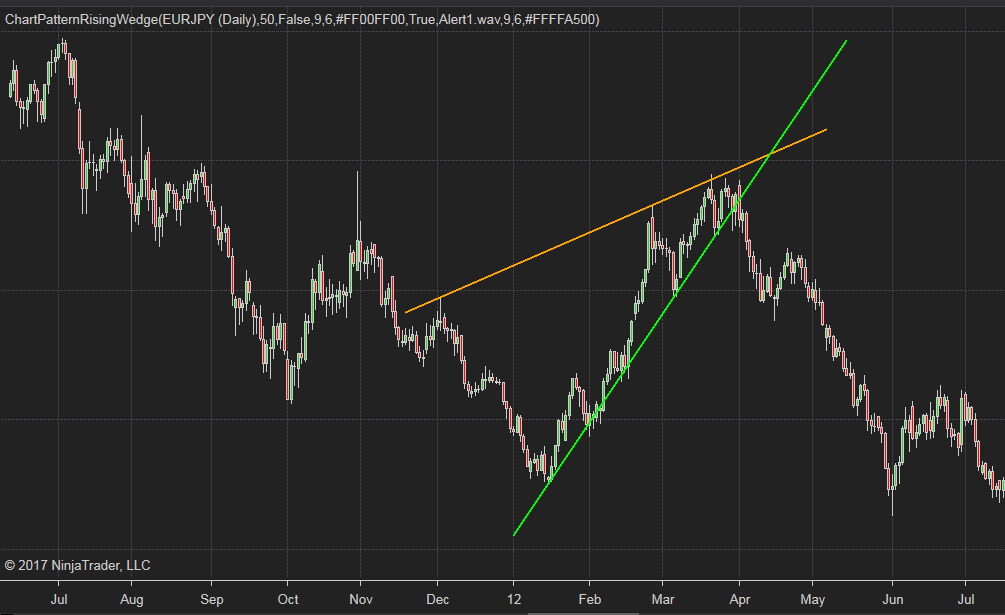
This indicator will automatically detect Rising Wedge chart pattern.It will draw two trend lines of the Rising Wedge on chart when the pattern is formed.
Features:
- Drawing Rising Wedge chart pattern for both real-time and historical data.
- Adjustable length of pattern legs.
- Using different combination of parameters, you can easily identify the Rising Wedge pattern in short term, midterm and long term.
- It works on most of the time frames and chart types, including: minutes, daily, weekly, monthly, tick, renko, range, Heiken Ashi, etc.
- Adjustable length of extension lines.
- Switch for showing the latest pattern only or show all history patterns found on chart.
- Select different sound alert files with switch.
- Editable trend line color.
There is a plot that can be used from other NinjaScript, such as Strategy and Market Analyzer.
They will show up on current bar, no delay, no repaint or back-paint.
In default, the color is transparent, if you need to see the plots on the chart, just change its color to your desired ones.
Click an image to view at full size.
|
|
|


Write a review
Your Name:Your Review: Note: HTML is not translated!
Rating: Bad Good
Enter the code in the box below:


-80x80.png)


Latest


Welcome to Patternsmart
Converting your indicator from one platform to another.Custom Alert, Autotrader, Indicators, Scan, Screener, Strategy and Signals.
Copyright @ 2026 Patternsmart - All rights reserved
This website is for educational and informational
purposes only and should not be considered a solicitation to buy or sell a
futures contract or make any other type of investment decision. It's not recommended to use any single indicator as sole evaluation criteria. The companies
and services listed on this website are not to be considered a recommendation
and it is the reader's responsibility to evaluate any product, service, or
company. patternsmart is not responsible for the accuracy or content of any
product, service or company linked to on this website.
Futures trading
contains substantial risk and is not for every investor.Please read the following risk disclosure before considering the
trading of this product:
Futures Risk Disclosure. An investor could
potentially lose all or more than the initial investment. Risk capital is money
that can be lost without jeopardizing ones financial security or life style.
Only risk capital should be used for trading and only those with sufficient risk
capital should consider trading. Past performance is not necessarily indicative
of future results.
Trading stocks, options, futures and forex involves
speculation, and the risk of loss can be substantial.Investor must consider all
relevant risk factors, including their own personal financial situation, before
trading. Trading foreign exchange on margin carries a high level of risk, as
well as its own unique risk factors. Forex investments are subject to
counter-party risk, as there is no central clearing organization for these
transactions. Please read the following risk disclosure before considering the
trading of this product:
Forex Risk Disclosure. Spreads, Straddles, and other multiple-leg option
strategies can entail substantial transaction costs, including multiple
commissions, which may impact any potential return. Options are not suitable for
all investors as the special risks inherent to options trading may expose
investors to potentially rapid and substantial losses. Prior to trading options,
you should carefully read
Characteristics and Risks of Standardized Options.
patternsmart.com
will not be held liable for the loss of money or any damage caused from relying
on the information on this site. Any investment decision you make in your account is solely your responsibility.
TESTIMONIAL DISCLOSURE: TESTIMONIALS APPEARING ON OUR SITE MAY NOT BE REPRESENTATIVE OF THE EXPERIENCE OF OTHER CLIENTS OR CUSTOMERS AND IS NOT A GUARANTEE OF FUTURE PERFORMANCE OR SUCCESS.