Your shopping cart is empty!
Shopping Cart
0 item(s) - FreeCustomization and Conversion for: Ctrader, MetaTrader(MT4, MT5), Thinkorswim, NinjaTrader, MultiCharts, Tradingview, Prorealtime, SierraChart, etc.
License renew price will be 20% off for the 2nd year and after.
Featured

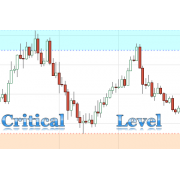

Channel Down Chart Pattern indicator with alert for NinjaTrader 8


") (
(Please note that this purchase is a 1-Year license. About License renew.
The Channel Down pattern (also known as a Falling Channel or Downtrend Channel) is a powerful tool for traders. Its usefulness lies in its ability to provide structure and trading opportunities within a clear, established downtrend.
Unlike patterns that signal a reversal, a Channel Down is typically a continuation pattern. It helps traders navigate a bearish market systematically, whether they are bearish and want to short rallies or bullish and want to find a bottom.
Here’s a detailed breakdown of why it's so valuable.
1. It Provides a Clear Framework for a Downtrend
The pattern visualizes the persistent battle between bulls and bears in a declining market.
-
What it shows: It is formed by two parallel, downward-sloping trendlines.
-
Resistance (Upper Trendline): Connects a series of lower highs. This represents the constant selling pressure at ever-lowering prices.
-
Support (Lower Trendline): Connects a series of lower lows. This represents the temporary levels where buyers step in, but with less and less conviction each time.
-
-
Why it's useful: It instantly clarifies the market's structure. You are no longer looking at random price movements but at a organized trend with defined boundaries. This tells you that sellers are in control, but the descent is happening in a predictable, rhythmic way.
2. It Offers Multiple, High-Probability Trading Strategies
This is the core of its utility. A Channel Down provides specific entry points for both aggressive and conservative traders.
Strategy A: Trading the Bounces (For Bearish Traders - The Primary Use)
This strategy involves shorting the asset when the price rallies up to the channel's upper resistance trendline.
-
Entry: Place a short order near the upper trendline. The best signals occur when the price touches resistance and shows signs of rejecting it (e.g., with a bearish candlestick pattern like a shooting star or bearish engulfing).
-
Why it's useful: This allows you to enter the prevailing downtrend at an optimal point with a very tight stop-loss, offering an excellent risk-to-reward ratio. You are "selling the bounce."
Strategy B: Trading the Breakouts (For Aggressive Traders)
This strategy involves anticipating a break below the channel's support.
-
Entry: Enter a new short position on a confirmed break (a close) below the lower support trendline, especially if accompanied by high volume.
-
Why it's useful: A breakdown signals that the descent is accelerating and that a new, often steeper, leg down is beginning.
Strategy C: Fading the Breakdown (For Contrarian Traders)
This is a counter-trend strategy that involves looking for long positions at the channel's support.
-
Entry: Consider a long trade when the price hits the lower support trendline, especially if momentum oscillators (like the RSI) show bullish divergence (price makes a lower low, but RSI makes a higher low).
-
Why it's useful: It helps identify potential, albeit risky, reversal points for a bounce back to the middle or top of the channel. This is a more advanced strategy.
3. It Provides Clear Targets and Stops for Risk Management
The parallel nature of the channel creates built-in metrics for managing the trade.
-
Profit Target: The most common target is the opposite side of the channel. If you short at the top, your initial target is the bottom of the channel.
-
Stop-Loss: The logical place for a stop-loss for a short entry at the top is just above the upper trendline. A break above the channel resistance invalidates the downtrend structure and suggests a potential trend change.
-
Why it's useful: This allows for precise calculation of risk-to-reward before entering a trade. The distance from entry to target is typically much larger than the distance to the stop-loss, creating favorable ratios.
4. It Can Signal an Impending Trend Reversal
While a continuation pattern, a Channel Down also provides the first clues of a potential bottom.
-
A breakout above the upper resistance trendline is a major event. Especially if it happens on surging volume, it is a strong signal that the downtrend has ended and a new uptrend may be beginning.
-
Why it's useful: It gives bullish traders a clear, objective signal to enter long positions, often marking a significant trend change.
Practical Trading Example (Shorting the Bounce)
-
Identify the Channel: Stock ABC is in a clear Channel Down. The upper trendline connects lower highs at $50, $48, and $46. The lower trendline connects lower lows at $40, $38, and $36.
-
Entry: The price rallies and touches the upper trendline at $44. A bearish engulfing candlestick pattern forms. You enter a short position at $44.
-
Stop-Loss: You place your stop-loss order at $45.20, just above the upper trendline and the recent minor high. Your risk is $1.20 per share.
-
Profit Target: Your initial target is the lower trendline, which is currently near $36. Your potential profit is $8 per share ($44 - $36).
-
Risk-to-Reward Analysis:
-
Potential Reward: $8.00
-
Potential Risk: $1.20
-
This is a 6.6:1 reward-to-risk ratio. This is an exceptional setup.
-
Crucial Limitations and Tips for Use
-
Not a Reversal Pattern: Treat it as a continuation pattern until proven otherwise. The default bias is bearish.
-
False Breakouts: The price may poke above the resistance or below the support briefly before snapping back into the channel. Wait for a confirmed close outside the channel before acting.
-
Volume Confirmation: Volume should ideally diminish as the price moves up toward resistance and increase as it falls toward support. A breakout from the pattern requires high volume to be trusted.
-
Subjectivity: Drawing the perfect parallel channel can be subjective. Use the most obvious touch points to draw the cleanest lines.
Summary: Why the Channel Down is Useful
In essence, the Channel Down is useful because it:
-
Defines the Trend: It provides a clear visual structure for a downtrend.
-
Offers Strategy Choices: It allows traders to short rallies, play breakdowns, or even look for contrarian bounces.
-
Manages Risk: It provides logical levels for stop-loss and profit-target orders.
-
Signals Reversals: Its breakout to the upside provides a clear signal that the downtrend may be over.
It is the ultimate tool for bringing order and tactical planning to a declining market, allowing traders to trade with the trend in a disciplined and calculated way.
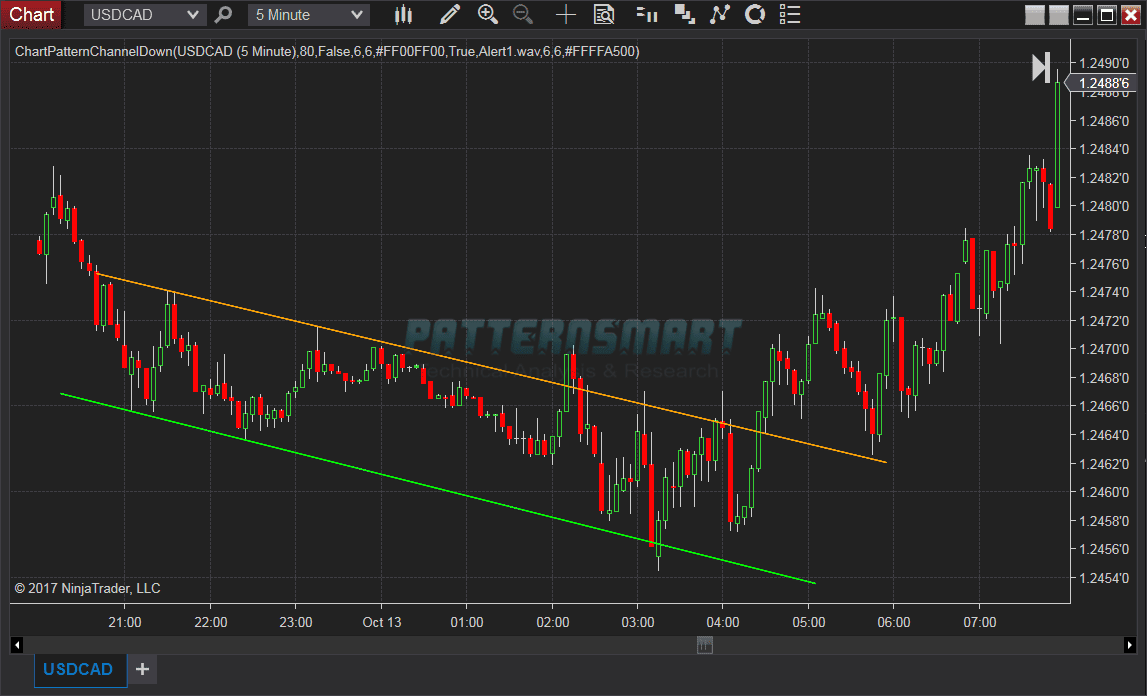
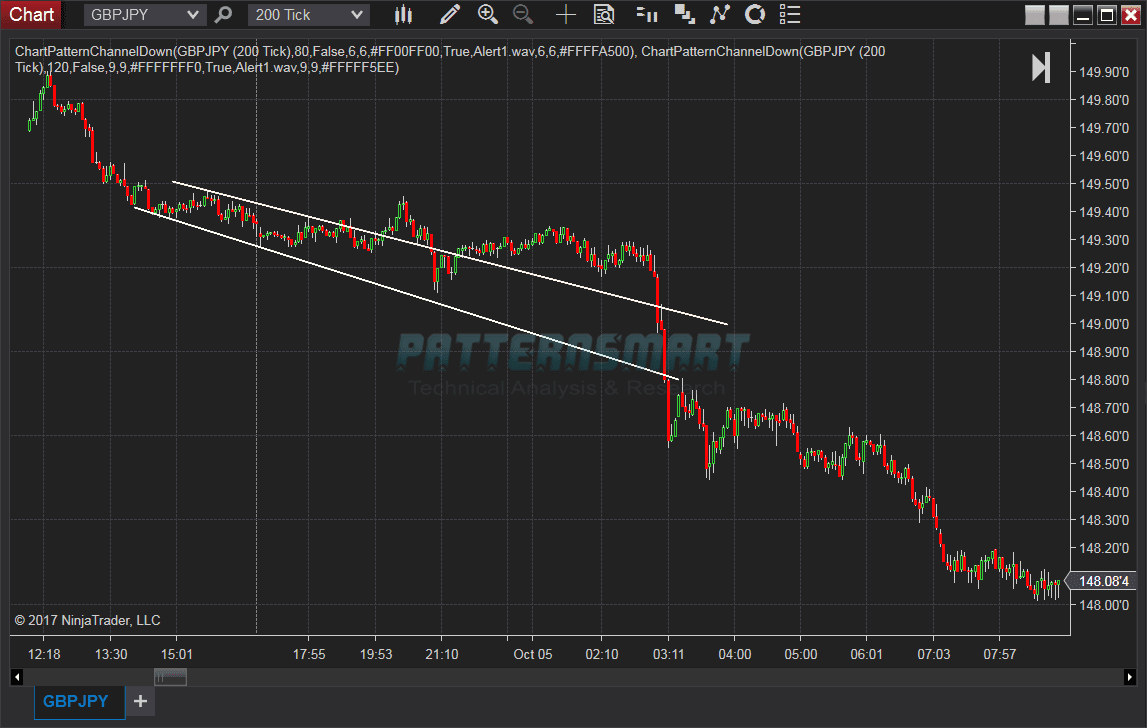
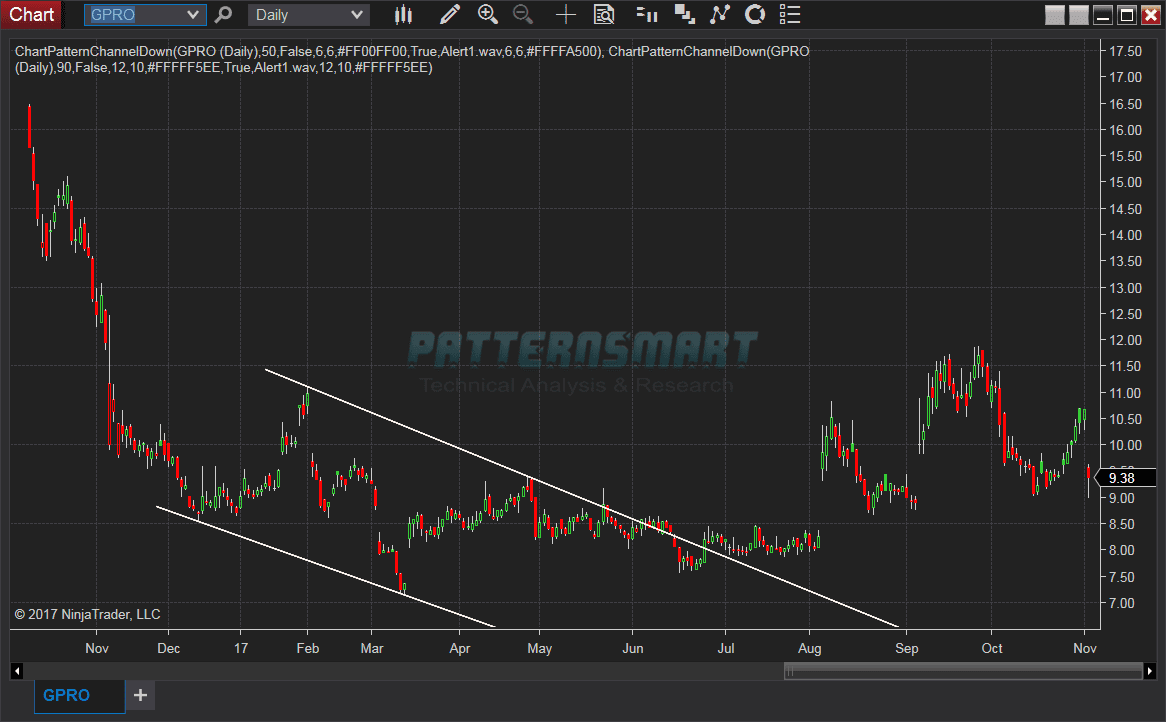
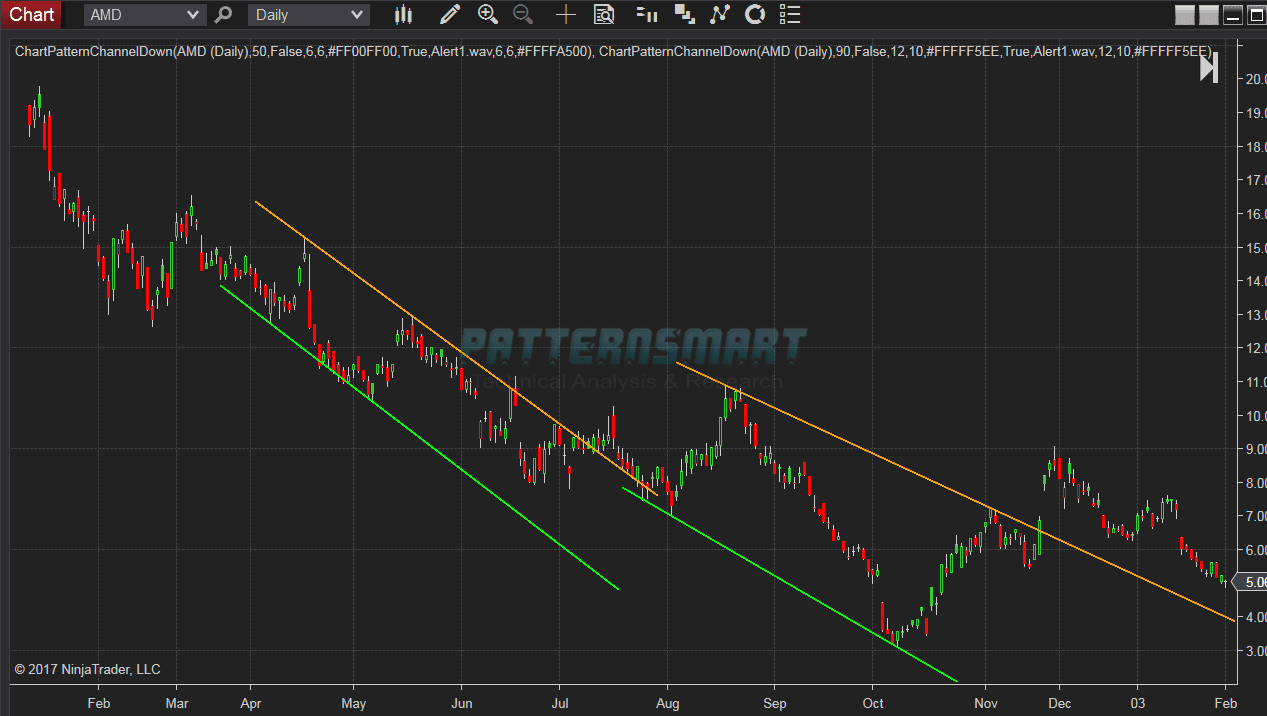
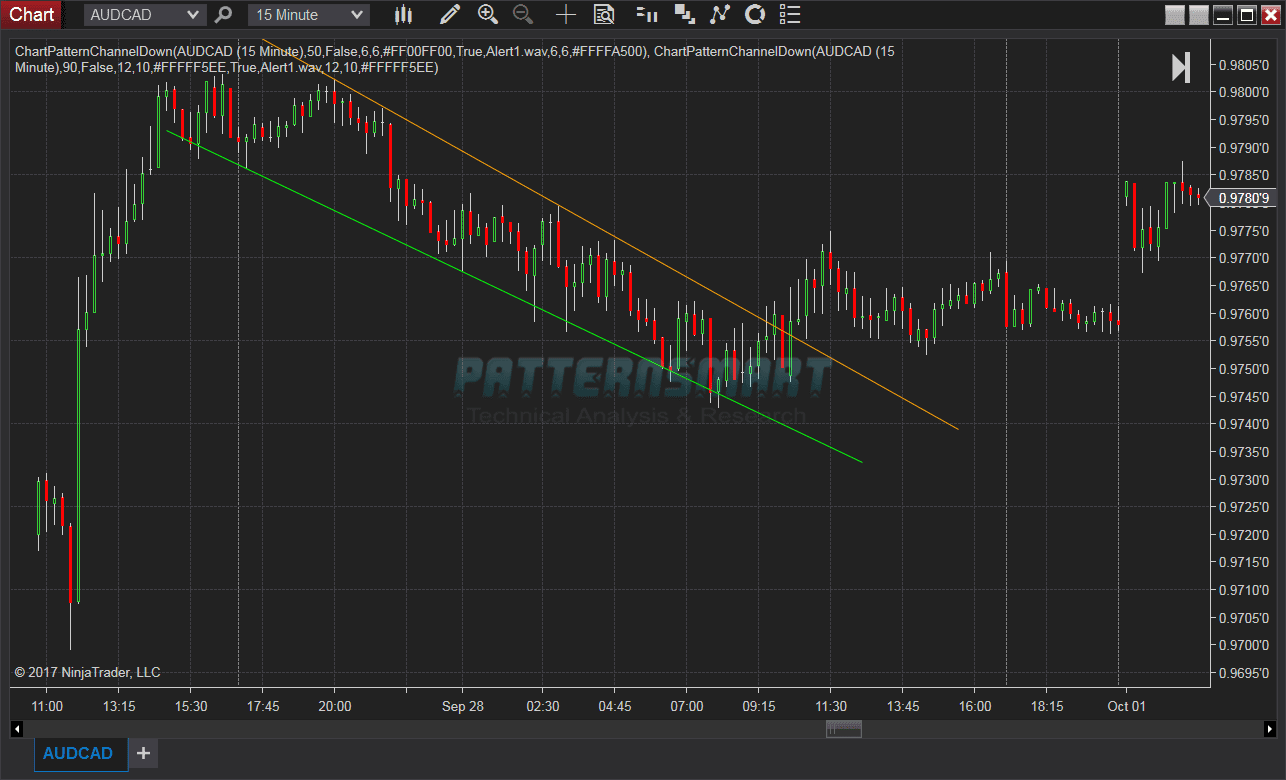
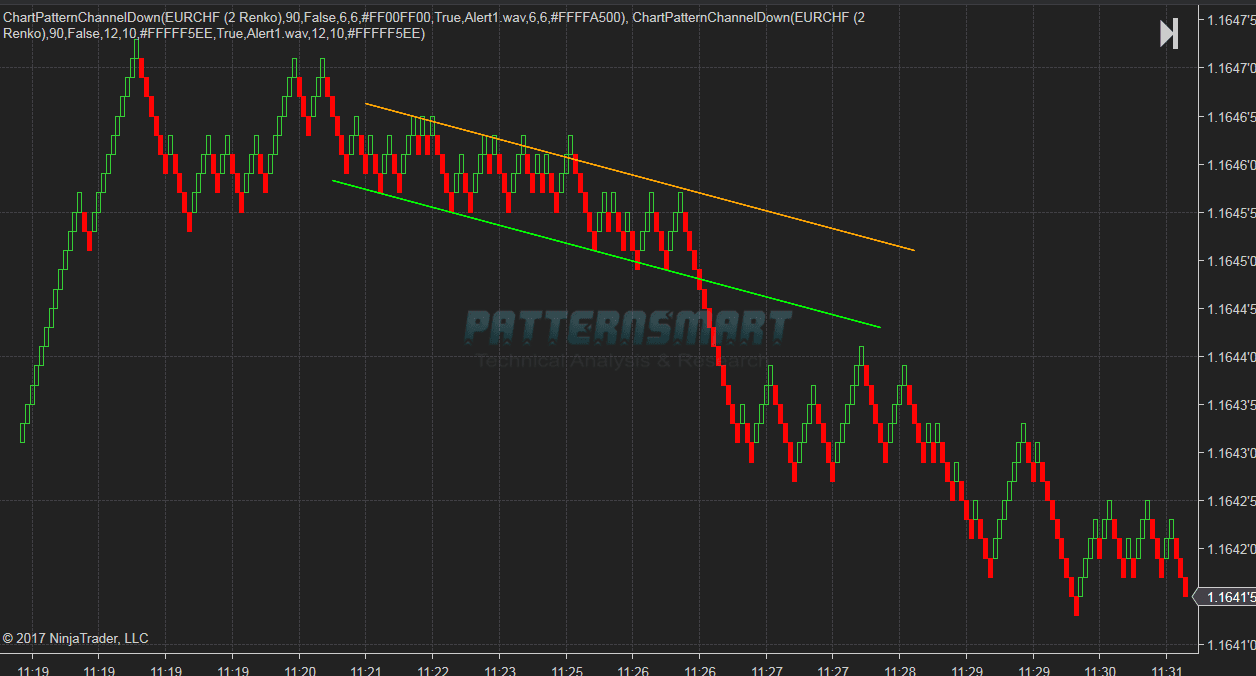
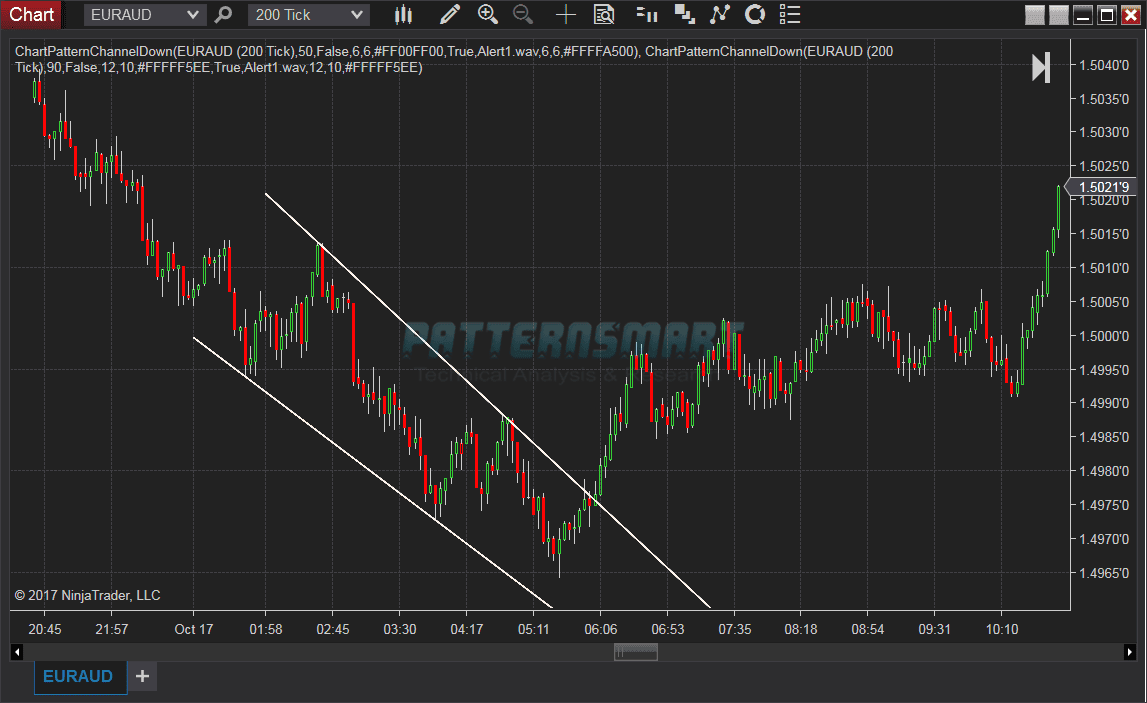
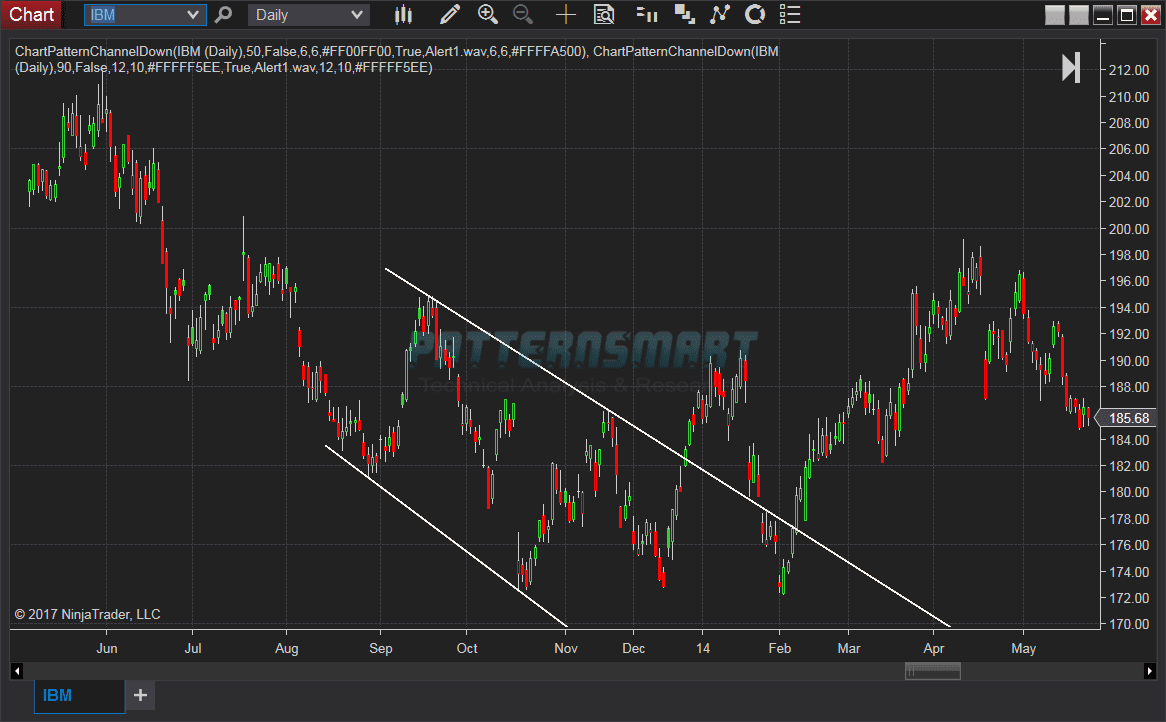
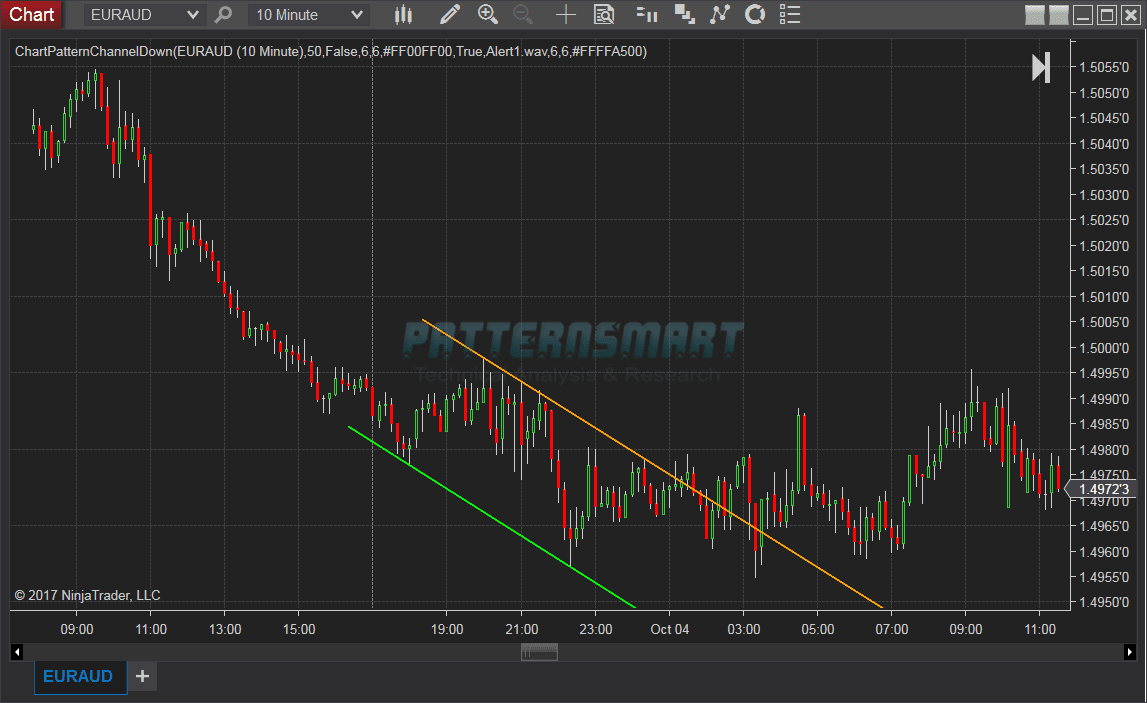
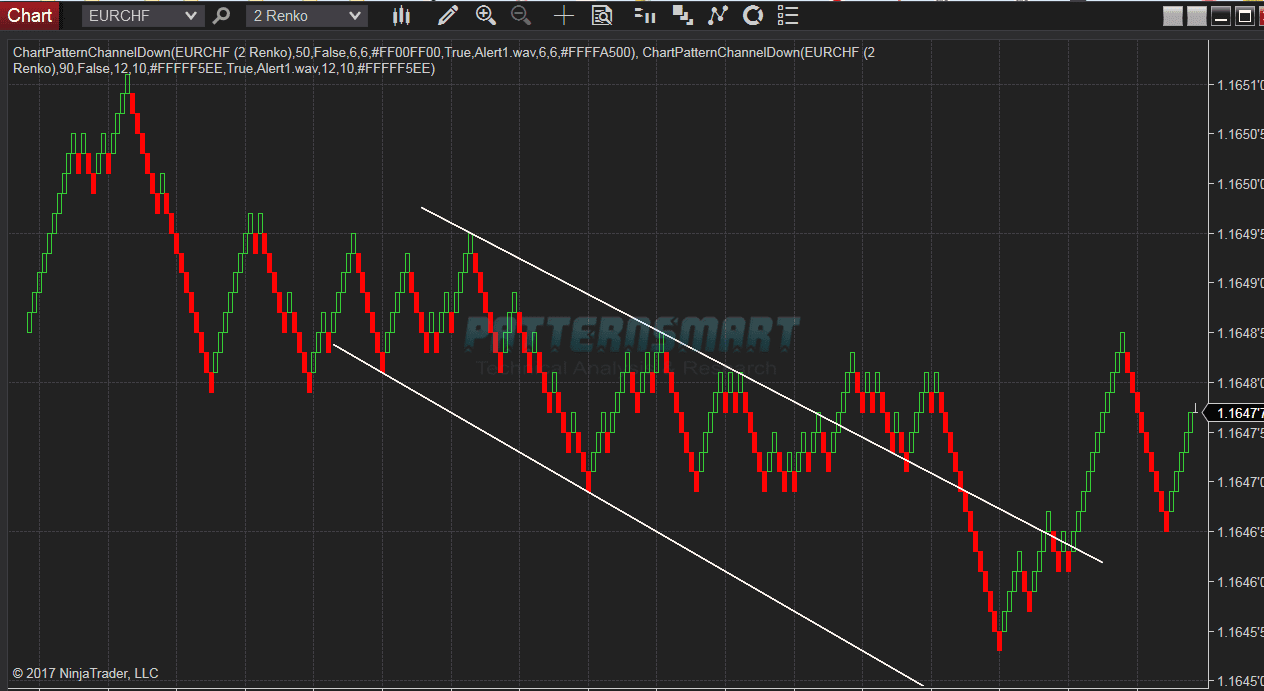
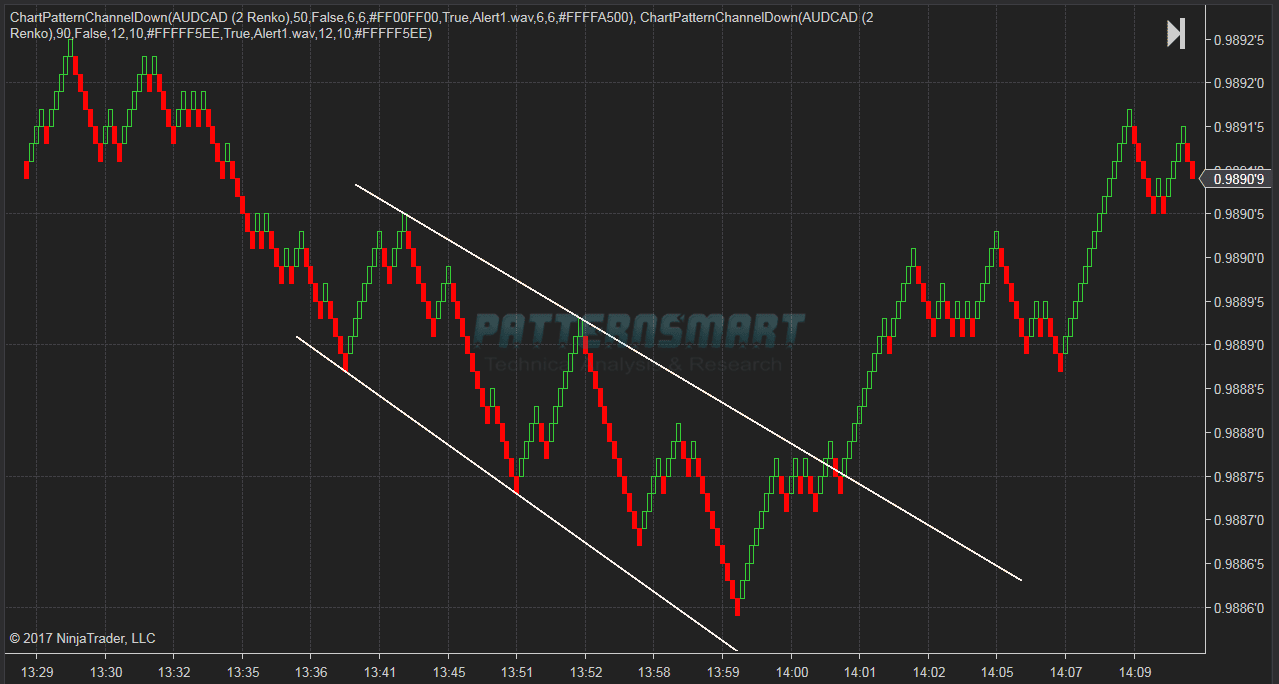
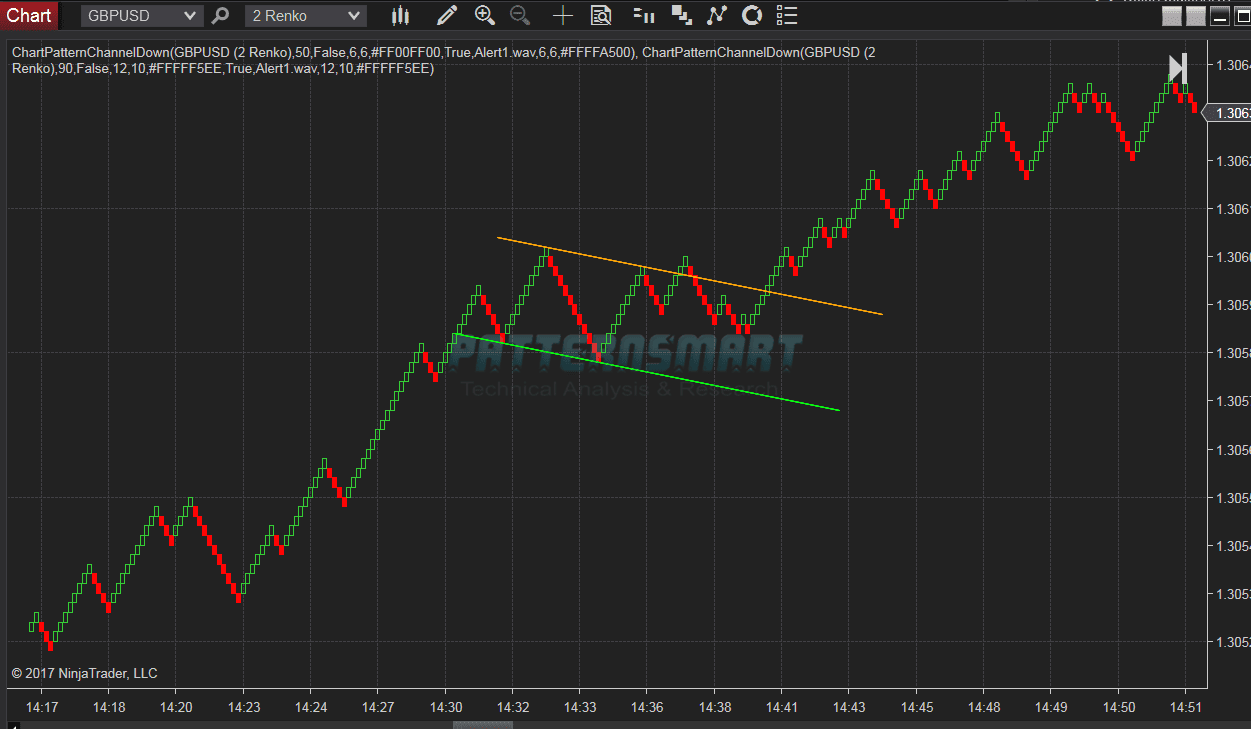
This indicator will automatically detect Channel Down chart pattern.
It will draw two trend lines of the Channel Down on the chart when the pattern is formed.
Features:
- Drawing Channel Down chart pattern for both real-time and historical data.
- Adjustable length of pattern legs.
- Using different combination of parameters, you can easily identify the Channel Down pattern in short term, midterm and long term.
- It works on most of the time frames and chart types, including: minutes, daily, weekly, monthly, tick, renko, range, Heiken Ashi, etc.
- Adjustable length of extension lines.
- Switch for showing the latest pattern only or show all history patterns found on chart.
- Select different sound alert files with switch.
- Editable trend line color.
There is a plot that can be used from other NinjaScript, such as Strategy and Market Analyzer.
They will show up on current bar, no delay, no repaint or back-paint.
In default, the color is transparent, if you need to see the plots on the chart, just change its color to your desired ones.


Click an image to view at full size.
|
|
|

Write a review
Your Name:Your Review: Note: HTML is not translated!
Rating: Bad Good
Enter the code in the box below:


Latest


Welcome to Patternsmart
Converting your indicator from one platform to another.Custom Alert, Autotrader, Indicators, Scan, Screener, Strategy and Signals.
Copyright @ 2026 Patternsmart - All rights reserved
This website is for educational and informational
purposes only and should not be considered a solicitation to buy or sell a
futures contract or make any other type of investment decision. It's not recommended to use any single indicator as sole evaluation criteria. The companies
and services listed on this website are not to be considered a recommendation
and it is the reader's responsibility to evaluate any product, service, or
company. patternsmart is not responsible for the accuracy or content of any
product, service or company linked to on this website.
Futures trading
contains substantial risk and is not for every investor.Please read the following risk disclosure before considering the
trading of this product:
Futures Risk Disclosure. An investor could
potentially lose all or more than the initial investment. Risk capital is money
that can be lost without jeopardizing ones financial security or life style.
Only risk capital should be used for trading and only those with sufficient risk
capital should consider trading. Past performance is not necessarily indicative
of future results.
Trading stocks, options, futures and forex involves
speculation, and the risk of loss can be substantial.Investor must consider all
relevant risk factors, including their own personal financial situation, before
trading. Trading foreign exchange on margin carries a high level of risk, as
well as its own unique risk factors. Forex investments are subject to
counter-party risk, as there is no central clearing organization for these
transactions. Please read the following risk disclosure before considering the
trading of this product:
Forex Risk Disclosure. Spreads, Straddles, and other multiple-leg option
strategies can entail substantial transaction costs, including multiple
commissions, which may impact any potential return. Options are not suitable for
all investors as the special risks inherent to options trading may expose
investors to potentially rapid and substantial losses. Prior to trading options,
you should carefully read
Characteristics and Risks of Standardized Options.
patternsmart.com
will not be held liable for the loss of money or any damage caused from relying
on the information on this site. Any investment decision you make in your account is solely your responsibility.
TESTIMONIAL DISCLOSURE: TESTIMONIALS APPEARING ON OUR SITE MAY NOT BE REPRESENTATIVE OF THE EXPERIENCE OF OTHER CLIENTS OR CUSTOMERS AND IS NOT A GUARANTEE OF FUTURE PERFORMANCE OR SUCCESS.