
Your shopping cart is empty!
Shopping Cart
0 item(s) - FreeCustomization and Conversion for: Ctrader, MetaTrader(MT4, MT5), Thinkorswim, NinjaTrader, MultiCharts, Tradingview, Prorealtime, SierraChart, etc.
License renew price will be 20% off for the 2nd year and after.
Every Purchase Comes with a Coupon.
Share Your Experience. Help Other Traders Learn. Get Rewarded.
Share Your Experience. Help Other Traders Learn. Get Rewarded.
Featured




ADX Double Divergence Pro for MultiCharts


 (
(Spot High-Probability Trend Reversals and Continuations with Automated ADX Double Divergence Detection
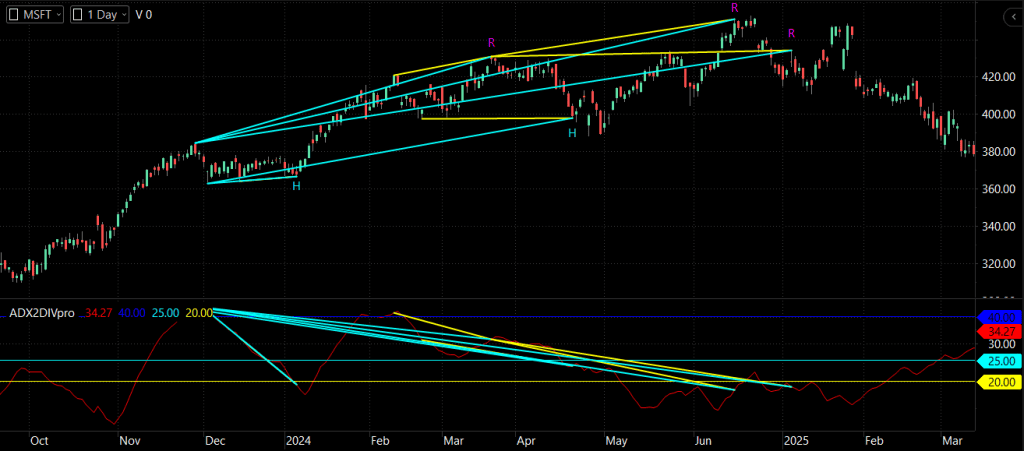
ADX Double Divergence Pro converts complex Average Directional Index (ADX) momentum relationships into clear, actionable, visual divergence signals directly on your MultiCharts platform. Designed for precision-focused traders, it automatically plots swing-to-swing divergence connections, identifies both regular and hidden momentum shifts, and alerts you to potential market inflection points.
Overcome Momentum Trading Challenges
| Common Trading Challenge | How ADX Double Divergence Pro Helps |
|
Subjective Visual Analysis: Manually connecting swing highs/lows with oscillator turns leads to inconsistent signals and missed entries. |
Automated Swing Matching: Algorithmic detection locates precise price swings and matches them to ADX turns to display objective visual divergence lines. |
|
Missing Trend Continuations: Traders often focus solely on reversals, missing powerful hidden divergence setups in the direction of the dominant trend. |
Dual Mode Signal Engine: Detects both Regular (reversal) and Hidden (continuation) bullish/bearish patterns simultaneously or independently. |
|
Indicator Clutter & Signal Lag: Overlapping lines and false signals on open bars create visual noise and early execution mistakes. |
Confirmed Bar Filtering & Signal Limiting: Provides optional bar-close confirmation controls and signal suppression options to declutter historical charts. |
Key Features
Dual Pattern Detection (Regular & Hidden Divergence)
-
What It Does: Scans price action and the ADX line to identify both Regular (potential trend reversal) and Hidden (potential trend continuation) divergences.
-
Why It Matters: Allows traders to adapt to multiple market environments—capturing trend pullbacks using hidden divergence or spotting exhaustion moves via regular divergence.
-
How to Use: Enable or disable specific signal types (Regular Bullish, Hidden Bullish, Regular Bearish, Hidden Bearish) independently within user settings.
Flexible Divergence Range Modes
-
What It Does: Offers selectable search ranges—Short Range, Mid Range, and Long Range—to adjust swing point lookback constraints.
-
Why It Matters: Accommodates fast scalping strategies, standard swing trading, or higher-timeframe position trading without complex manual recalibration.
-
How to Use: Switch between Range Modes to instantly adjust the indicator's swing-length parameters to match your current chart timeframe.
Enhanced Filtering Mode
-
What It Does: Applies an additional structural verification check across detected price swing points before plotting signals.
-
Why It Matters: Filters out weaker, low-quality divergence setups during choppy or low-volatility conditions.
-
How to Use: Toggle
EnhancedModeon to restrict output to high-conviction structural patterns.
Integrated Alert System
-
What It Does: Delivers native MultiCharts platform alerts the moment a valid divergence signal completes on the chart.
-
Why It Matters: Eliminates constant screen monitoring, enabling prompt action when setups form across multiple instrument watchlists.
-
How to Use: Turn
EnableAlertto true to receive real-time audio/visual notifications.
Signal & Repaint Behavior
ADX Double Divergence Pro features customizable execution behavior to suit various trading styles:
-
Confirmed Bar Mode (
Wait1 = true): Signals evaluate upon the closing of the bar and confirm on the open of the next bar, ensuring plotted historical signals remain fixed and do not repaint. -
Real-Time Calculation Mode (
Wait1 = false): Evaluates conditions intra-bar for aggressive real-time monitoring. -
Historical Display Limiter: The
OnlyShowLastSignalWithinBarsparameter allows traders to restrict overlapping line visuals within a specific bar window, maintaining clean chart aesthetics.
Timeframes & Markets
-
Supported Platforms: MultiCharts and MultiCharts x.NET.
-
Compatible Timeframes: Applicable across all standard timeframes, including minute charts, tick charts, daily, and weekly views.
-
Market Versatility: Effective across various asset classes including Futures, Forex, Equities, Crypto, and Commodities. (Note: Parameter adjustments such as period lengths and range modes may be adapted to align with instrument volatility).
What You See on the Chart
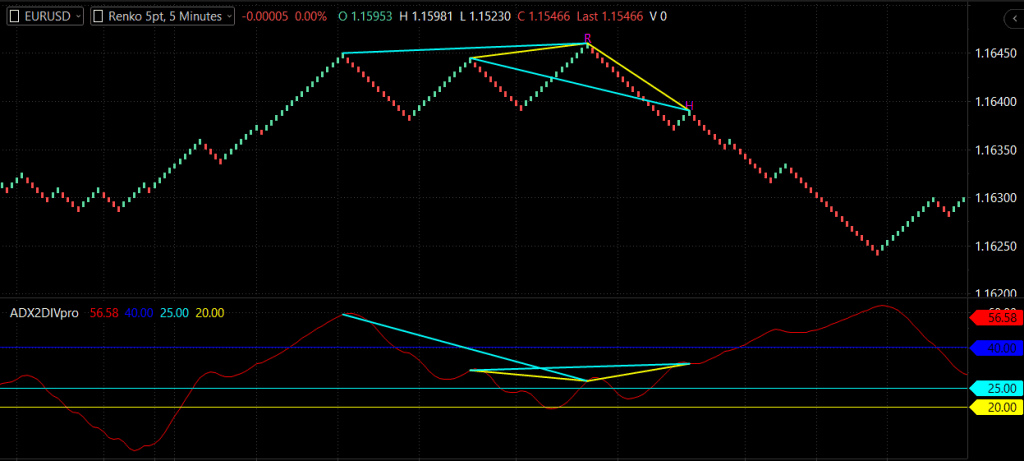
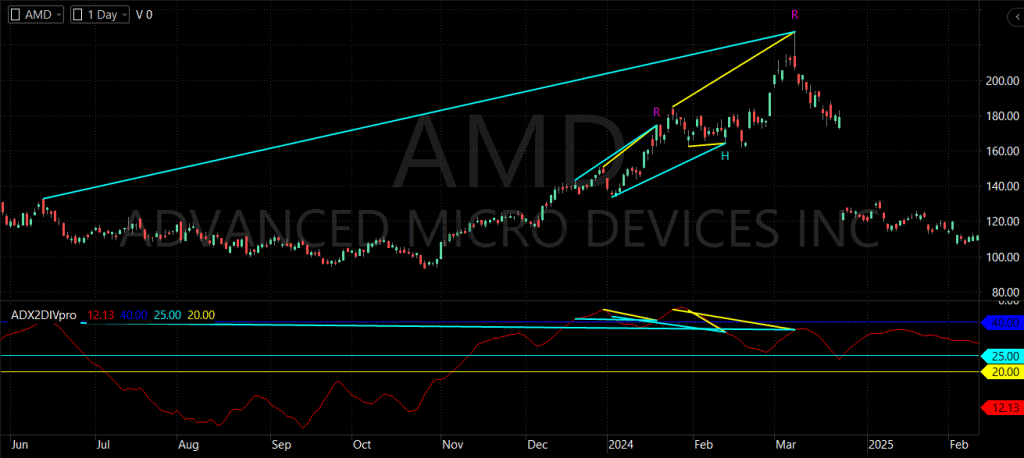
ADX Double Divergence Pro provides a clean, two-panel analytical environment:
+-----------------------------------------------------------------------+
| Price Chart Panel                                                     |
| [ Highs ] ----------- Primary Trendline ----------- [ Highs ]         |
|                       Secondary Trendline                             |
|    R  (Magenta = Bearish Divergence Marker)                           |
|   ---                                                                 |
|    H  (Cyan = Bullish Divergence Marker)                              |
| [ Lows ] ----------- Primary Trendline ----------- [ Lows ]           |
+-----------------------------------------------------------------------+
| ADX Sub-Chart Subpanel                                                |
| [ Upper Overbought Line ] (Default: 40)                               |
| [ Middle Baseline ]       (Default: 25)                               |
| [ Lower Oversold Line ]   (Default: 20)                               |
| ~~~ ADX Oscillator Plot Line ~~~                                      |
| ------- Matched ADX Divergence Visual Lines -------                   |
+-----------------------------------------------------------------------+
-
Main Price Chart: Displays primary and secondary connecting trendlines across swing highs/lows alongside signal character labels (
Rfor Regular,Hfor Hidden) rendered in user-selected colors. -
ADX Subpanel: Renders the smooth ADX plot, custom threshold level lines (Overbought, Middle Line, Oversold), and dynamic matching subpanel divergence lines linking corresponding oscillator swing points.
How It Works
-
Price Swing Identification: The algorithm continuously monitors bar highs and lows across configured lookback spans to establish swing structures.
-
ADX Momentum Correlation: Corresponding ADX oscillator values and moving averages are evaluated at price swing locations.
-
Double Divergence Evaluation: The system evaluates multi-point directional discrepancies between price extremes and ADX momentum levels.
-
Structural Confirmation: When price and momentum conditions satisfy divergence rules (and optional enhanced filters), markers and dynamic trendlines render automatically.
Trade Setups & Practical Application
Bullish Regular Divergence Setup (Potential Reversal)
Price Action:   Low (1) ---------> Lower Low (2)
                                       \
                                        --> [ "R" Signal Plotted ]
ADX Momentum:  ADX Low (1) -------> Higher Low (2)
-
Context: Downtrend showing signs of exhaustion near strong support.
-
Indicator Condition: Price makes a lower low while ADX forms a higher minimum point; a Cyan "R" character appears on bar completion.
-
Confirmation: Wait for a bullish candlestick pattern (e.g., hammer or engulfing bar) above local support.
-
Execution & Risk Management: Consider entry on the next bar open, placing a protective stop below the recent swing low and targeting logical resistance levels.
Bearish Hidden Divergence Setup (Trend Continuation)
Price Action:   High (1) ---------> Lower High (2)
                                        \
                                         --> [ "H" Signal Plotted ]
ADX Momentum:  ADX High (1) -------> Higher High (2)
-
Context: Established overall downtrend experiencing a temporary upward pullback.
-
Indicator Condition: Price forms a lower high while ADX reaches a higher peak; a Magenta "H" character is plotted.
-
Confirmation: Price breaks below pullback support or forms a bearish rejection bar.
-
Execution & Risk Management: Consider a short position entry with a stop loss placed above the lower high swing point.
Confirmation & Market Context
To maximize analytical efficacy, use ADX Double Divergence Pro as part of a comprehensive framework:
$$\text{Signal Identification} \longrightarrow \text{Market Context Check} \longrightarrow \text{Price Action Confirmation} \longrightarrow \text{Risk Management}$$
-
Key Support & Resistance: Prioritize divergence signals occurring near high-timeframe pivot zones, market profile levels, or moving averages.
-
Trend Context: Align Hidden Divergence signals with the higher-timeframe trend for trade entries.
Key Settings & Inputs
-
Wait1(Default: true): Sets bar-close confirmation. When enabled, signals confirm after bar close to prevent repainting. -
ShowRegularBullish/ShowHiddenBullish(Default: true): Toggles visualization of bullish setups. -
ShowRegularBearish/ShowHiddenBearish(Default: true): Toggles visualization of bearish setups. -
EnhancedMode(Default: false): Enables strict swing structure filtering for refined setup selection. -
DivRangeMode(Default: 0): Chooses swing lookback depth:0(Short Range),1(Mid Range), or2(Long Range). -
ADX_Period(Default: 14): Sets the calculation period for the underlying ADX oscillator. -
FilterLength(Default: 5): Adjusts the internal smoothing average length for ADX evaluation. -
EnableAlert(Default: true): Toggles real-time MultiCharts platform audio/visual notifications.
Who Is This Indicator For?
-
Swing Traders: Looking to catch trend pullbacks using hidden divergence cues.
-
Reversal & Counter-Trend Traders: Seeking early technical warnings of momentum depletion at key levels.
-
Systematic Analysts: Requiring objective, rule-based visual divergence plotting without manual line drawing.
Frequently Asked Questions
Does ADX Double Divergence Pro repaint? When the Wait1 parameter is set to true (default), signals evaluate on bar close and confirm on the open of the next bar, maintaining fixed historical signals. If set to false, calculation updates in real-time intra-bar.
Can I use this indicator on all markets in MultiCharts? Yes. The indicator processes standard price open/high/low/close data and ADX momentum, making it compatible with Futures, Forex, Equities, Crypto, and Index markets.
What is the difference between Regular and Hidden divergence? Regular divergence typically indicates potential trend reversals (e.g., price makes a lower low while momentum makes a higher low). Hidden divergence typically points to trend continuation (e.g., price makes a higher low while momentum drops to a lower low).
How does Enhanced Mode work? EnhancedMode applies an additional conditional structural check across prior swing points to filter out weaker divergence patterns, outputting only higher-conviction setups.
Looking for the complete mathematical breakdown, step-by-step optimization guides, and advanced trading strategies? Explore our comprehensive documentation:
Visit the Technical Inputs Manual: Double Divergence Pro for full parameter tuning.
Read the master guide on the Double Divergence Indicator Series.
Write a review
Your Name:Your Review: Note: HTML is not translated!
Rating: Bad Good
Enter the code in the box below:


Latest

Welcome to Patternsmart
Converting your indicator from one platform to another.Custom Alert, Autotrader, Indicators, Scan, Screener, Strategy and Signals.
Copyright @ 2026 Patternsmart - All rights reserved
This website is for educational and informational
purposes only and should not be considered a solicitation to buy or sell a
futures contract or make any other type of investment decision. It's not recommended to use any single indicator as sole evaluation criteria. The companies
and services listed on this website are not to be considered a recommendation
and it is the reader's responsibility to evaluate any product, service, or
company. patternsmart is not responsible for the accuracy or content of any
product, service or company linked to on this website.
Futures trading
contains substantial risk and is not for every investor.Please read the following risk disclosure before considering the
trading of this product:
Futures Risk Disclosure. An investor could
potentially lose all or more than the initial investment. Risk capital is money
that can be lost without jeopardizing ones financial security or life style.
Only risk capital should be used for trading and only those with sufficient risk
capital should consider trading. Past performance is not necessarily indicative
of future results.
Trading stocks, options, futures and forex involves
speculation, and the risk of loss can be substantial.Investor must consider all
relevant risk factors, including their own personal financial situation, before
trading. Trading foreign exchange on margin carries a high level of risk, as
well as its own unique risk factors. Forex investments are subject to
counter-party risk, as there is no central clearing organization for these
transactions. Please read the following risk disclosure before considering the
trading of this product:
Forex Risk Disclosure. Spreads, Straddles, and other multiple-leg option
strategies can entail substantial transaction costs, including multiple
commissions, which may impact any potential return. Options are not suitable for
all investors as the special risks inherent to options trading may expose
investors to potentially rapid and substantial losses. Prior to trading options,
you should carefully read
Characteristics and Risks of Standardized Options.
patternsmart.com
will not be held liable for the loss of money or any damage caused from relying
on the information on this site. Any investment decision you make in your account is solely your responsibility.
TESTIMONIAL DISCLOSURE: TESTIMONIALS APPEARING ON OUR SITE MAY NOT BE REPRESENTATIVE OF THE EXPERIENCE OF OTHER CLIENTS OR CUSTOMERS AND IS NOT A GUARANTEE OF FUTURE PERFORMANCE OR SUCCESS.