
Your shopping cart is empty!
Shopping Cart
0 item(s) - FreeCustomization and Conversion for: Ctrader, MetaTrader(MT4, MT5), Thinkorswim, NinjaTrader, MultiCharts, Tradingview, Prorealtime, SierraChart, etc.
License renew price will be 20% off for the 2nd year and after.
Every Purchase Comes with a Coupon.
Share Your Experience. Help Other Traders Learn. Get Rewarded.
Share Your Experience. Help Other Traders Learn. Get Rewarded.
Featured




RVI Double Divergence Pro for MultiCharts


 (
(The RVI Double Divergence Pro for MultiCharts integrates Donald Dorsey’s Relative Volatility Index (RVI) with PatternSmart’s proprietary multi-layer Double Divergence detection framework.
Purpose-built for high-performance charting, real-time market scanning, and algorithmic workflows in MultiCharts (PowerLanguage), this software module evaluates the fundamental relationship between market volatility and directional price movement.
While standard momentum oscillators (such as RSI or Stochastics) measure speed and magnitude, the Relative Volatility Index evaluates the standard deviation of high and low price dispersion over time. By incorporating volatility measurements into a structured double divergence framework, this tool provides traders with quantitative confirmation regarding trend stability, volatility dynamics, and market consistency.
Primary Analytical Philosophy:Price always leads market structure. Divergence represents analytical information—not automated prediction. By analyzing subtle shifts in underlying volatility relative to price action, traders gain valuable confirmation regarding trend sustainability and potential market transitions.
Understanding RVI Volatility Divergence
The Relative Volatility Index (RVI) Foundation
The Relative Volatility Index evaluates directional price movement adjusted for market volatility. Mathematically, while the RSI calculates price gains and losses directly, RVI measures the standard deviation ($\sigma$) of price changes over a specified lookback window:
$$\text{RVI} = \left( \frac{\text{Upward Volatility}}{\text{Upward Volatility} + \text{Downward Volatility}} \right) \times 100$$
When combined with PatternSmart's Double Divergence methodology, RVI highlights crucial structural conditions where market volatility begins diverging from raw price movement:
Analytical Signal Classifications
-
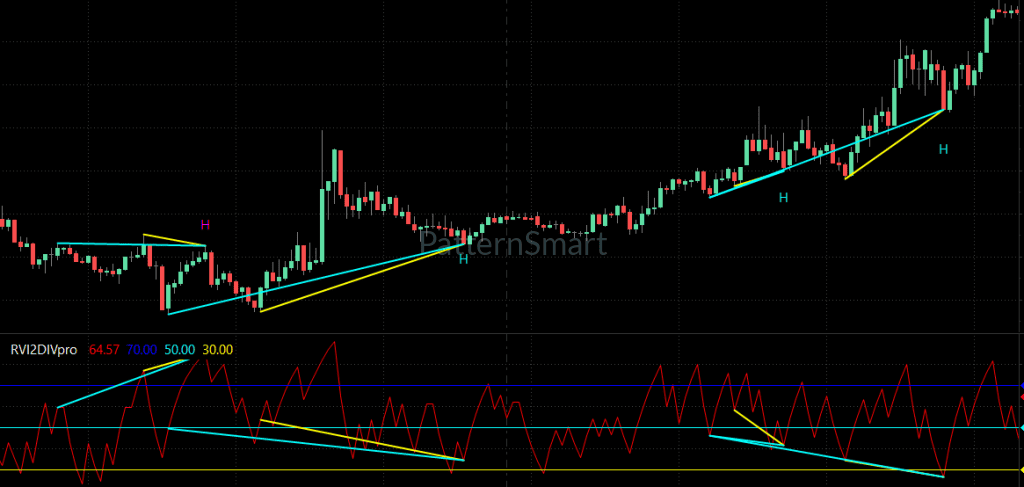
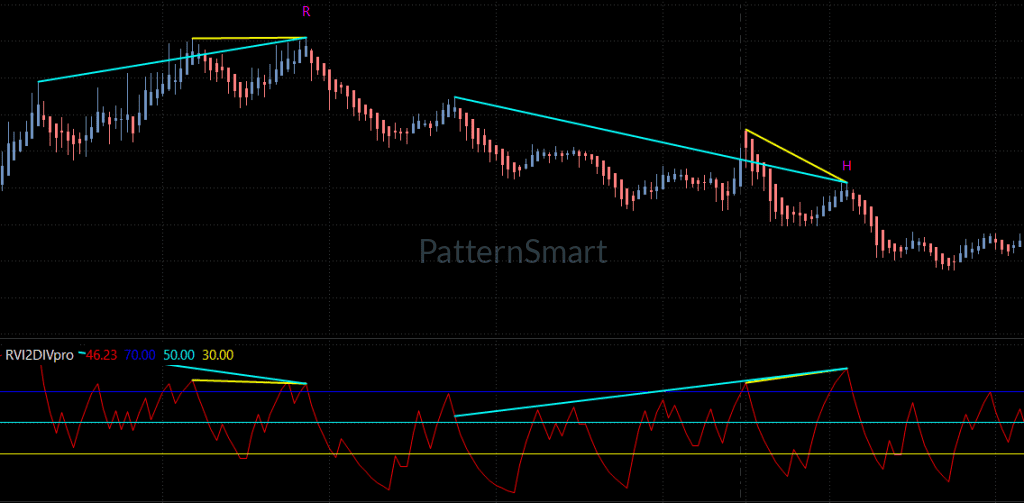
Bullish Regular Divergence:Price establishes a lower low while RVI forms a higher low, indicating that downside volatility is contracting despite lower prices.
-
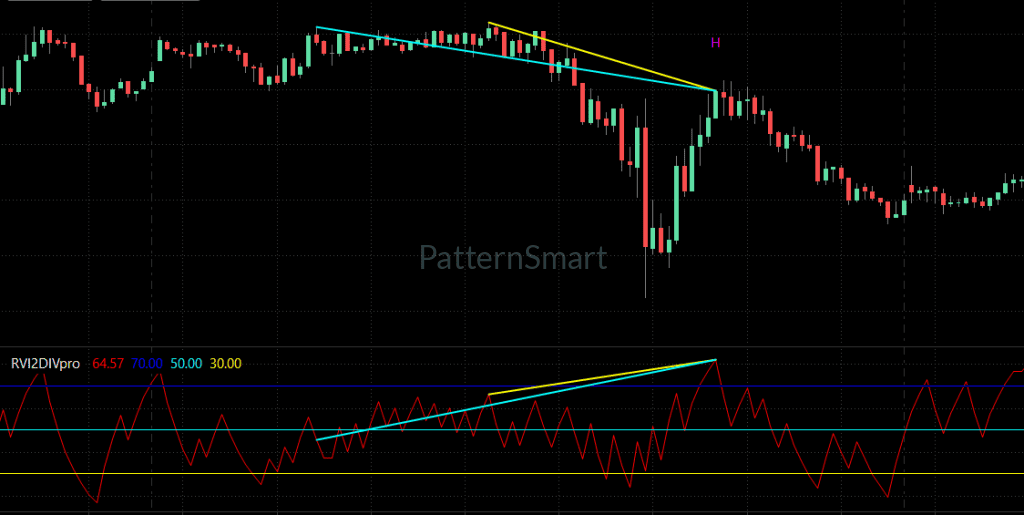
Bearish Regular Divergence:Price establishes a higher high while RVI forms a lower high, suggesting that upside expansion lacks backing volatility and trend stability may be compromising.
-
Bullish Hidden Divergence:Price forms a higher low while RVI drops to a lower low, providing structural evidence that underlying trend strength remains intact following a temporary correction.
-
Bearish Hidden Divergence:Price forms a lower high while RVI reaches a higher high, supporting ongoing bearish structural continuity during temporary retracements.
MultiCharts PowerLanguage Engineering & Input Parameters
Built exclusively using native MultiCharts architectures, RVI Double Divergence Pro provides granular control over indicator sensitivity, visual mapping, and programmatic alert outputs without sacrificing visual execution performance.
| Input Name (Inputs Manual) | Default Setting | Functional Description |
RVI_Period |
14 |
Lookback period for calculating standard deviation and volatility expansion. |
StdDev_Period |
10 |
Baseline smoothing window for price dispersion calculations. |
Pivot_Left / Pivot_Right |
5 / 5 |
Pivot strength required to validate technical swing points for divergence identification. |
Enable_Regular_Divergence |
True |
Toggles automated detection and plotting of Bullish and Bearish Regular Divergence. |
Enable_Hidden_Divergence |
True |
Toggles automated evaluation of Bullish and Bearish Hidden structural continuation signals. |
MultiCharts_Alert_Engine |
Enabled |
Triggers real-time audio, pop-up, or email notifications compatible with MultiCharts Strategy Runner. |
MultiCharts Integration & Usability
MultiCharts is globally recognized for its robust backtesting capabilities, high-frequency tick processing, and flexible EasyLanguage / PowerLanguage programming environment. RVI Double Divergence Pro integrates seamlessly into native MultiCharts workflows:
-
Multi-Timeframe Workspace Synchronization: Effortlessly run RVI Double Divergence Pro across intraday tick, volume, second, minute, or daily bar structures simultaneously.
-
High-Speed Calculation Engine: Optimized for rapid recalculation during high-volatility market sessions without chart lag or indicator freezing.
-
Market Scanner Compatibility: Fully supports the MultiCharts Scanner window, allowing traders to monitor dozens of symbol lists for real-time volatility divergence events.
-
Customizable Plotting Options: Complete control over plot lines, colored divergence trend lines, breakout markers, and visual background fills.
Market Applications & Multi-Asset Suitability
While volatility studies are beneficial across all financial instruments, RVI Double Divergence analysis provides distinct analytical advantages in specific market environments:
-
Futures Trading (E-mini S&P 500, Nasdaq, Crude Oil):Intraday futures markets frequently exhibit rapid volatility surges. RVI Double Divergence Pro helps traders distinguish between genuine institutional breakout moves and exhausted price probes that lack volatility support.
-
Foreign Exchange (Forex Pairs):Continuous 24-hour liquidity makes currency markets ideal for volatility evaluations. Divergence in RVI highlights changing directional conviction across global trading sessions.
-
Equities & ETFs:Supports swing trading strategies by confirming structural health during multi-day market pullbacks and market index rotations.
Frequently Asked Questions
Q: How does RVI Double Divergence differ from traditional RSI divergence?
A: RSI measures price velocity and momentum magnitude. RVI measures the standard deviation of directional price movement (volatility). RVI divergence identifies whether changes in market volatility support ongoing price trends, offering a unique volatility perspective compared to standard momentum indicators.
Q: Is RVI Double Divergence Pro fully compatible with MultiCharts .NET?
A: This specific product edition is tailored for standard MultiCharts (PowerLanguage). A dedicated MultiCharts .NET edition built natively in C# is available separately in the PatternSmart catalog.
Q: Does the indicator generate automated trading signals or strategy orders?
A: No. PatternSmart products are specialized technical indicators designed for confirmation and analytical clarity. They provide visual plots and alert triggers to support disciplined manual analysis or strategy development within MultiCharts.
Q: Does this indicator repaint past signals on the chart?
A: No. Divergence points are confirmed strictly after the user-defined pivot bars (e.g., Pivot Right) are completed. Once a divergence signal is plotted on a closed bar, it remains fixed forever.
Looking for the complete mathematical breakdown, step-by-step optimization guides, and advanced trading strategies? Explore our comprehensive documentation:
Visit the Technical Inputs Manual: Double Divergence Pro for full parameter tuning.
Read the master guide on the Double Divergence Indicator Series.
Write a review
Your Name:Your Review: Note: HTML is not translated!
Rating: Bad Good
Enter the code in the box below:


Latest

Welcome to Patternsmart
Converting your indicator from one platform to another.Custom Alert, Autotrader, Indicators, Scan, Screener, Strategy and Signals.
Copyright @ 2026 Patternsmart - All rights reserved
This website is for educational and informational
purposes only and should not be considered a solicitation to buy or sell a
futures contract or make any other type of investment decision. It's not recommended to use any single indicator as sole evaluation criteria. The companies
and services listed on this website are not to be considered a recommendation
and it is the reader's responsibility to evaluate any product, service, or
company. patternsmart is not responsible for the accuracy or content of any
product, service or company linked to on this website.
Futures trading
contains substantial risk and is not for every investor.Please read the following risk disclosure before considering the
trading of this product:
Futures Risk Disclosure. An investor could
potentially lose all or more than the initial investment. Risk capital is money
that can be lost without jeopardizing ones financial security or life style.
Only risk capital should be used for trading and only those with sufficient risk
capital should consider trading. Past performance is not necessarily indicative
of future results.
Trading stocks, options, futures and forex involves
speculation, and the risk of loss can be substantial.Investor must consider all
relevant risk factors, including their own personal financial situation, before
trading. Trading foreign exchange on margin carries a high level of risk, as
well as its own unique risk factors. Forex investments are subject to
counter-party risk, as there is no central clearing organization for these
transactions. Please read the following risk disclosure before considering the
trading of this product:
Forex Risk Disclosure. Spreads, Straddles, and other multiple-leg option
strategies can entail substantial transaction costs, including multiple
commissions, which may impact any potential return. Options are not suitable for
all investors as the special risks inherent to options trading may expose
investors to potentially rapid and substantial losses. Prior to trading options,
you should carefully read
Characteristics and Risks of Standardized Options.
patternsmart.com
will not be held liable for the loss of money or any damage caused from relying
on the information on this site. Any investment decision you make in your account is solely your responsibility.
TESTIMONIAL DISCLOSURE: TESTIMONIALS APPEARING ON OUR SITE MAY NOT BE REPRESENTATIVE OF THE EXPERIENCE OF OTHER CLIENTS OR CUSTOMERS AND IS NOT A GUARANTEE OF FUTURE PERFORMANCE OR SUCCESS.