
Your shopping cart is empty!
Shopping Cart
0 item(s) - FreeCustomization and Conversion for: Ctrader, MetaTrader(MT4, MT5), Thinkorswim, NinjaTrader, MultiCharts, Tradingview, Prorealtime, SierraChart, etc.
License renew price will be 20% off for the 2nd year and after.
Every Purchase Comes with a Coupon.
Share Your Experience. Help Other Traders Learn. Get Rewarded.
Share Your Experience. Help Other Traders Learn. Get Rewarded.
Featured






ADX Double Divergence Pro for Sierra Chart


 (
(Introduction: The Technical Challenge of Trend Evaluation
Evaluating the health, sustainability, and underlying conviction of an active trend represents one of the most fundamental challenges in technical analysis. While identifying price direction is relatively straightforward—higher highs and higher lows define an uptrend, whereas lower lows and lower highs define a downtrend—determining the quality and strength driving that directional movement requires a deeper analytical perspective.
Markets frequently exhibit price advances or declines that appear robust on the surface but lack genuine structural power underneath. Conversely, strong, healthy trends often undergo sharp counter-trend pullbacks that falsely suggest an impending trend collapse to undisciplined observers. Traders who rely strictly on visual price action or simple directional indicators often struggle to distinguish between a healthy pullback within an ongoing trend and a fundamental breakdown in trend quality.
This technical dilemma highlights the necessity of evaluating trend strength independently of price direction. Price reflects where the market has traveled; trend strength measures the conviction driving the move. When price action and trend strength begin communicating conflicting messages, market conditions deserve rigorous technical re-evaluation.
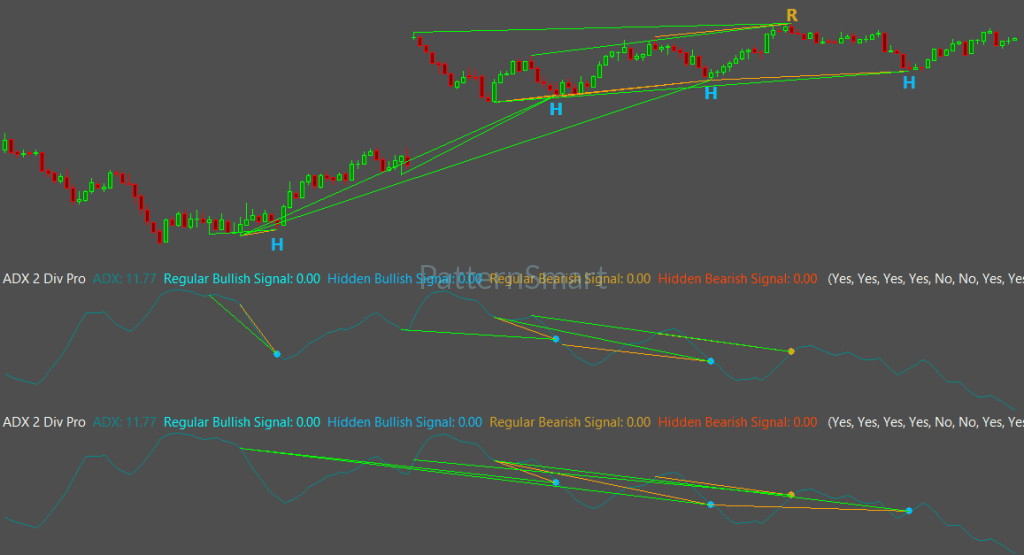
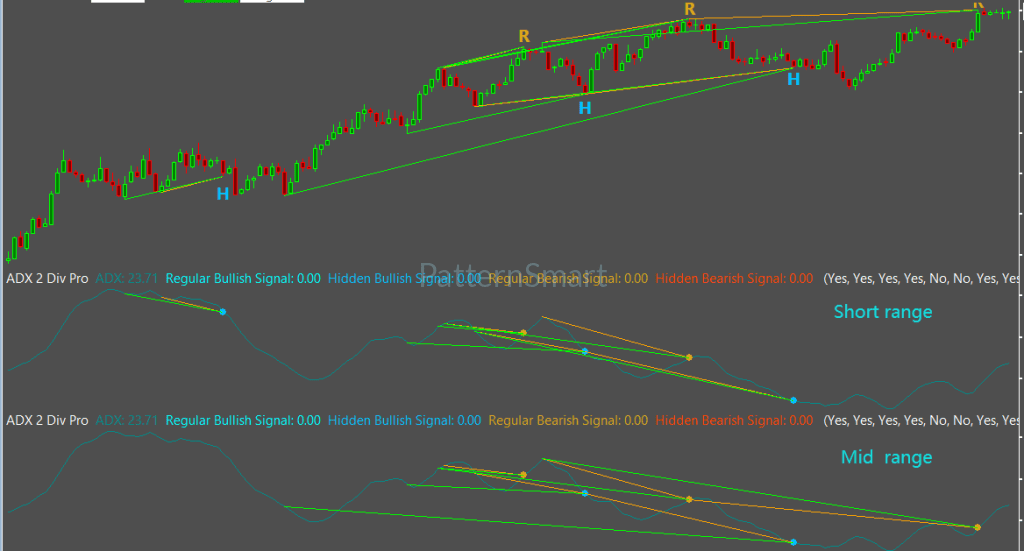
The ADX Double Divergence Indicator for Sierra Chart was engineered specifically to solve this analytical problem. By integrating the classical Average Directional Index (ADX) with PatternSmart’s proprietary Double Divergence methodology, this tool provides professional futures and active traders with a structured, quantitative framework for evaluating trend quality, identifying trend exhaustion, and confirming high-probability continuation opportunities directly within Sierra Chart’s high-performance environment.
Understanding Trend Quality and the Mechanics of ADX
To evaluate divergence effectively using ADX, an analyst must first understand what the Average Directional Index measures—and, equally importantly, what it does not measure.
Developed by J. Welles Wilder Jr., the ADX is a non-directional indicator designed to quantify the velocity and strength of a trend regardless of whether price is moving up or down. Unlike momentum oscillators like the Relative Strength Index (RSI) or Stochastics, which measure speed and relative range positioning between 0 and 100, ADX evaluates directional movement expansion over a specified lookback period.
Key Analytical Characteristics of ADX
-
Non-Directional Value: Rising ADX values indicate an accelerating, strengthening trend whether price is making aggressive new highs or aggressive new lows. Falling ADX values reflect a decelerating trend or a period of consolidation.
-
Trend Quality Assessment: An advancing price trend accompanied by a rising ADX value confirms that directional conviction is expanding. Conversely, an advancing price trend accompanied by a declining ADX value indicates that while price continues to push forward, the structural strength behind the trend is deteriorating.
-
Absence of Extremes: Unlike momentum oscillators, ADX does not fluctuate between "overbought" and "oversold" boundaries. High ADX readings reflect extreme trend strength, not an imminent requirement for price to reverse.
When analysts attempt to interpret ADX independently, evaluating subtle shifts in trend strength against complex price structures can become subjective. The Double Divergence methodology addresses this limitation by automating the structural comparison between price swing points and ADX value peaks.
The Double Divergence Methodology
The PatternSmart Double Divergence methodology is built upon a confirmation-first analytical philosophy: technical indicators provide supplementary evidence to evaluate price action rather than predictive guarantees. Divergence represents an information shift—a disagreement between price movement and underlying market characteristics—that requires objective interpretation within broader market structure.
While traditional single-divergence indicators look for isolated disagreements between price and an oscillator, the Double Divergence framework evaluates dual-pivot structural relationships across historical swing points. This confirmation-based approach organizes divergence into two primary analytical categories: Regular Divergence and Hidden Divergence.
Regular Divergence: Identifying Deteriorating Trend Quality
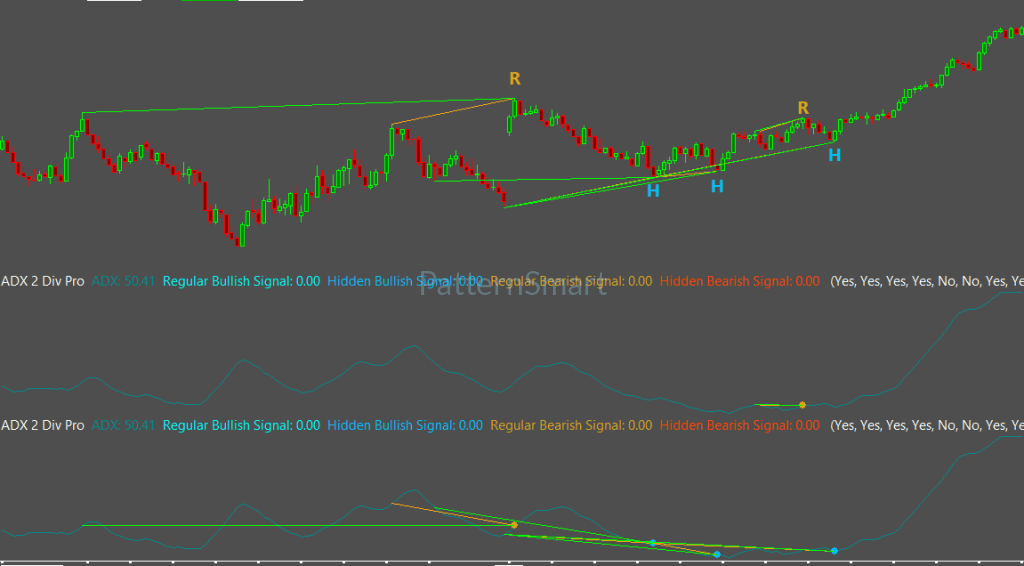
Regular Divergence occurs when price establishes a new extreme high or low, but the underlying indicator fails to confirm that extreme with a corresponding new high or low.
-
Bearish Regular Divergence: Price forms a Higher High (HH) while ADX forms a Lower High (LH).
-
Analytical Interpretation: Price is advancing to new territory, but trend strength is demonstrably weaker than during the previous price push. This structural disagreement indicates declining trend quality and warns that the prevailing uptrend may be losing directional conviction.
-
-
Bullish Regular Divergence: Price forms a Lower Low (LL) while ADX forms a Lower High (LH).
-
Analytical Interpretation: Price is reaching new lows, but directional selling strength is lower than on the prior decline. The downtrend is losing structural velocity, signaling potential trend exhaustion or an impending transition into consolidation.
-
Hidden Divergence: Confirming Trend Continuation
Hidden Divergence evaluates structural pullbacks within an established macro trend, providing analytical evidence that underlying trend strength remains intact despite temporary counter-trend price movement.
-
Bullish Hidden Divergence: Price forms a Higher Low (HL) during a pullback, but ADX prints a Lower Low (LL) (or a structural reset).
-
Analytical Interpretation: Price held structural support by forming a higher low, while the indicator cleared its previous reading. This indicates that counter-trend pressure failed to break market structure, supporting a high-probability continuation of the primary uptrend.
-
-
Bearish Hidden Divergence: Price forms a Lower High (LH) during a rally in a downtrend, while ADX resets structurally.
-
Analytical Interpretation: The temporary price recovery failed to produce a new structural high, confirming that bearish trend continuation remains technically favored.
-
By organizing these structural observations into objective categories, Double Divergence transforms raw indicator output into structured, confirmation-based market intelligence.
Native Integration with Sierra Chart
Sierra Chart is widely recognized among professional futures traders, quantitative analysts, and institutional desks for its high-performance execution engine, low-latency processing, and precision charting architecture. Applying advanced technical analysis within Sierra Chart demands tools that maintain the same standard of computational efficiency and structural reliability.
The ADX Double Divergence Indicator for Sierra Chart is built as a native C++ Advanced Custom Study. It leverages Sierra Chart’s native graphics rendering and memory management to deliver real-time, tick-by-tick calculation stability without introducing platform lag or chart freezing during volatile market events.
+-------------------------------------------------------------------------+
| Sierra Chart Workspace - [ES Z26] 5-Min Chart                          |
+-------------------------------------------------------------------------+
| Price Chart                                                             |
|   19825.00 ┤        /\  [Bearish Regular Divergence]                   |
|   19800.00 ┤       /  \===== (Price: Higher High)                       |
|   19775.00 ┤  /\  /    \                                                |
|   19750.00 ┤ /  \/      \                                               |
+-------------------------------------------------------------------------+
| ADX Double Divergence Subgraph                                          |
|   45.00 ┤     /\                                                        |
|   35.00 ┤    /  \   /\  [ADX: Lower High]                               |
|   25.00 ┤---/----\-/--\------------------------------------------------ |
|         |  Peak 1  Peak 2 (Trend Strength Deteriorating)               |
+-------------------------------------------------------------------------+
Sierra Chart Professional Workflow Advantages
-
Precision Tick & Volume Bar Processing: Whether analyzing standard time-based bars (e.g., 5-minute, 15-minute), tick charts, volume bars, or Range/Renko bars, the indicator evaluates price and ADX swing points with exact precision.
-
Sub-Graph Visualization Control: Native integration allows complete customization of line styles, color brushes, label fonts, and sub-graph overlays. Analysts can display divergence lines directly on the price chart, within the ADX sub-graph pane, or concurrently across both.
-
Advanced System Integration: Sierra Chart users can output confirmed Double Divergence signals to custom ACSIL (Advanced Custom Study Interface and Language) automated trading systems or spreadsheets, enabling seamless incorporation into broader quantitative workflows.
Core Feature Set & Input Configuration
The ADX Double Divergence Indicator for Sierra Chart includes a comprehensive suite of configurable inputs designed to refine calculation behavior, apply structural filtering, and customize visual presentation. Every setting documented below operates according to the official product specifications defined in the Double Divergence Pro Inputs Manual.
                            [INDICATOR PROCESSING WORKFLOW]

  ┌──────────────────┐     ┌──────────────────┐     ┌──────────────────┐
  │   Market Data    │ ──> │ Signal Generation│ ──> │Advanced Parameters│
  │ (Tick/Bar Feed)  │     │ (ADX Calculation)│     │(Lookback/Filter) │
  └──────────────────┘     └──────────────────┘     └──────────────────┘
                                                             │
  ┌──────────────────┐     ┌──────────────────┐              ▼
  │ Display & Alerts │ <── │ Confirmed Signal │ <── ┌──────────────────┐
  │(Charts/Audio/Logs│     │   Final Output   │     │ Signal Filtering │
  └──────────────────┘     └──────────────────┘     │ (Enhanced Mode)  │
                                                    └──────────────────┘
1. Signal Generation Features
Signal Generation inputs control which divergence categories are actively calculated and establish the timing required for signal confirmation.
-
Wait 1 Bar (Default: True)
-
Purpose: Controls whether the indicator requires one fully completed bar after a potential divergence structure is detected before finalizing the signal.
-
Technical Behavior: When set to
True, the indicator delays signal output until the confirmation bar closes, preventing false signals caused by intra-bar price ticks that fluctuate before the period finishes. Setting this input toFalseprovides real-time responsiveness at the expense of chart stability during active bar formation.
-
-
Show Regular Bullish / Show Regular Bearish (Default: True)
-
Purpose: Enables or disables the evaluation and display of regular bullish or regular bearish trend-exhaustion divergences.
-
-
Show Hidden Bullish / Show Hidden Bearish (Default: True)
-
Purpose: Enables or disables the evaluation and display of hidden bullish or hidden bearish trend-continuation divergences.
-
2. Signal Filtering Features
Filtering settings apply structural validation criteria to raw divergence structures before confirming a signal, eliminating low-quality noise in choppy or transitional environments.
-
Enhanced Mode (Default: False)
-
Purpose: Applies an advanced, multi-point geometric filter to detected divergence structures.
-
Technical Behavior: When enabled (
True), the indicator evaluates additional relationship criteria between the historical anchor points and intermediate price bars. Signals that meet standard ADX divergence criteria but fail this structural validation filter are suppressed, significantly increasing signal selectivity in ranging markets.
-
3. Advanced Parameters (Calculation Engine)
Advanced parameters directly configure the internal mathematical engine that identifies price and ADX swing points.
-
Divergence Bar Range (Default: ShortRange)
-
Purpose: Defines the structural search boundary (distance in bars) between historical divergence anchor points.
-
Available Options:
ShortRange(focuses on tight, recent swing pivots),MidRange(evaluates intermediate structural swings), andLongRange(searches across broad macro market structures).
-
-
Divergence Lookback (Default: 5)
-
Purpose: Specifies the number of historical bars evaluated to confirm a local swing high or swing low.
-
Technical Behavior: A higher setting requires larger, more prominent price pivots before a swing point is recognized, filtering out minor price fluctuations. A lower setting increases sensitivity to smaller intraday price turns.
-
-
Filter Length (Default: 5)
-
Purpose: Controls the internal smoothing period applied to raw ADX values during structural evaluation.
-
Technical Behavior: Smoothing stabilizes peak detection on noisy intraday charts, ensuring that divergence lines are drawn across structurally sound ADX peaks rather than minor tick spikes.
-
4. Display & Visualization Settings
Visualization parameters manage how confirmed divergence information is presented within Sierra Chart without altering analytical logic.
-
Show Char (Default: True) — Displays textual annotations (e.g., "RB" for Regular Bearish, "HB" for Hidden Bullish) directly above or below confirmed price bars.
-
Show Line (Default: True) — Draws explicit visual trendlines connecting the historical price anchor points and the corresponding ADX sub-graph peaks.
-
Only Show Last Signal Within Bars (Default: 10) — Automatically manages chart clutter by hiding older historical signal annotations if a new signal of the same category occurs within the specified bar distance.
-
Price Line Brush / Dash Style / Width — Provides granular control over line color, stroke style (Solid, Dashed, Dotted), and pixel thickness to seamlessly align with custom Sierra Chart color schemes.
5. Alerts & Notifications
-
Enable Alert (Default: True) — Triggers Sierra Chart’s native system alert log when a new Double Divergence signal is confirmed.
-
Alert Sound (Default: Alert1.wav) — Configures the native audio file played upon signal confirmation.
Practical Analytical Benefits
Integrating the ADX Double Divergence Indicator for Sierra Chart into a daily trading methodology provides several concrete analytical benefits:
+--------------------------------------------------------------------------+
|                  SUMMARY OF PRACTICAL TRADING BENEFITS                   |
+-----------------------------------+--------------------------------------+
| Analytical Challenge              | ADX Double Divergence Solution       |
+-----------------------------------+--------------------------------------+
| Chasing exhausted trends at highs | Identifies Bearish Regular           |
| or lows                           | Divergence (price HH, ADX LH)        |
+-----------------------------------+--------------------------------------+
| Getting shaken out during minor   | Confirms Bullish Hidden Divergence   |
| pullbacks                         | (price HL, ADX structural reset)     |
+-----------------------------------+--------------------------------------+
| Subjective chart drawing and peak | Quantitative, automated dual-pivot   |
| misidentification                 | structural anchor point detection    |
+-----------------------------------+--------------------------------------+
| Wasted screen time monitoring     | Native Sierra Chart audio alerts and |
| dozens of chart windows           | Message Log notifications            |
+-----------------------------------+--------------------------------------+
1. Objective Assessment of Trend Health
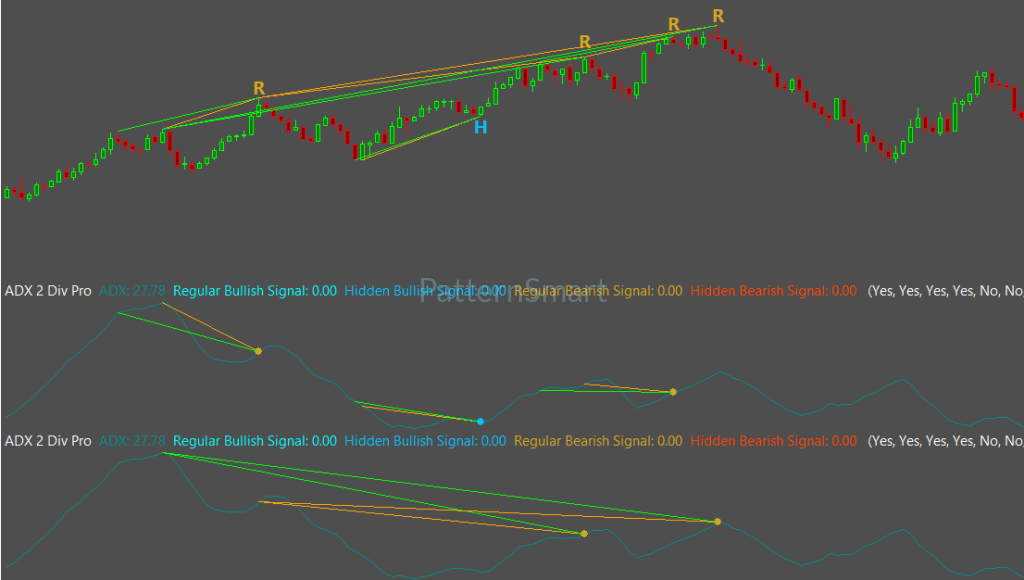
Rather than guessing whether an advancing market has the energy to continue higher, traders can instantly check if ADX trend strength is making new highs alongside price. If price reaches a new high while ADX forms a lower high, the resulting Bearish Regular Divergence visually warns that buying pressure is losing structural backing.
2. High-Probability Pullback Entry Confirmation
During strong, established trends, counter-trend pullbacks often shake out disciplined traders. By identifying Hidden Divergence, the indicator confirms when a pullback has held structural support while ADX has reset, signaling that the primary trend remains healthy and ready to resume.
3. Elimination of Visual Subjectivity
Manual divergence drawing is notoriously prone to cognitive bias—traders often see what they hope to see. The indicator's automated calculation engine evaluates every bar against strict mathematical criteria, ensuring that divergence lines are plotted consistently across all timeframes and instruments.
4. Optimized Multi-Market Workflow
Active traders who monitor multiple futures contracts (e.g., E-mini S&P 500, Nasdaq, Crude Oil, Gold, 10-Year Notes) can deploy native Sierra Chart alerts to track setups across multiple charts simultaneously, eliminating the need to constantly monitor every screen.
Frequently Asked Questions
What does ADX Double Divergence measure compared to an RSI divergence indicator?
ADX evaluates trend strength and directional expansion, regardless of price direction. RSI measures momentum velocity and rate of price change. While RSI divergence highlights changes in price speed (often near sharp turning points), ADX divergence highlights changes in underlying trend conviction and structural stability. Combining both provides a multi-dimensional perspective on market behavior.
Does ADX Double Divergence predict exact market reversal points?
No. Technical analysis operates on probabilities, not certainty. Divergence is an analytical observation indicating that price and trend strength are no longer aligned. Regular divergence highlights trend deterioration and potential exhaustion, but it should always be confirmed by price action, support/resistance levels, or market structure before making execution decisions.
What is the difference between "Wait 1 Bar" and "Enhanced Mode"?
Wait 1 Bar controls signal confirmation timing by delaying signal output until the confirmation bar closes, preventing false signals from intra-bar price ticks. Enhanced Mode is a structural filter that evaluates geometric relationships between historical anchor points to eliminate lower-quality setups. Wait 1 Bar dictates when a signal is confirmed, whereas Enhanced Mode determines whether an eligible signal meets higher structural standards.Which markets and timeframes are best suited for ADX Double Divergence on Sierra Chart?
ADX Double Divergence performs best in liquid markets that exhibit structured directional movement, such as Equity Index Futures (ES, NQ, RTY), Energy and Metals Futures (CL, GC), Treasury Futures (ZB, ZN), and major Forex pairs. It is highly effective across standard intraday timeframes (3-minute, 5-minute, 15-minute), tick/volume charts, and daily swing charts.
How do I reduce signal frequency during choppy, range-bound market conditions?
To reduce minor signals in non-trending markets, enable Enhanced Mode (
True), increase the Divergence Lookback (e.g., from 5 to 8 or 10), or set the Divergence Bar Range to MidRange or LongRange. These adjustments force the calculation engine to focus exclusively on major, macro-structural swing pivots.Conclusion
Technical analysis is fundamentally the process of evaluating technical evidence to estimate market probabilities. While price action remains the ultimate driver of market performance, measuring the underlying strength supporting that price action provides essential context for professional decision-making.
The ADX Double Divergence Indicator for Sierra Chart bridges the gap between raw indicator math and actionable market structure. By automating the structural comparison between price swing points and ADX strength peaks, it provides traders with an objective, confirmation-based tool to evaluate trend health, spot trend exhaustion, and trade alongside primary market trends with enhanced confidence.
Whether deployed as a trend quality filter for discretionary swing traders or integrated into automated strategy development within Sierra Chart, the ADX Double Divergence Indicator delivers the precision, performance, and analytical rigor required in modern electronic markets.
Looking for the complete mathematical breakdown, step-by-step optimization guides, and advanced trading strategies? Explore our comprehensive documentation:
Visit the Technical Inputs Manual: Double Divergence Pro for full parameter tuning.
Read the master guide on the Double Divergence Indicator Series.
Write a review
Your Name:Your Review: Note: HTML is not translated!
Rating: Bad Good
Enter the code in the box below:


Latest

Welcome to Patternsmart
Converting your indicator from one platform to another.Custom Alert, Autotrader, Indicators, Scan, Screener, Strategy and Signals.
Copyright @ 2026 Patternsmart - All rights reserved
This website is for educational and informational
purposes only and should not be considered a solicitation to buy or sell a
futures contract or make any other type of investment decision. It's not recommended to use any single indicator as sole evaluation criteria. The companies
and services listed on this website are not to be considered a recommendation
and it is the reader's responsibility to evaluate any product, service, or
company. patternsmart is not responsible for the accuracy or content of any
product, service or company linked to on this website.
Futures trading
contains substantial risk and is not for every investor.Please read the following risk disclosure before considering the
trading of this product:
Futures Risk Disclosure. An investor could
potentially lose all or more than the initial investment. Risk capital is money
that can be lost without jeopardizing ones financial security or life style.
Only risk capital should be used for trading and only those with sufficient risk
capital should consider trading. Past performance is not necessarily indicative
of future results.
Trading stocks, options, futures and forex involves
speculation, and the risk of loss can be substantial.Investor must consider all
relevant risk factors, including their own personal financial situation, before
trading. Trading foreign exchange on margin carries a high level of risk, as
well as its own unique risk factors. Forex investments are subject to
counter-party risk, as there is no central clearing organization for these
transactions. Please read the following risk disclosure before considering the
trading of this product:
Forex Risk Disclosure. Spreads, Straddles, and other multiple-leg option
strategies can entail substantial transaction costs, including multiple
commissions, which may impact any potential return. Options are not suitable for
all investors as the special risks inherent to options trading may expose
investors to potentially rapid and substantial losses. Prior to trading options,
you should carefully read
Characteristics and Risks of Standardized Options.
patternsmart.com
will not be held liable for the loss of money or any damage caused from relying
on the information on this site. Any investment decision you make in your account is solely your responsibility.
TESTIMONIAL DISCLOSURE: TESTIMONIALS APPEARING ON OUR SITE MAY NOT BE REPRESENTATIVE OF THE EXPERIENCE OF OTHER CLIENTS OR CUSTOMERS AND IS NOT A GUARANTEE OF FUTURE PERFORMANCE OR SUCCESS.