
Your shopping cart is empty!
Shopping Cart
0 item(s) - FreeCustomization and Conversion for: Ctrader, MetaTrader(MT4, MT5), Thinkorswim, NinjaTrader, MultiCharts, Tradingview, Prorealtime, SierraChart, etc.
License renew price will be 20% off for the 2nd year and after.
Every Purchase Comes with a Coupon.
Share Your Experience. Help Other Traders Learn. Get Rewarded.
Share Your Experience. Help Other Traders Learn. Get Rewarded.
Featured




Momentum Double Divergence Pro for Sierra Chart


 (
(Momentum Double Divergence Indicator for Sierra Chart: A Beginner’s Guide to Timing Market Shifts
Determining when a market is about to accelerate—or when an existing move is running out of steam—is one of the primary challenges in technical analysis. While price charts clearly show where a market has been, they do not always reveal changes in underlying market speed.
Price often continues advancing even after the underlying force pushing it forward has begun to slow down. For traders trying to evaluate potential trend transitions or short-term swing opportunities, watching price alone can sometimes feel like looking in the rearview mirror.
This is where momentum analysis becomes particularly valuable. By evaluating the rate of price change rather than just price levels, momentum provides a unique window into developing market sentiment. The Momentum Double Divergence Indicator for Sierra Chart combines classic rate-of-change measurements with PatternSmart’s structured confirmation methodology, offering a clear, objective tool for identifying early momentum shifts.
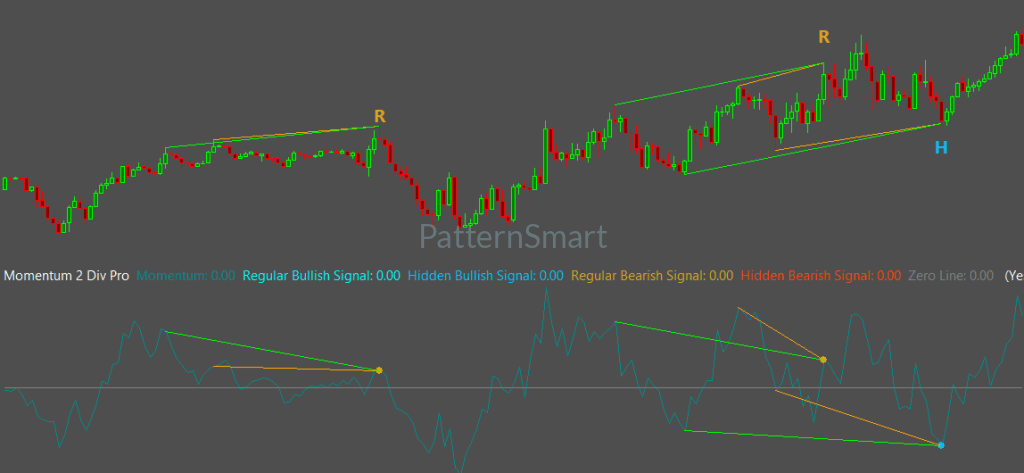
Understanding Momentum: Speed vs. Direction
To analyze momentum effectively, it helps to distinguish between market direction and market speed:
-
Price Direction tells you where the market is moving (upward or downward).
-
Momentum measures how rapidly price is changing relative to a previous period.
Think of market momentum like a car driving up a steep hill. Even if the car is still moving forward (price is rising), the driver might ease off the accelerator (momentum is slowing down). The car doesn't immediately stop or reverse, but its forward speed deteriorates.
In technical analysis, when price continues making new highs while momentum fails to achieve corresponding new highs, the market is demonstrating a disagreement between speed and price. This difference in behavior is known as divergence.
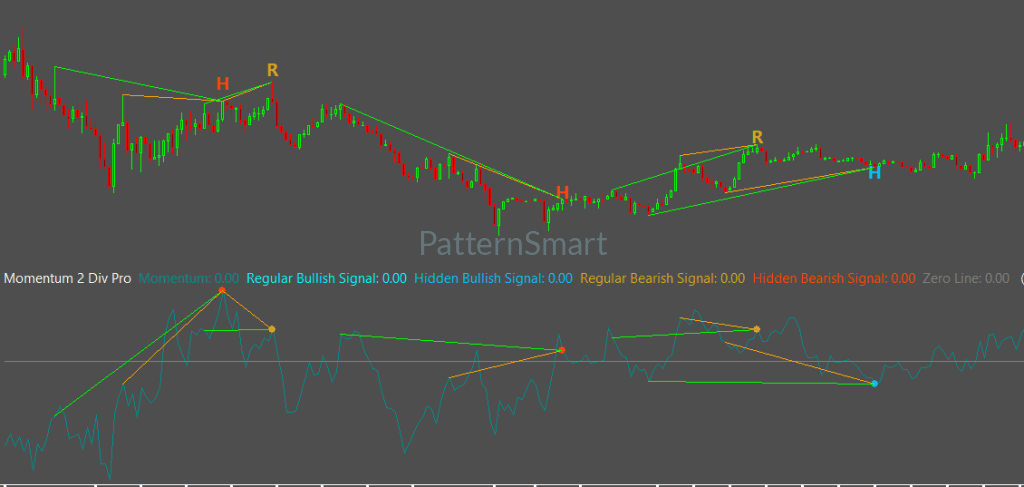
What Is Divergence Analysis?
Divergence occurs when price action and a technical indicator move out of alignment. Under normal market conditions, price and momentum move in harmony: strong price advances are accompanied by expanding momentum values, while falling prices coincide with declining momentum values.
When this relationship breaks down, it provides valuable analytical information:
-
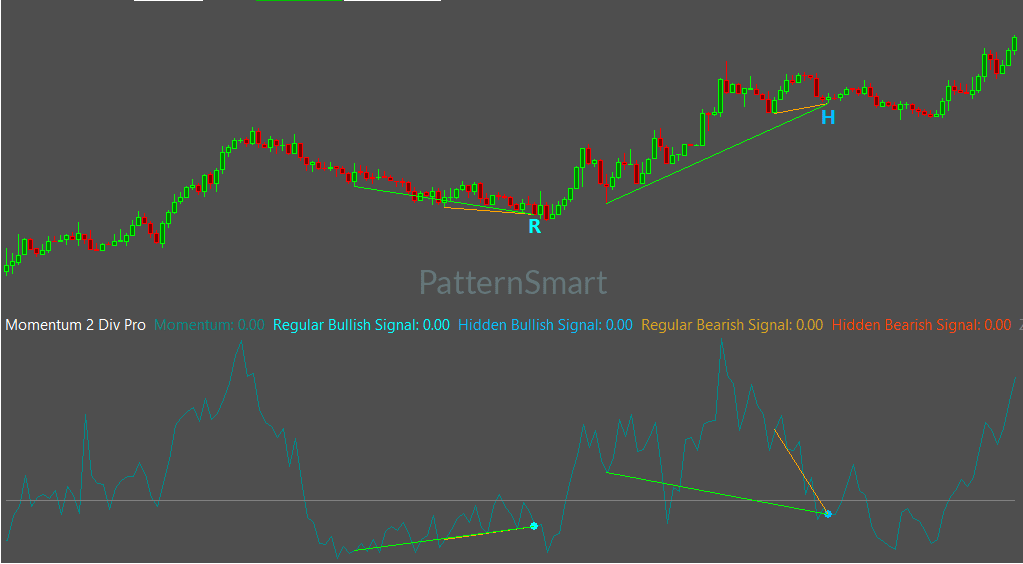
Regular Divergence: Occurs when price reaches a new extreme (a higher high or lower low), but the Momentum indicator fails to confirm that extreme. This often reflects momentum exhaustion and suggests that current market conditions deserve closer evaluation.
-
Hidden Divergence: Occurs when price forms a higher low or lower high during a pullback, but the Momentum indicator forms a deeper extreme. This often indicates that underlying trend momentum remains technically intact despite a temporary price correction.
Divergence is an observation of market conditions rather than a guaranteed prediction of future price movement. Recognizing divergence helps traders evaluate probability and context rather than anticipating guaranteed reversals.
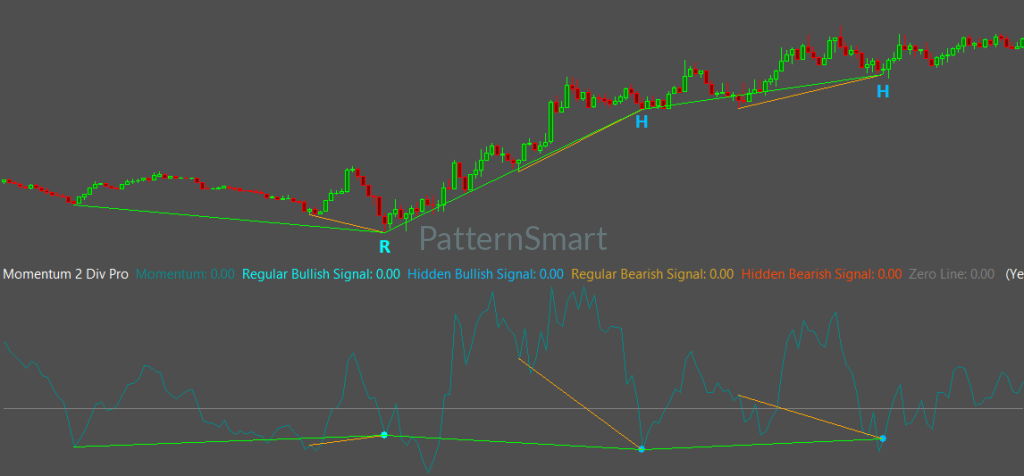
Why Double Divergence Matters
Traditional divergence analysis relies on observing a single disagreement between price and an indicator. However, single-line divergence observations can vary significantly in quality, especially during volatile market conditions or rapid trend accelerations.
The Double Divergence methodology addresses this challenge by prioritizing technical confirmation over isolated observations. Instead of treating every divergence event as an immediate trading signal, Double Divergence evaluates whether multiple structural conditions agree before confirming an event.
By requiring structured confirmation across anchor points, the Double Divergence framework helps filter out temporary market noise, allowing technical analysts to focus on higher-quality structural developments.
High-Performance Analysis in Sierra Chart
Sierra Chart is recognized throughout the professional trading community for its speed, precision, and efficient data handling. Traders who select Sierra Chart typically value an environment that delivers high-performance technical tools without sacrificing chart responsiveness.
The Momentum Double Divergence Indicator integrates seamlessly into the Sierra Chart environment. It applies sophisticated divergence calculations directly onto your charts while preserving the fast, streamlined workflow that Sierra Chart users expect.
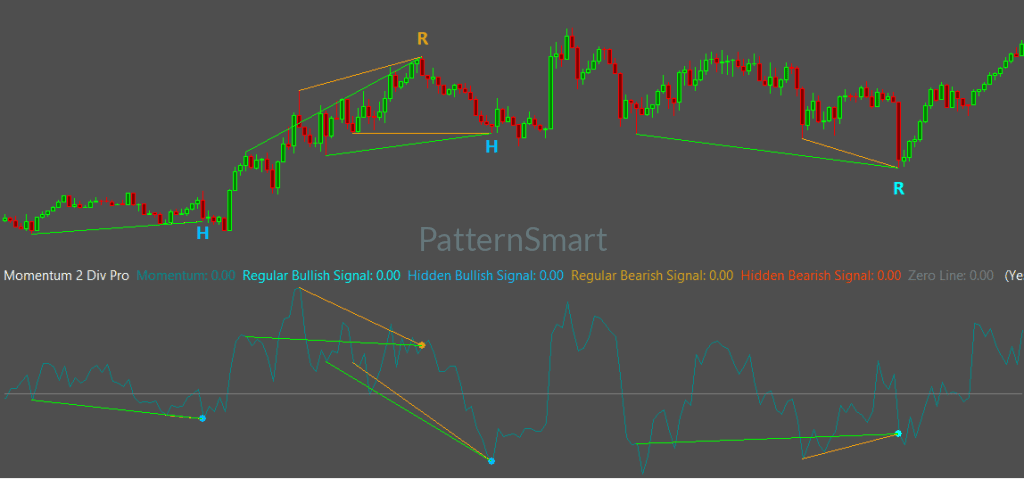
Key Features for Sierra Chart Users
The Momentum Double Divergence Indicator includes configurable parameters that adapt to your specific charting workflow while preserving the official Double Divergence methodology.
1. Wait 1 Bar
The Wait 1 Bar setting determines when a detected signal is finalized. When set to
True, the indicator requires one completed confirmation bar before displaying a confirmed signal. This prevents premature signal confirmation during live, unclosed price bars and stabilizes chart visualization.2. Enhanced Mode
For traders seeking stricter validation, Enhanced Mode applies an additional structural filter before a signal is finalized. It evaluates geometric relationships between historical anchor points, filtering out minor price fluctuations and highlighting structurally significant momentum shifts.
3. Divergence Bar Range
The Divergence Bar Range parameter controls the historical search boundary used to locate valid divergence anchor points. Configured as
ShortRange, MidRange, or LongRange, it allows traders to focus on compact swing structures or evaluate broader, multi-session market developments.4. Divergence Lookback
The Divergence Lookback setting specifies the number of historical bars evaluated when identifying local swing highs and swing lows. Adjusting this parameter influences the sensitivity of swing point detection, allowing users to tailor structural evaluation to high-volatility or low-volatility environments.
5. Configurable Real-Time Alerts
To support multi-chart monitoring, the Enable Alert feature triggers real-time audio and visual notifications the moment a Double Divergence signal is confirmed. This allows traders to track developing conditions across multiple markets without needing to monitor every Sierra Chart window continuously.
Practical Analytical Benefits
Integrating Momentum Double Divergence into your Sierra Chart workspace offers several key analytical advantages:
-
Early Shift Detection: Highlights rate-of-change deceleration before trend changes become obvious on price charts alone.
-
Structured Confirmation: Reduces emotional decision-making by applying a repeatable, objective methodology to divergence evaluation.
-
Improved Chart Organization: Manages historical visual objects neatly using features like
OnlyShowLastSignalWithinBars, keeping charts clean and easy to read. -
Workflow Efficiency: Automates swing detection and structural validation, allowing you to focus on overall market structure and context.
Looking for the complete mathematical breakdown, step-by-step optimization guides, and advanced trading strategies? Explore our comprehensive documentation:
Visit the Technical Inputs Manual: Double Divergence Pro for full parameter tuning.
Read the master guide on the Double Divergence Indicator Series.
Frequently Asked Questions
What is the primary difference between Momentum and RSI Double Divergence?
While RSI measures momentum relative to an internal overbought/oversold scale, the Momentum indicator measures the pure rate of price change over a specific lookback period. Momentum is often more responsive to rapid price acceleration and early market transitions.
Does the Momentum Double Divergence Indicator work on all timeframes?
Yes. The Double Divergence methodology is timeframe-independent. It applies the same structured confirmation process whether you analyze a 1-minute intraday futures chart or a daily stock chart.
Will enabling Enhanced Mode reduce the number of visible signals?
Yes. Enhanced Mode applies stricter structural validation criteria to detected divergence events. While this results in fewer total signals, it emphasizes higher-quality structural setups.
Conclusion
Understanding market speed is just as important as identifying market direction. By measuring the rate of price change, momentum analysis provides early insight into developing market transitions, helping traders evaluate whether price advances or declines are supported by genuine underlying strength.
The Momentum Double Divergence Indicator for Sierra Chart brings a disciplined, confirmation-first methodology to rate-of-change analysis. By automating structural detection and providing configurable filtering
options, it helps traders evaluate momentum shifts with greater clarity and technical consistency.
options, it helps traders evaluate momentum shifts with greater clarity and technical consistency.
Write a review
Your Name:Your Review: Note: HTML is not translated!
Rating: Bad Good
Enter the code in the box below:


Latest

Welcome to Patternsmart
Converting your indicator from one platform to another.Custom Alert, Autotrader, Indicators, Scan, Screener, Strategy and Signals.
Copyright @ 2026 Patternsmart - All rights reserved
This website is for educational and informational
purposes only and should not be considered a solicitation to buy or sell a
futures contract or make any other type of investment decision. It's not recommended to use any single indicator as sole evaluation criteria. The companies
and services listed on this website are not to be considered a recommendation
and it is the reader's responsibility to evaluate any product, service, or
company. patternsmart is not responsible for the accuracy or content of any
product, service or company linked to on this website.
Futures trading
contains substantial risk and is not for every investor.Please read the following risk disclosure before considering the
trading of this product:
Futures Risk Disclosure. An investor could
potentially lose all or more than the initial investment. Risk capital is money
that can be lost without jeopardizing ones financial security or life style.
Only risk capital should be used for trading and only those with sufficient risk
capital should consider trading. Past performance is not necessarily indicative
of future results.
Trading stocks, options, futures and forex involves
speculation, and the risk of loss can be substantial.Investor must consider all
relevant risk factors, including their own personal financial situation, before
trading. Trading foreign exchange on margin carries a high level of risk, as
well as its own unique risk factors. Forex investments are subject to
counter-party risk, as there is no central clearing organization for these
transactions. Please read the following risk disclosure before considering the
trading of this product:
Forex Risk Disclosure. Spreads, Straddles, and other multiple-leg option
strategies can entail substantial transaction costs, including multiple
commissions, which may impact any potential return. Options are not suitable for
all investors as the special risks inherent to options trading may expose
investors to potentially rapid and substantial losses. Prior to trading options,
you should carefully read
Characteristics and Risks of Standardized Options.
patternsmart.com
will not be held liable for the loss of money or any damage caused from relying
on the information on this site. Any investment decision you make in your account is solely your responsibility.
TESTIMONIAL DISCLOSURE: TESTIMONIALS APPEARING ON OUR SITE MAY NOT BE REPRESENTATIVE OF THE EXPERIENCE OF OTHER CLIENTS OR CUSTOMERS AND IS NOT A GUARANTEE OF FUTURE PERFORMANCE OR SUCCESS.