
Your shopping cart is empty!
Shopping Cart
0 item(s) - FreeCustomization and Conversion for: Ctrader, MetaTrader(MT4, MT5), Thinkorswim, NinjaTrader, MultiCharts, Tradingview, Prorealtime, SierraChart, etc.
License renew price will be 20% off for the 2nd year and after.
Every Purchase Comes with a Coupon.
Share Your Experience. Help Other Traders Learn. Get Rewarded.
Share Your Experience. Help Other Traders Learn. Get Rewarded.
Featured






RSI Double Divergence for MultiCharts .NET


 (
(Professional RSI Momentum and Divergence Analysis for MultiCharts x.NET
Price can continue moving in the same direction even after the momentum supporting that movement begins to weaken. This creates an important analytical challenge: the chart may still appear bullish or bearish, while the underlying momentum is beginning to tell a different story.
RSI Double Divergence Pro for MultiCharts x.NET is designed to help traders examine this relationship more systematically. By combining RSI momentum analysis with the PatternSmart Double Divergence methodology, the indicator provides a structured way to evaluate momentum shifts, potential exhaustion, reversal conditions, and continuation after pullbacks.
The product is designed for the MultiCharts .NET environment, making it particularly relevant to C# developers, quantitative traders, algorithmic traders, and professional system designers who value extensibility, object-oriented development, and structured analytical workflows.
Why Momentum Changes Matter
RSI is commonly associated with overbought and oversold readings, but its more useful analytical role extends beyond those traditional zones.
RSI evaluates the speed and magnitude of recent price movement. When price continues to advance but RSI momentum begins weakening, the relationship between price and momentum can provide additional information about the condition of the market.
The same principle applies during declining markets. Price may continue establishing new lows while downside momentum becomes less pronounced.
These situations do not guarantee a reversal. Instead, they indicate that price and momentum are no longer behaving in complete agreement.
This is where divergence analysis becomes useful.
For professional technical analysis, the important question is not simply:
"Is RSI overbought or oversold?"
A more useful question is:
"Is current price movement still receiving the same momentum support as before?"
RSI Double Divergence is designed around this second question.
What Is RSI Double Divergence?
Traditional divergence compares price with an indicator at two relevant swing points. Double Divergence extends this concept by evaluating divergence across multiple structural observations rather than relying on a single comparison.
The PatternSmart methodology emphasizes:
Observe → Compare → Confirm → Interpret → Evaluate
Price remains the primary source of information, while RSI provides an additional perspective on momentum.
This means a Double Divergence observation should be interpreted as analytical information rather than a prediction. Additional confirmation from price action, market structure, support and resistance, or other technical evidence can help determine whether the divergence deserves greater attention.
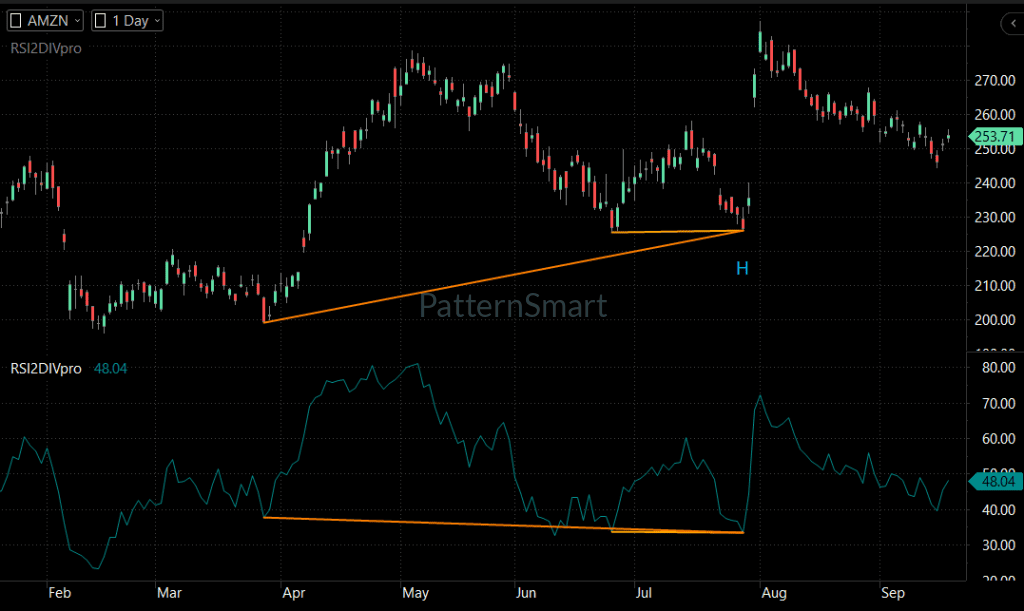
Four RSI Double Divergence Perspectives
A key advantage of the RSI Double Divergence framework is that it distinguishes between reversal-oriented and continuation-oriented divergence.
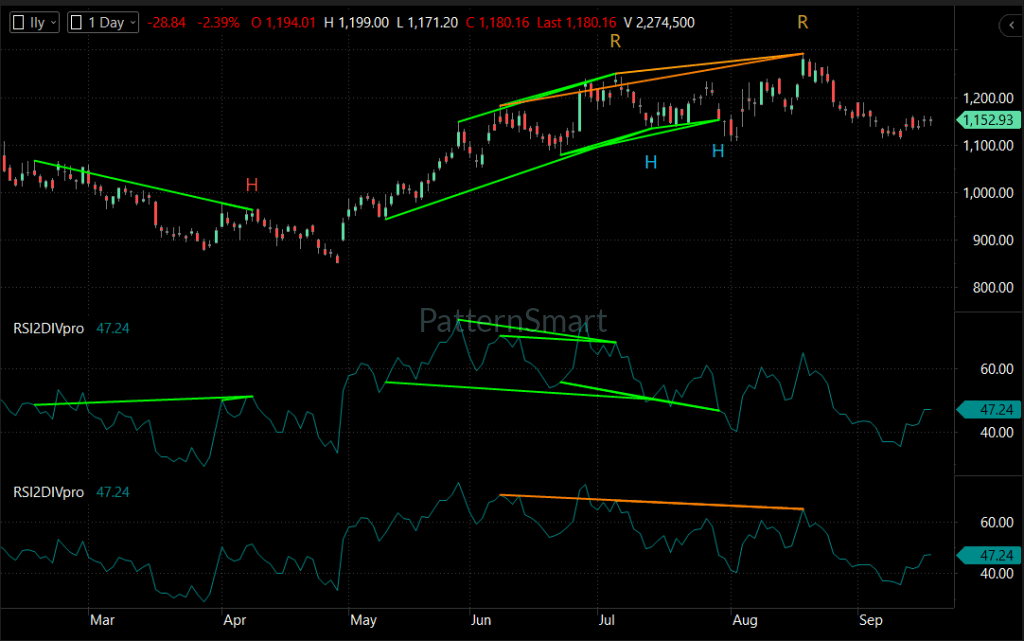
Regular Bullish Divergence
Regular bullish divergence occurs when price establishes a lower low while RSI forms a higher low.
The price structure indicates continued selling pressure, while RSI suggests that downside momentum is not developing at the same rate.
When this relationship occurs across the required divergence structure, it can provide an early indication that bearish momentum may be losing strength.
Traders can then examine price structure and other confirmation factors before interpreting the observation as a potential reversal environment.
Regular Bearish Divergence
Regular bearish divergence occurs when price establishes a higher high while RSI forms a lower high.
Price is still advancing, but RSI momentum is failing to confirm the latest price strength.
This can provide useful information when evaluating potential momentum exhaustion following an extended advance.
It should not, however, be interpreted as proof that price must immediately reverse.
Hidden Bullish Divergence
Hidden bullish divergence focuses on continuation rather than reversal.
Price forms a higher low while RSI forms a lower low. The deeper RSI decline reflects a momentum reset during a broader bullish structure, while price maintains the higher-low relationship.
This makes hidden bullish divergence particularly relevant when studying pullbacks within developing or established uptrends.
Hidden Bearish Divergence
Hidden bearish divergence occurs when price forms a lower high while RSI forms a higher high.
Price maintains a bearish structural relationship while RSI experiences a counter-move in momentum.
Rather than attempting to identify a market top, this type of divergence can be examined as a potential continuation condition within a broader downtrend.
RSI Double Divergence for Momentum Exhaustion and Reversal Timing
RSI is particularly useful when the analytical objective is to understand momentum exhaustion.
A market can continue trending after momentum begins to decelerate. Therefore, the appearance of divergence should not automatically lead to a counter-trend decision.
Instead, traders can use the divergence as a reason to investigate:
-
Has the trend become extended?
-
Is price approaching an important structural level?
-
Is momentum continuing to weaken?
-
Does the higher timeframe support the same interpretation?
-
Is there confirming price action?
-
Is the market transitioning from expansion into consolidation?
This confirmation-first approach is central to the PatternSmart methodology.
RSI Double Divergence can therefore function as part of a broader analytical process rather than as a standalone reversal system.
RSI Double Divergence Pro in MultiCharts x.NET
MultiCharts .NET provides a development environment centered on C#, object-oriented architecture, customization, quantitative development, and software extensibility.
That makes it a natural environment for traders and developers who want technical analysis to fit into a structured research or strategy-development workflow.
RSI Double Divergence Pro adds a momentum-focused analytical perspective to this environment while maintaining the same Double Divergence methodology used across PatternSmart's indicator family.
The methodology remains consistent across platforms. The platform primarily changes the development environment and workflow in which the analysis is used.
For quantitative traders, this distinction is important: the RSI Double Divergence methodology remains the analytical foundation, while MultiCharts x.NET provides the surrounding C# and .NET environment.
Flexible Divergence Analysis
RSI Double Divergence Pro provides controls that allow traders to determine which divergence structures and validation characteristics are relevant to their workflow.
Show Regular Bullish / Bearish
These settings control the display and calculation of regular bullish and bearish divergence observations.
They are useful when the primary analytical interest is potential momentum exhaustion and reversal conditions.
Show Hidden Bullish / Bearish
Hidden divergence settings focus on continuation-oriented analysis.
Keeping hidden divergence available can be useful when evaluating pullbacks within broader directional structures.
Divergence Bar Range
The Divergence Bar Range provides three structural choices:
-
ShortRange — tighter, more immediate swing structures
-
MidRange — intermediate market swings
-
LongRange — broader structural peaks and troughs
This allows the analytical horizon to be aligned with the type of market structure being studied.
Divergence Lookback
Divergence Lookback controls the window used for identifying local extremes.
A larger value requires more sustained swing development before an extreme is recognized, while a smaller value can respond to shorter-term pivot structures.
Filter Length
Filter Length provides smoothing and structural filtering for the divergence analysis.
Its purpose is to help validate the relationship between RSI behavior and the identified market structure.
Enhanced Mode for Additional Structural Filtering
Enhanced Mode applies an additional structural validation layer to eligible divergence patterns.
When enabled, divergence structures must satisfy stricter structural conditions before being accepted.
This can reduce the number of qualifying observations and may be useful when the objective is to concentrate on more structurally filtered patterns.
The trade-off is important: stricter filtering can reduce signal frequency. Therefore, Enhanced Mode should be considered a filtering choice rather than an automatic improvement for every trading style.
Wait 1 Bar: Confirmation Versus Immediate Response
The Wait 1 Bar setting controls an additional confirmation step.
When enabled, a divergence signal is finalized using directional information from the following execution bar. This can add confirmation at the cost of one bar of additional delay.
When disabled, the indicator can register a structurally valid divergence without this additional candle-direction validation.
This distinction is particularly relevant when designing systematic rules because signal confirmation timing and signal structure filtering are separate concepts.
Alerts and Chart Visualization
RSI Double Divergence Pro also includes features designed to support a structured analytical workspace.
Enable Alert
Enable Alert activates notification handling after a Double Divergence structure has been confirmed.
Alerts do not generate or filter divergence signals; they communicate an already confirmed analytical event.
Show Char
Show Char controls the use of textual R/H labels for Regular and Hidden divergence observations, making it easier to distinguish divergence categories visually.
Show Line
Show Line displays divergence lines connecting the relevant structural price and RSI points.
These lines can make the relationship between price structure and momentum behavior easier to inspect.
Only Show Last Signal Within Bars
This setting helps manage chart density by removing older same-type signals that occur within the selected bar interval.
For systematic research and backtesting, traders may prefer to preserve more historical observations, while a live analytical workspace may benefit from reduced visual clutter.
Practical Analytical Benefits
RSI Double Divergence Pro for MultiCharts x.NET can support several aspects of a structured technical-analysis workflow:
-
Momentum evaluation: Examine whether price movement continues to receive comparable momentum support.
-
Reversal analysis: Identify momentum exhaustion that may warrant closer examination.
-
Continuation analysis: Use hidden divergence to study momentum resets during pullbacks.
-
Structural analysis: Evaluate divergence in relation to identifiable price swings.
-
Systematic research: Incorporate consistent divergence observations into a quantitative research workflow.
-
Workspace clarity: Use configurable labels, lines, alerts, and signal-display controls according to analytical requirements.
These benefits should be viewed as improvements to the analytical process rather than guarantees of market direction or trading performance.
Built for a Structured MultiCharts x.NET Workflow
For C# developers and quantitative traders, the value of an analytical indicator extends beyond what appears on an individual chart.
A structured environment can make it easier to maintain repeatable research processes, evaluate technical conditions, and develop customized analytical workflows.
RSI Double Divergence Pro fits this environment by combining a consistent divergence methodology with configurable signal, filtering, alert, and visualization controls.
The result is a momentum-analysis tool that can be examined from both a technical-analysis perspective and a systematic-development perspective.
Looking for the complete mathematical breakdown, step-by-step optimization guides, and advanced trading strategies? Explore our comprehensive documentation:
Visit the Technical Inputs Manual: Double Divergence Pro for full parameter tuning.
Read the master guide on the Double Divergence Indicator Series.
Frequently Asked Questions
What is RSI Double Divergence?
RSI Double Divergence compares price structure with RSI momentum across a Double Divergence framework. It is designed to identify situations where momentum behavior and price movement are no longer fully aligned.
What does regular RSI divergence indicate?
Regular bullish or bearish divergence can highlight potential momentum exhaustion and reversal conditions. It is an analytical observation, not a guaranteed reversal signal.
What does hidden RSI divergence indicate?
Hidden divergence is primarily associated with continuation analysis following a pullback. It can help traders evaluate whether the broader directional structure remains intact.
Can RSI Double Divergence be used for trend continuation?
Yes. Hidden bullish and hidden bearish divergence provide a framework for studying continuation conditions during pullbacks.
Is RSI Double Divergence only an overbought and oversold indicator?
No. RSI can provide considerably more information than overbought and oversold readings. Within the PatternSmart methodology, the primary emphasis is on momentum shifts, exhaustion, buying and selling pressure, and reversal timing.
Can RSI Double Divergence be used in systematic trading research?
The indicator is designed for the MultiCharts .NET environment, which supports C# development and quantitative workflows. Its structured inputs and signal classifications can therefore form part of a systematic research process, subject to the trader's own methodology and testing requirements.
Does divergence guarantee a reversal?
No. Divergence represents a difference between price behavior and indicator behavior. Confirmation and broader market context remain important.
Conclusion
Momentum does not always change at the same time as price.
That difference is one reason divergence remains useful in technical analysis. RSI provides a perspective on the speed and magnitude of recent price movement, while Double Divergence provides a structured framework for examining repeated relationships between price and momentum.
RSI Double Divergence Pro for MultiCharts x.NET brings this methodology into a C# and .NET-oriented environment designed for structured technical analysis, quantitative research, and extensible trading development.
For traders and developers interested in momentum shifts, exhaustion, reversal timing, and continuation analysis, the indicator provides a systematic way to add RSI-based divergence information to a broader market-evaluation process.
Write a review
Your Name:Your Review: Note: HTML is not translated!
Rating: Bad Good
Enter the code in the box below:


Latest

Welcome to Patternsmart
Converting your indicator from one platform to another.Custom Alert, Autotrader, Indicators, Scan, Screener, Strategy and Signals.
Copyright @ 2026 Patternsmart - All rights reserved
This website is for educational and informational
purposes only and should not be considered a solicitation to buy or sell a
futures contract or make any other type of investment decision. It's not recommended to use any single indicator as sole evaluation criteria. The companies
and services listed on this website are not to be considered a recommendation
and it is the reader's responsibility to evaluate any product, service, or
company. patternsmart is not responsible for the accuracy or content of any
product, service or company linked to on this website.
Futures trading
contains substantial risk and is not for every investor.Please read the following risk disclosure before considering the
trading of this product:
Futures Risk Disclosure. An investor could
potentially lose all or more than the initial investment. Risk capital is money
that can be lost without jeopardizing ones financial security or life style.
Only risk capital should be used for trading and only those with sufficient risk
capital should consider trading. Past performance is not necessarily indicative
of future results.
Trading stocks, options, futures and forex involves
speculation, and the risk of loss can be substantial.Investor must consider all
relevant risk factors, including their own personal financial situation, before
trading. Trading foreign exchange on margin carries a high level of risk, as
well as its own unique risk factors. Forex investments are subject to
counter-party risk, as there is no central clearing organization for these
transactions. Please read the following risk disclosure before considering the
trading of this product:
Forex Risk Disclosure. Spreads, Straddles, and other multiple-leg option
strategies can entail substantial transaction costs, including multiple
commissions, which may impact any potential return. Options are not suitable for
all investors as the special risks inherent to options trading may expose
investors to potentially rapid and substantial losses. Prior to trading options,
you should carefully read
Characteristics and Risks of Standardized Options.
patternsmart.com
will not be held liable for the loss of money or any damage caused from relying
on the information on this site. Any investment decision you make in your account is solely your responsibility.
TESTIMONIAL DISCLOSURE: TESTIMONIALS APPEARING ON OUR SITE MAY NOT BE REPRESENTATIVE OF THE EXPERIENCE OF OTHER CLIENTS OR CUSTOMERS AND IS NOT A GUARANTEE OF FUTURE PERFORMANCE OR SUCCESS.