
Your shopping cart is empty!
Shopping Cart
0 item(s) - FreeCustomization and Conversion for: Ctrader, MetaTrader(MT4, MT5), Thinkorswim, NinjaTrader, MultiCharts, Tradingview, Prorealtime, SierraChart, etc.
License renew price will be 20% off for the 2nd year and after.
Every Purchase Comes with a Coupon.
Share Your Experience. Help Other Traders Learn. Get Rewarded.
Share Your Experience. Help Other Traders Learn. Get Rewarded.
Featured




WilliamsR Double Divergence for MultiCharts .NET


 (
(WilliamsR Double Divergence Pro for MultiCharts x.NET
Market Extremes, Mean Reversion, and Structured Divergence Analysis
Markets can remain overextended longer than expected, but extended price movement does not always mean that the underlying market behavior is unchanged. When price continues pushing toward a new extreme, the relationship between price and an oscillator can provide another perspective on whether that movement is still being supported.
WilliamsR Double Divergence Pro for MultiCharts x.NET is designed around this analytical problem.
By combining Williams %R with the PatternSmart Double Divergence methodology, the indicator provides a structured way to examine relative price positioning, market extremes, mean-reversion conditions, and potential reversal development.
The MultiCharts x.NET implementation brings this analysis into an engineering-oriented C# environment suited to quantitative research, systematic workflows, and software extensibility.
The objective is not to predict every market reversal. Instead, WilliamsR Double Divergence Pro helps organize information that can make potentially overextended price behavior worthy of closer examination.
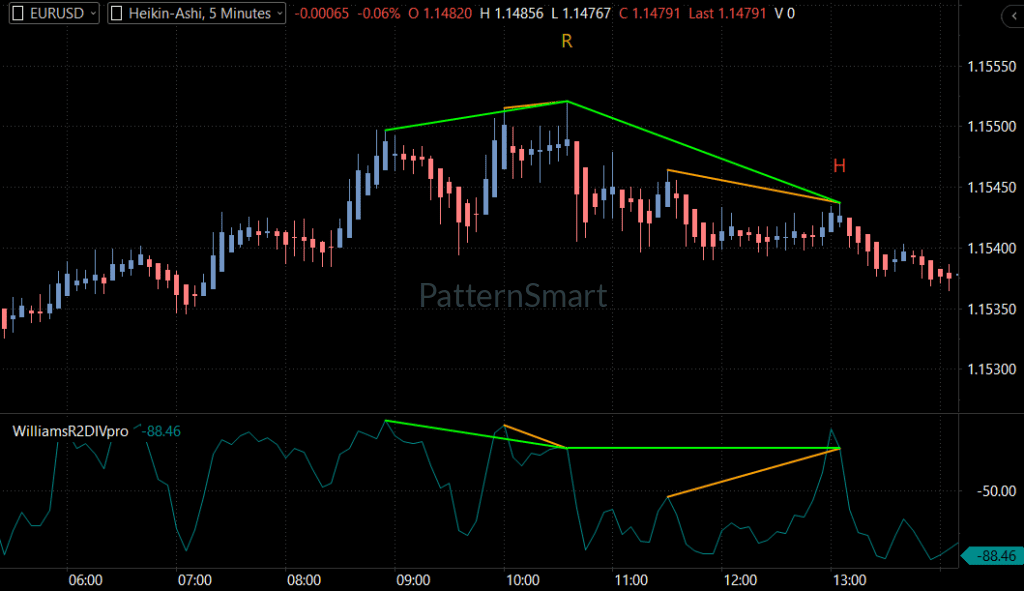
Why Williams %R Matters When Price Becomes Overextended
Williams %R is an oscillator that evaluates where the current price is positioned relative to its recent trading range.
This makes it particularly relevant when analyzing situations in which price approaches or moves through the upper or lower portions of its recent range.
For technical analysts, this creates an important distinction:
Price tells you where the market has moved. Williams %R provides information about where that price sits within its recent range.
That additional perspective can become useful when markets experience extended directional movement.
Williams %R is particularly relevant to:
-
Market extremes
-
Relative price positioning
-
Mean-reversion analysis
-
Reversal potential
-
Swing trading
-
Counter-trend analysis
The PatternSmart Indicator Knowledge Base specifically identifies Williams %R as an indicator for market extremes, mean reversion, and reversal potential. It also notes that Williams %R divergence can develop when price continues moving during extended conditions while underlying indicator behavior begins to change.
This makes WilliamsR Double Divergence different in emphasis from indicators primarily designed to evaluate trend strength or market participation.
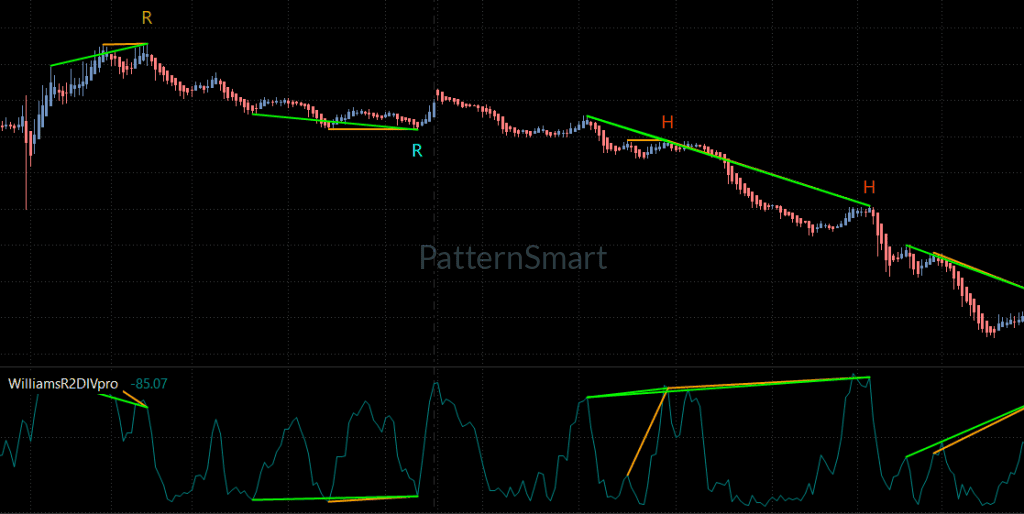
What Is WilliamsR Double Divergence?
Divergence occurs when price action and an indicator no longer move in complete agreement.
With Williams %R, the analysis focuses on whether relative price positioning within the recent trading range continues to support the latest price extreme.
The Double Divergence methodology adds structure to this observation.
Rather than treating divergence as an automatic reversal signal, PatternSmart treats it as analytical evidence that deserves further evaluation.
The methodology emphasizes:
-
Price action
-
Indicator behavior
-
Market context
-
Technical confirmation
-
Independent interpretation
This confirmation-first philosophy is fundamental to PatternSmart Double Divergence. Divergence may provide useful information, but its significance depends on the surrounding market environment.
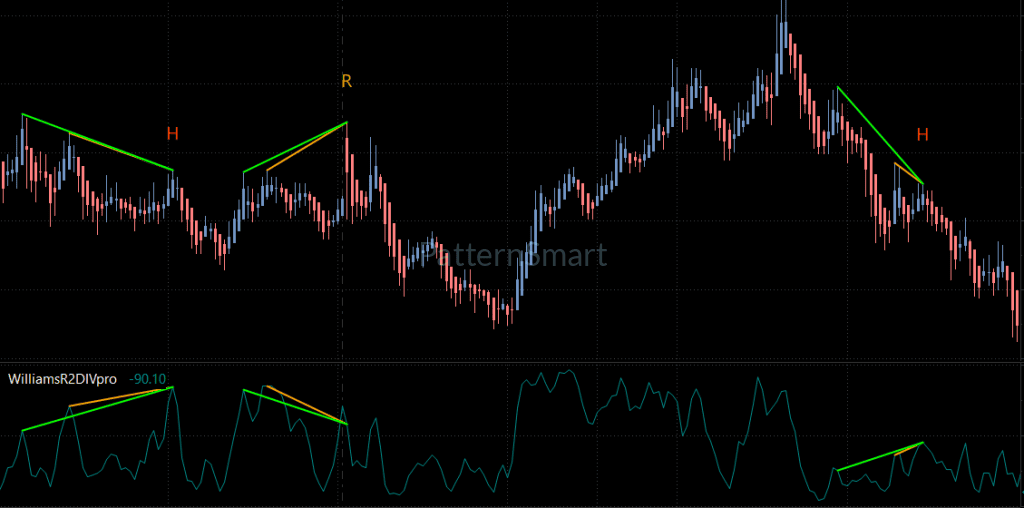
The Four Williams %R Double Divergence Types
WilliamsR Double Divergence Pro uses the same official signal classification across the PatternSmart product family:
-
Bullish Regular Divergence
-
Bearish Regular Divergence
-
Bullish Hidden Divergence
-
Bearish Hidden Divergence
The classification remains consistent across platforms; what changes is the indicator being analyzed and the platform implementation.
Bullish Regular Divergence
Price: Lower Low
Williams %R: Higher Low
Bullish Regular Divergence occurs when price establishes a lower low while Williams %R forms a higher low.
The price chart is therefore showing continued downside movement, while the Williams %R structure is not confirming the same degree of weakness.
For a Williams %R-based analysis, this may suggest that the market is becoming increasingly extended on the downside and that the existing bearish movement deserves closer examination.
In a suitable market context, this can contribute to mean-reversion or reversal analysis.
It does not establish that a bullish reversal must occur.
Bearish Regular Divergence
Price: Higher High
Williams %R: Lower High
Bearish Regular Divergence occurs when price makes a higher high while Williams %R forms a lower high.
The market is continuing to push upward, but Williams %R is not confirming the same progression.
This may provide evidence that an upward price extension is becoming less consistent with the oscillator's behavior.
When combined with relevant resistance, market structure, or other confirmation, the observation may become useful when evaluating potential exhaustion or reversal conditions.
Bullish Hidden Divergence
Price: Higher Low
Williams %R: Lower Low
Bullish Hidden Divergence occurs when price holds a higher low while Williams %R makes a lower low.
This is an important distinction from Bullish Regular Divergence.
Rather than focusing primarily on a new price low and possible reversal, Hidden Divergence can provide information about a pullback occurring within a broader bullish structure.
The deeper Williams %R movement may represent temporary weakness while price maintains the higher structural low.
Its interpretation still depends on the broader trend and supporting evidence.
Bearish Hidden Divergence
Price: Lower High
Williams %R: Higher High
Bearish Hidden Divergence occurs when price establishes a lower high while Williams %R forms a higher high.
This can provide information about a temporary upward movement occurring within a broader bearish structure.
If the market continues to maintain lower structural highs, the divergence may contribute to an evaluation of whether the upward movement represents a pullback rather than a broader directional reversal.
Again, context and confirmation remain essential.
PatternSmart's methodology explicitly defines these classifications as observations rather than rankings or automatic trading instructions.
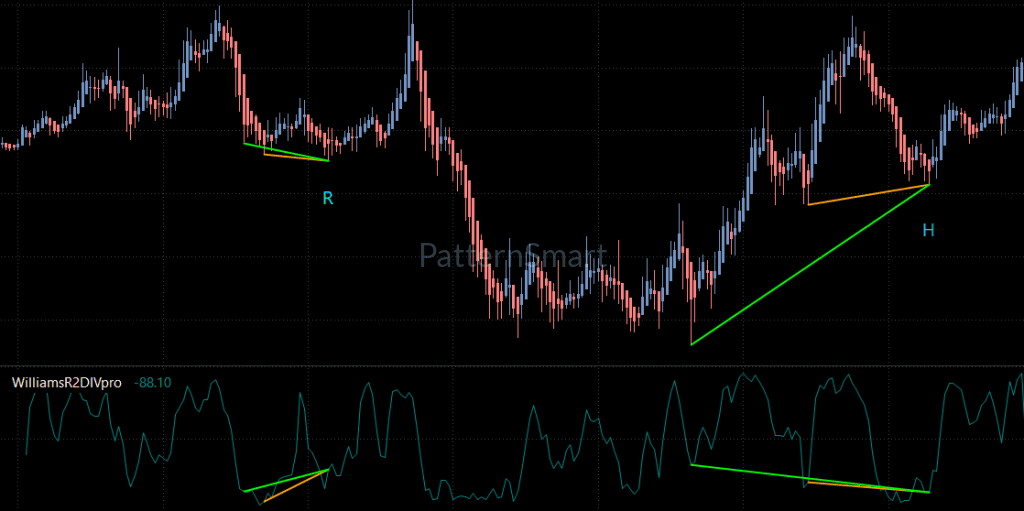
Williams %R and the Analysis of Market Extremes
One of the most useful ways to approach WilliamsR Double Divergence is to think in terms of relative price positioning rather than simply overbought and oversold labels.
A market reaching an extreme does not automatically mean that it should reverse.
Strong directional markets can remain extended while price continues to develop in the same direction.
This is one reason Williams %R should be interpreted within context.
Consider a market making successive highs:
-
Price reaches a new high.
-
Williams %R reflects the new relative price position.
-
Price later establishes another high.
-
Williams %R fails to reproduce the same structure.
-
A Bearish Regular Divergence develops.
-
The analyst then examines resistance, trend structure, volatility, and additional confirmation.
The important information is not simply that the market reached an extreme.
The more important question is:
Is the behavior of the indicator still consistent with the way price is extending?
That is the analytical question WilliamsR Double Divergence is designed to help investigate.
Mean Reversion Without Assuming Reversal
Williams %R naturally fits mean-reversion analysis because it evaluates price relative to its recent range.
However, mean reversion should not be confused with automatic reversal prediction.
An overextended market can remain overextended.
This is particularly important in strong trends, where counter-trend interpretations may be premature.
The PatternSmart Indicator Knowledge Base identifies range-bound markets, mean-reversion environments, swing trading, and counter-trend analysis as appropriate contexts for Williams %R Double Divergence, while also identifying strong sustained trends as a limitation requiring additional confirmation.
A disciplined Williams %R analysis therefore asks:
-
Is the market genuinely extended?
-
Is price approaching an important structural area?
-
Is Williams %R confirming the latest price extreme?
-
Is divergence developing?
-
What is the broader trend?
-
Is there supporting price action?
-
Does additional technical evidence support the interpretation?
This prevents an oscillator observation from being treated as a standalone decision.
Double Divergence: Confirmation Before Interpretation
The PatternSmart methodology is intentionally confirmation-based.
Traditional divergence identifies a difference between price and an indicator. Double Divergence builds on that concept by emphasizing context and disciplined interpretation.
Relevant confirmation can include:
-
Price action
-
Trend structure
-
Support and resistance
-
Volatility
-
Additional technical evidence
-
Broader market context
The methodology therefore separates the detection of a divergence from the interpretation of that divergence.
This distinction is especially important for Williams %R because its focus on market extremes can produce observations that have very different meanings in a range-bound market and a persistent directional trend.
The methodology does not attempt to maximize the number of signals. Analytical quality, confirmation, and consistency are more important than signal frequency.
WilliamsR Double Divergence Pro Features
WilliamsR Double Divergence Pro includes configurable controls designed to support different analytical workflows.
Rather than treating every setting as equally important, several features are particularly relevant to market-extreme and mean-reversion analysis.
Show Regular Bullish / Show Regular Bearish
These inputs control the visibility and calculation of Regular Divergence observations.
For Williams %R analysis, these signals are particularly relevant when studying situations where price establishes a new extreme but the indicator does not fully confirm the movement.
Traders focusing primarily on potential exhaustion and reversal conditions can use these controls to keep the relevant observations visible.
Show Hidden Bullish / Show Hidden Bearish
These inputs control Hidden Divergence observations.
Hidden Divergence can provide a different perspective by focusing on situations where price maintains a structural higher low or lower high despite a deeper oscillator movement.
This makes the feature useful when the analytical objective extends beyond mean reversion into evaluating whether a broader market structure remains intact.
Divergence Bar Range
Divergence Bar Range provides three structural choices:
-
ShortRange
-
MidRange
-
LongRange
These settings determine the structural scale used when examining divergence anchor points.
ShortRange focuses on tighter local structures, MidRange addresses intermediate swings, and LongRange focuses on broader structural peaks and troughs.
For Williams %R, this can be particularly relevant because a market extreme may have very different significance depending on whether it occurs within a short consolidation or a much broader market structure.
Divergence Lookback
Divergence Lookback controls the lookback window used when identifying local price extremes.
A shorter lookback can make the analysis more responsive to localized structures, while increasing the lookback requires more established swing structures before an extreme is accepted.
This creates an important analytical trade-off between responsiveness and structural selectivity.
Enhanced Mode
Enhanced Mode applies an additional structural slope filter to the divergence structure.
This provides an option for analysts who want a stricter structural interpretation of the relationship between the historical anchor points.
Because stricter filtering can reduce the number of observations, the setting represents a trade-off between filtering and signal frequency rather than a universally preferable configuration.
Wait 1 Bar
Wait 1 bar adds a confirmation condition before a divergence is finalized.
When enabled, the current execution bar must meet the specified directional condition before the divergence is plotted on the historical bar.
This introduces a one-bar confirmation delay and provides another way to balance immediacy with confirmation.
Enable Alert
Enable Alert activates event notification when a Double Divergence structure is confirmed at the close of a bar.
For traders monitoring several instruments or charts, alerts can make it easier to incorporate divergence observations into a broader analytical workflow.
Show Char and Show Line
Show Char controls the chart markers associated with divergence classifications.
Show Line controls the structural lines connecting the relevant price extremes and corresponding indicator values.
These visualization controls can make it easier to inspect the relationship between the price swing and Williams %R swing directly on the chart.
Only Show Last Signal Within Bars
Only Show Last Signal Within Bars is designed to manage repeated divergence observations and reduce unnecessary chart clutter.
This can be useful when analyzing markets where multiple observations occur close together and the analyst wants to maintain a cleaner visual workspace.
WilliamsR Double Divergence Pro for MultiCharts x.NET
MultiCharts x.NET provides an engineering-oriented environment that is particularly relevant to strategy developers, quantitative traders, and algorithm developers.
The platform knowledge base identifies MultiCharts .NET with:
-
C# development
-
Engineering-oriented workflows
-
Quantitative flexibility
-
Software extensibility
-
Strategy development
-
Structured analytical workflows
This makes the platform a natural environment for traders who want technical analysis to fit into a broader development or quantitative research process.
For WilliamsR Double Divergence Pro, the platform serves as the environment in which the Williams %R and Double Divergence analysis is applied.
The underlying methodology does not change because the platform changes. PatternSmart maintains the same divergence classifications, terminology, and confirmation philosophy across supported platforms.
A Structured Workflow for MultiCharts x.NET
A practical WilliamsR Double Divergence workflow can be organized into five stages.
1. Establish Market Context
Start with price.
Identify the current market structure, recent highs and lows, trend direction, and important support or resistance areas.
2. Examine Relative Price Positioning
Use Williams %R to evaluate where current price sits within its recent trading range.
The objective is to understand the market's relative positioning rather than simply labeling the oscillator as overbought or oversold.
3. Identify the Divergence Category
Determine whether the observation is:
-
Bullish Regular Divergence
-
Bearish Regular Divergence
-
Bullish Hidden Divergence
-
Bearish Hidden Divergence
4. Evaluate Confirmation
Consider price behavior, market structure, support and resistance, volatility, and other relevant technical evidence.
5. Form an Independent Interpretation
Use the complete analytical picture to determine how much significance the divergence deserves.
This approach follows the PatternSmart principle that divergence is information for analysis, not a guaranteed prediction.
Practical Benefits for Technical Analysts
WilliamsR Double Divergence Pro can support technical analysis by helping traders:
-
Examine price extremes from an additional perspective
-
Identify situations where Williams %R does not fully confirm price movement
-
Study potential mean-reversion conditions
-
Evaluate potential reversal development
-
Analyze Hidden Divergence within broader market structures
-
Organize divergence observations visually
-
Adjust structural sensitivity through configurable inputs
-
Monitor confirmed divergence events through alerts
-
Incorporate divergence analysis into systematic or quantitative workflows
The benefit is analytical rather than predictive.
WilliamsR Double Divergence Pro provides another source of technical evidence that can be evaluated alongside price action and broader market context.
Who Can Benefit From WilliamsR Double Divergence Pro?
The indicator is particularly relevant to traders and analysts interested in:
Mean-Reversion Analysis
Traders studying markets that regularly move between established ranges may use Williams %R to examine relative price positioning and potential extremes.
Swing Trading
Swing traders can use divergence analysis to study the relationship between significant price swings and Williams %R behavior.
Counter-Trend Analysis
For analysts evaluating potential exhaustion, Regular Divergence can provide an additional perspective when price reaches an important extreme.
Quantitative and Systematic Research
MultiCharts x.NET provides an environment suited to structured analysis, strategy development, and C#-based quantitative workflows.
The indicator can therefore fit into a broader analytical process rather than being limited to visual chart interpretation.
Frequently Asked Questions
What is WilliamsR Double Divergence Pro?
WilliamsR Double Divergence Pro is a PatternSmart technical analysis indicator that combines Williams %R with the Double Divergence methodology to analyze relative price positioning, market extremes, mean-reversion conditions, and potential reversal development.
What does Williams %R measure?
Williams %R evaluates where the current price is positioned relative to its recent trading range. Within Double Divergence analysis, this provides a perspective on market extremes and relative price positioning.
What is Williams %R divergence?
Williams %R divergence occurs when price and Williams %R develop different swing structures. For example, Bullish Regular Divergence occurs when price forms a lower low while Williams %R forms a higher low.
Does WilliamsR Double Divergence identify both Regular and Hidden Divergence?
Yes. The product supports Bullish Regular Divergence, Bearish Regular Divergence, Bullish Hidden Divergence, and Bearish Hidden Divergence.
Is WilliamsR Double Divergence designed for mean-reversion analysis?
Mean reversion is one of its primary analytical applications. The Indicator Knowledge Base identifies Williams %R as particularly relevant to market extremes, mean reversion, reversal potential, swing trading, and counter-trend analysis.
Is Williams %R effective in every market condition?
No indicator should be interpreted independently of market context. The source material specifically notes that Williams %R Double Divergence is less effective during strong sustained trends and requires additional confirmation.
What is the difference between Regular and Hidden Divergence?
Regular Divergence occurs when price establishes a new extreme while the indicator fails to confirm it. Hidden Divergence is generally associated with pullbacks and potential continuation within an established market structure.
What does Divergence Lookback control?
Divergence Lookback controls the window used to identify local extremes. Increasing the value requires more established swing structures before an extreme qualifies as an anchor point, while smaller values allow more localized structures to be considered.
What does Enhanced Mode do?
Enhanced Mode adds a structural slope filter to the divergence analysis. It can make the structural requirements more selective, with the trade-off of potentially reducing the number of observations.
Why use WilliamsR Double Divergence with MultiCharts x.NET?
MultiCharts x.NET is designed around C# development, quantitative flexibility, engineering, and software extensibility. This makes it suitable for traders and developers who want divergence analysis to fit into structured or systematic research workflows.
Does a Williams %R divergence guarantee a reversal?
No. PatternSmart explicitly treats divergence as analytical information rather than a guaranteed prediction. Additional confirmation and market context remain essential.
Conclusion
Markets often reach price extremes before their underlying behavior becomes easier to interpret.
Williams %R provides a useful perspective by examining relative price positioning within a recent trading range. When that perspective is combined with Double Divergence, analysts can examine whether price continues to receive confirmation from the indicator or whether a meaningful difference is developing.
WilliamsR Double Divergence Pro for MultiCharts x.NET brings this market-extreme analysis into an engineering-oriented environment suited to C#, quantitative research, systematic analysis, and software extensibility.
Its four divergence classifications—Bullish Regular Divergence, Bearish Regular Divergence, Bullish Hidden Divergence, and Bearish Hidden Divergence—provide a structured vocabulary for examining different forms of price and indicator disagreement.
The key is interpretation.
A market extreme is not automatically a reversal. A divergence is not automatically a trade. Instead, each observation should be evaluated against price structure, market context, and additional technical evidence.
That confirmation-first approach turns Williams %R divergence from a simple oscillator comparison into a more disciplined framework for studying market extremes, mean reversion, and potential reversal conditions.
Looking for the complete mathematical breakdown, step-by-step optimization guides, and advanced trading strategies? Explore our comprehensive documentation:
Visit the Technical Inputs Manual: Double Divergence Pro for full parameter tuning.
Read the master guide on the Double Divergence Indicator Series.
Write a review
Your Name:Your Review: Note: HTML is not translated!
Rating: Bad Good
Enter the code in the box below:


Latest

Welcome to Patternsmart
Converting your indicator from one platform to another.Custom Alert, Autotrader, Indicators, Scan, Screener, Strategy and Signals.
Copyright @ 2026 Patternsmart - All rights reserved
This website is for educational and informational
purposes only and should not be considered a solicitation to buy or sell a
futures contract or make any other type of investment decision. It's not recommended to use any single indicator as sole evaluation criteria. The companies
and services listed on this website are not to be considered a recommendation
and it is the reader's responsibility to evaluate any product, service, or
company. patternsmart is not responsible for the accuracy or content of any
product, service or company linked to on this website.
Futures trading
contains substantial risk and is not for every investor.Please read the following risk disclosure before considering the
trading of this product:
Futures Risk Disclosure. An investor could
potentially lose all or more than the initial investment. Risk capital is money
that can be lost without jeopardizing ones financial security or life style.
Only risk capital should be used for trading and only those with sufficient risk
capital should consider trading. Past performance is not necessarily indicative
of future results.
Trading stocks, options, futures and forex involves
speculation, and the risk of loss can be substantial.Investor must consider all
relevant risk factors, including their own personal financial situation, before
trading. Trading foreign exchange on margin carries a high level of risk, as
well as its own unique risk factors. Forex investments are subject to
counter-party risk, as there is no central clearing organization for these
transactions. Please read the following risk disclosure before considering the
trading of this product:
Forex Risk Disclosure. Spreads, Straddles, and other multiple-leg option
strategies can entail substantial transaction costs, including multiple
commissions, which may impact any potential return. Options are not suitable for
all investors as the special risks inherent to options trading may expose
investors to potentially rapid and substantial losses. Prior to trading options,
you should carefully read
Characteristics and Risks of Standardized Options.
patternsmart.com
will not be held liable for the loss of money or any damage caused from relying
on the information on this site. Any investment decision you make in your account is solely your responsibility.
TESTIMONIAL DISCLOSURE: TESTIMONIALS APPEARING ON OUR SITE MAY NOT BE REPRESENTATIVE OF THE EXPERIENCE OF OTHER CLIENTS OR CUSTOMERS AND IS NOT A GUARANTEE OF FUTURE PERFORMANCE OR SUCCESS.