
Your shopping cart is empty!
Shopping Cart
0 item(s) - FreeCustomization and Conversion for: Ctrader, MetaTrader(MT4, MT5), Thinkorswim, NinjaTrader, MultiCharts, Tradingview, Prorealtime, SierraChart, etc.
License renew price will be 20% off for the 2nd year and after.
Every Purchase Comes with a Coupon.
Share Your Experience. Help Other Traders Learn. Get Rewarded.
Share Your Experience. Help Other Traders Learn. Get Rewarded.
Featured





RSI Double Divergence Pro for MetaTrader 5 (MT5)


 (
(Precision Momentum Divergence Scanning for Professional Technical Traders
Mastering trend reversals and identifying high-confluence entry points requires tools that go beyond basic single-peak technical checks. The RSI Double Divergence Pro for MT5 is an advanced momentum tool engineered specifically for MetaTrader 5. By automating multi-swing Relative Strength Index (RSI) divergence scanning, this indicator helps technical analysts, swing traders, and intraday scalpers identify structural trend shifts and high-probability continuation patterns before price action unfolds.
Whether you trade major currency pairs, equity indices, commodities, or cryptocurrencies, RSI Double Divergence Pro delivers real-time notifications, clear on-chart visual overlays, and flexible settings built for rigorous multi-timeframe strategies.
Why Trade Divergences with RSI?
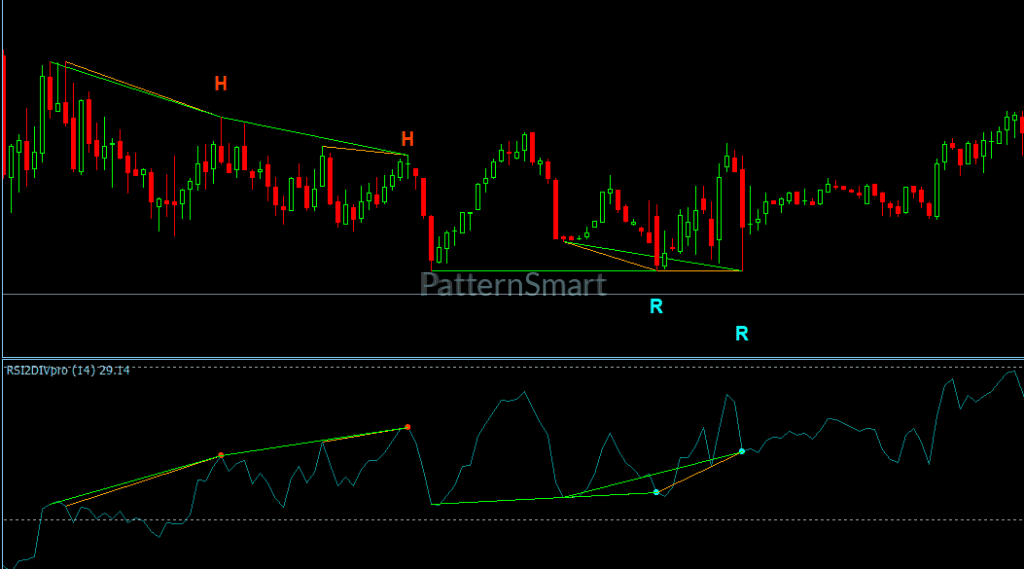
The Relative Strength Index measures the speed and change of price movements. When price behavior decouples from RSI momentum, it highlights an underlying shift in market strength that price alone has not yet made obvious.
-
Regular Divergence: Occurs when price pushes to new structural highs or lows, but momentum fails to validate the move. This divergence signals momentum exhaustion and precedes sharp market reversals.
-
Hidden Divergence: Occurs when price completes a temporary pullback while momentum reaches a deeper peak or trough. This signals strong underlying trend health and provides optimal entries in line with the dominant trend.
Standard indicators only compare isolated adjacent swing points, often missing broader structural context or producing false signals during volatile market conditions. RSI Double Divergence Pro evaluates multi-swing structural patterns across customizable swing lookback ranges, significantly improving signal reliability and filtering out chart noise.
Core Features & Technical Capabilities
1. Four Independent Signal Classifications
Maintain total control over your trading view with independent toggles for four distinct divergence conditions:
-
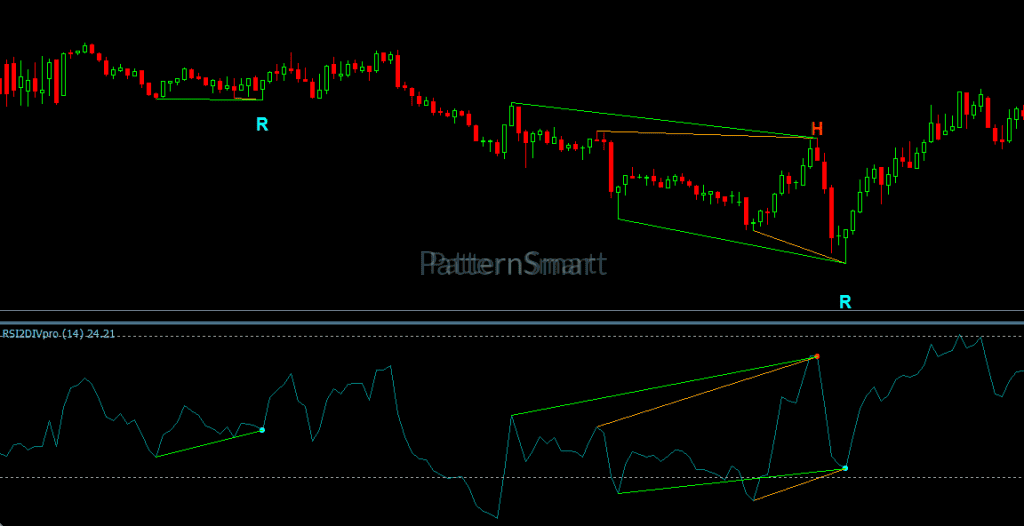
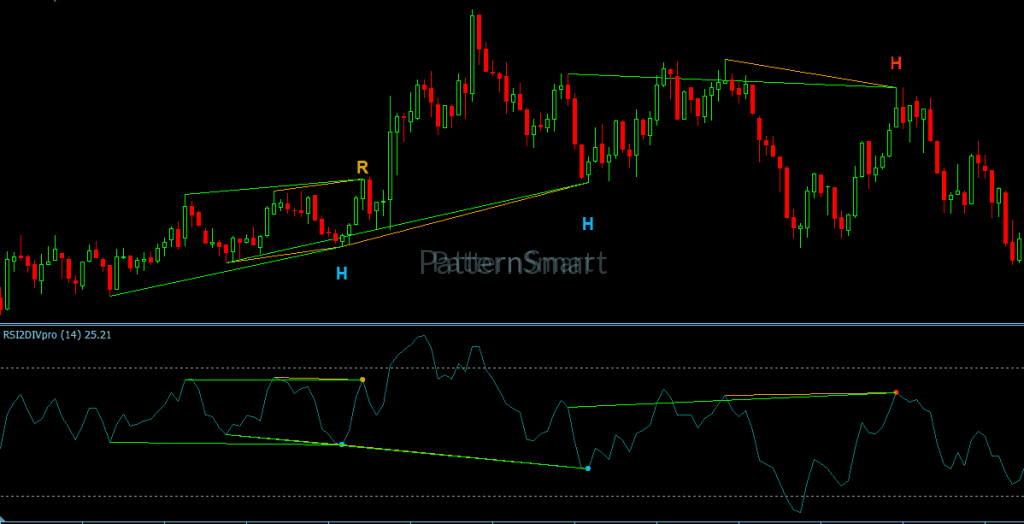
Regular Bullish Signal (Aqua): Pinpoints classical market bottoms where price forms lower lows while RSI forms higher lows, signaling an impending upward reversal.
-
Hidden Bullish Signal (Deep Sky Blue): Identifies low-risk buy opportunities during pullbacks in an ongoing uptrend when price holds higher lows while RSI drops.
-
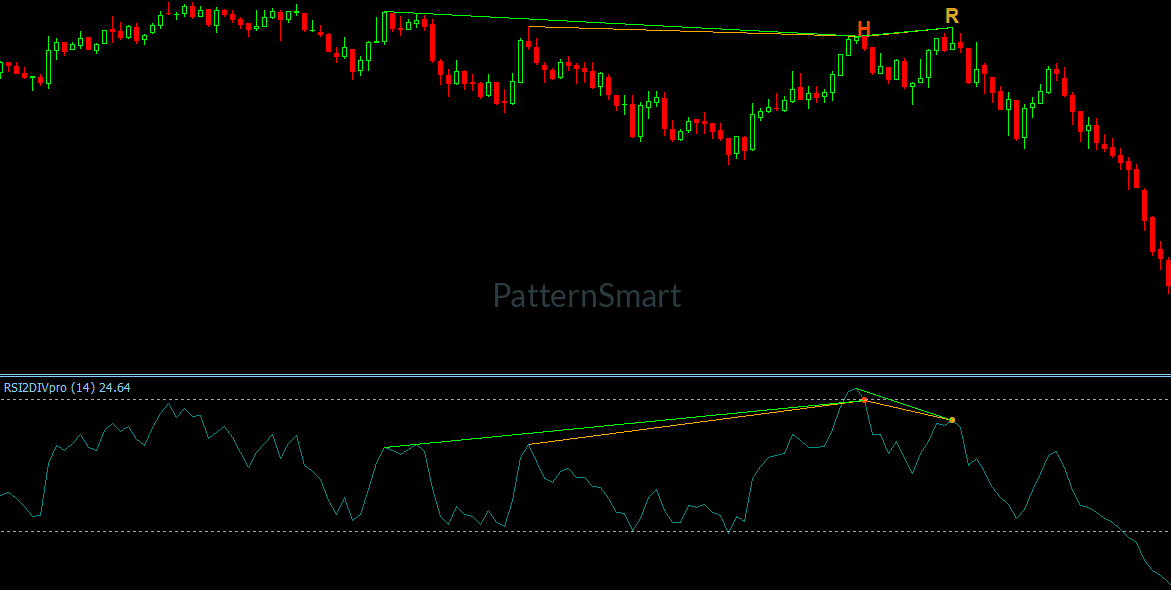
Regular Bearish Signal (Goldenrod): Highlights market tops where price achieves higher highs while RSI forms lower highs, warning of an impending downward reversal.
-
Hidden Bearish Signal (Orange-Red): Identifies high-probability short-selling entries during temporary retracements in an ongoing downtrend.
2. Multi-Range Swing Horizon Scanning
Adapt the indicator's swing-detection sensitivity to your specific timeframe and strategy demands:
-
Divergence Bar Ranges: Choose between
ShortRange(2 to 7 bar swing horizons),MidRange(8 to 13 bar swing horizons), orLongRange(14 to 19 bar swing horizons). -
Divergence Lookback & Filter Settings: Adjust momentum scanning windows and apply internal moving average filters to ensure signals match your exact liquidity and volatility parameters.
-
Enhanced Filter Mode: Toggle an extra structural validation check (
Enhanced = true) to enforce strict geometric peak and trough comparisons across consecutive swings, helping eliminate ambiguous signals in sideways markets.
3. Non-Repainting Bar Confirmation (Wait1 Mode)
Avoid false signals caused by incomplete candle formations. When
Wait1 is enabled, the indicator requires bar closure and bullish or bearish candle validation before drawing signals or triggering alerts. Once placed on your chart, historical signals remain completely fixed.4. Dynamic Visual Scaling & Workspace Management
-
ATR-Based Visual Spacing: On-chart text and signal markers use Average True Range (ATR) calculations for precise vertical positioning, preventing text overlap across different chart scales and price swings.
-
Signal Window Capping: Manage clutter using the
OnlyShowLastSignalWithinBarsparameter, which automatically hides historical signal drawings once they exceed a set bar count.
Visual Presentation & Interactive Chart Overlays
RSI Double Divergence Pro translates complex calculations into clean visual overlays across both chart windows:
-
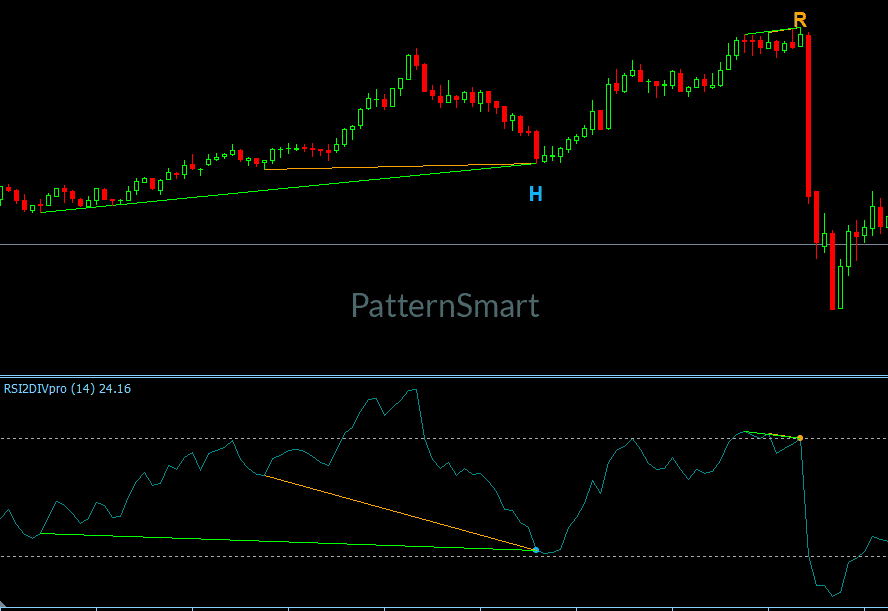
Automated Structural Trendlines: The indicator draws precise connecting lines between price swings on your primary chart while plotting corresponding momentum trendlines in the RSI sub-window.
-
Custom Character Labels or Arrow Icons: Choose between intuitive text identifiers (
Rfor Regular,Hfor Hidden) or standard directional arrow markers (ShowChar). -
Complete Color Customization: Assign unique colors, styles, and widths to trendlines and signal markers to complement dark or light chart themes.
Instant Real-Time Alert System
Stay informed about market developments without spending hours glued to your screen:
-
MT5 Pop-Up Alert Boxes: Receive instant pop-up windows and sound alerts on your MetaTrader 5 platform the moment a bar closes with a confirmed signal.
-
Terminal Logs: Automatically log detailed signal data—including symbol, timeframe, setup type, and precise timestamp—directly in your MT5 Experts log for historical review.
Input Parameters Reference
Easily configure the indicator using its comprehensive parameters:
| Input Parameter | Data Type | Default Value | Description |
| Wait1 | Boolean | true |
Requires bar closure and confirmation before plotting signals. |
| ShowRegularBullish | Boolean | true |
Enables or disables Regular Bullish setup tracking. |
| ShowHiddenBullish | Boolean | true |
Enables or disables Hidden Bullish setup tracking. |
| ShowRegularBearish | Boolean | true |
Enables or disables Regular Bearish setup tracking. |
| ShowHiddenBearish | Boolean | true |
Enables or disables Hidden Bearish setup tracking. |
| Enhanced | Boolean | false |
Enables strict multi-swing geometric filter checks. |
| EnableAlert | Boolean | true |
Master toggle for platform alerts and terminal logging. |
| ShowChar | Boolean | true |
Displays text tags (R/H); sets to arrows when false. |
| ShowLine | Boolean | true |
Draws connecting trendlines on price chart & sub-window. |
| OnlyShowLastSignalWithinBars | Integer | 10 |
Limits maximum visible historical signals on the chart. |
| PriceLine1Color | Color | clrOrange |
Primary connecting trendline color. |
| PriceLine2Color | Color | clrLime |
Secondary connecting trendline color. |
| PriceLineStyle | Line Style | STYLE_SOLID |
On-chart trendline drawing style. |
| PriceLineWidth | Integer | 1 |
Plotted trendline thickness setting. |
| ShowAlertMessageBox | Boolean | true |
Toggles MT5 pop-up alert dialog boxes. |
| RsiPeriod | Integer | 14 |
Calculation period for underlying RSI line. |
| RsiPrice | Price Enum | PRICE_CLOSE |
Applied price source (Close, Open, High, Low, etc.). |
| DivergenceBarRange | Enum | ShortRange |
Swing horizon mode (ShortRange, MidRange, LongRange). |
| DivergenceLookback | Integer | 5 |
Historical lookback window for momentum extrema. |
| FilterLength | Integer | 5 |
Moving average filter length for internal value smoothing. |
| ObjectPrefix | String | "RSI2DIVpro" |
Unique graphic prefix to prevent object name conflicts. |
Looking for the complete mathematical breakdown, step-by-step optimization guides, and advanced trading strategies? Explore our comprehensive documentation:
Visit the Technical Inputs Manual: Double Divergence Pro for full parameter tuning.
Read the master guide on the Double Divergence Indicator Series.
Who Benefits Most from RSI Double Divergence Pro?
-
Forex Traders: Catch trend exhaustion points and continuation setups across major, minor, and exotic currency pairs.
-
Index & Equity Traders: Spot institutional divergence setups on major global indices like the NASDAQ 100, S&P 500, and FTSE 100.
-
Crypto & Commodity Traders: Trade volatile instruments like Bitcoin, Ethereum, Crude Oil, and Gold with objective, volume-agnostic momentum signals.
-
Multi-Timeframe Analysts: Combine higher-timeframe hidden divergence signals with lower-timeframe regular divergence entries for high-confluence trade execution.
Installation & Setup Instructions
-
Download & Save: Save the indicator file into your MetaTrader 5 directory under
MQL5/Indicators. -
Attach to Chart: Open MetaTrader 5, locate RSI Double Divergence Pro in your Navigator window, and drag it onto your chart.
-
Configure Inputs: Set your preferred
RsiPeriod, select your idealDivergenceBarRangebased on your trading style, and configure alert preferences. -
Execute with Precision: Combine clear divergence signals with your core technical framework to trade with greater clarity and discipline
Write a review
Your Name:Your Review: Note: HTML is not translated!
Rating: Bad Good
Enter the code in the box below:


Latest

Welcome to Patternsmart
Converting your indicator from one platform to another.Custom Alert, Autotrader, Indicators, Scan, Screener, Strategy and Signals.
Copyright @ 2026 Patternsmart - All rights reserved
This website is for educational and informational
purposes only and should not be considered a solicitation to buy or sell a
futures contract or make any other type of investment decision. It's not recommended to use any single indicator as sole evaluation criteria. The companies
and services listed on this website are not to be considered a recommendation
and it is the reader's responsibility to evaluate any product, service, or
company. patternsmart is not responsible for the accuracy or content of any
product, service or company linked to on this website.
Futures trading
contains substantial risk and is not for every investor.Please read the following risk disclosure before considering the
trading of this product:
Futures Risk Disclosure. An investor could
potentially lose all or more than the initial investment. Risk capital is money
that can be lost without jeopardizing ones financial security or life style.
Only risk capital should be used for trading and only those with sufficient risk
capital should consider trading. Past performance is not necessarily indicative
of future results.
Trading stocks, options, futures and forex involves
speculation, and the risk of loss can be substantial.Investor must consider all
relevant risk factors, including their own personal financial situation, before
trading. Trading foreign exchange on margin carries a high level of risk, as
well as its own unique risk factors. Forex investments are subject to
counter-party risk, as there is no central clearing organization for these
transactions. Please read the following risk disclosure before considering the
trading of this product:
Forex Risk Disclosure. Spreads, Straddles, and other multiple-leg option
strategies can entail substantial transaction costs, including multiple
commissions, which may impact any potential return. Options are not suitable for
all investors as the special risks inherent to options trading may expose
investors to potentially rapid and substantial losses. Prior to trading options,
you should carefully read
Characteristics and Risks of Standardized Options.
patternsmart.com
will not be held liable for the loss of money or any damage caused from relying
on the information on this site. Any investment decision you make in your account is solely your responsibility.
TESTIMONIAL DISCLOSURE: TESTIMONIALS APPEARING ON OUR SITE MAY NOT BE REPRESENTATIVE OF THE EXPERIENCE OF OTHER CLIENTS OR CUSTOMERS AND IS NOT A GUARANTEE OF FUTURE PERFORMANCE OR SUCCESS.