
Your shopping cart is empty!
Shopping Cart
0 item(s) - FreeCustomization and Conversion for: Ctrader, MetaTrader(MT4, MT5), Thinkorswim, NinjaTrader, MultiCharts, Tradingview, Prorealtime, SierraChart, etc.
License renew price will be 20% off for the 2nd year and after.
Every Purchase Comes with a Coupon.
Share Your Experience. Help Other Traders Learn. Get Rewarded.
Share Your Experience. Help Other Traders Learn. Get Rewarded.
Featured





Stochastics Double Divergence Pro for MetaTrader 5


 (
(Professional Divergence Detection for Modern Traders
Identifying momentum shifts before price confirms a move is one of the most effective strategies for capturing high-reward trading opportunities. The Stochastics Double Divergence Pro for MetaTrader 5 (MT5) elevates traditional divergence trading by evaluating price action across dual swing points, enabling traders to identify high-probability reversal and trend continuation setups across any financial market.
By integrating multi-range swing point analysis, advanced smoothing filters, and clear visual representations directly on MetaTrader 5 charts, this tool eliminates manual guesswork. Whether trading Forex currency pairs, stock indices, commodities, or cryptocurrencies, Stochastics Double Divergence Pro equips technical traders with actionable insights and systematic trade signals.
What is Stochastics Double Divergence?
Standard divergence occurs when price movement disagrees with a momentum oscillator like the Stochastic Indicator. A single divergence often signals potential momentum loss, but false breakouts can occur during strong market trends.
Double Divergence strengthens analysis by assessing momentum relationships across consecutive market swings. By evaluating two sequential swing points rather than just one, the indicator filters out noise and isolates significant market turning points.
Signal Types Captured
-
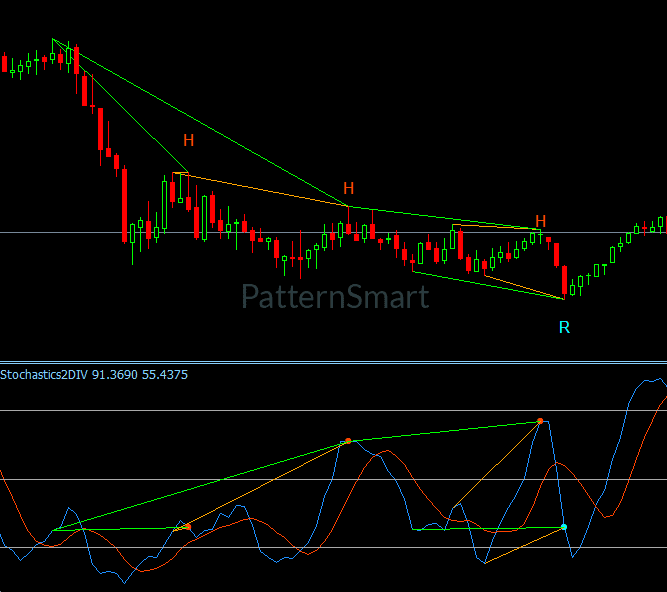
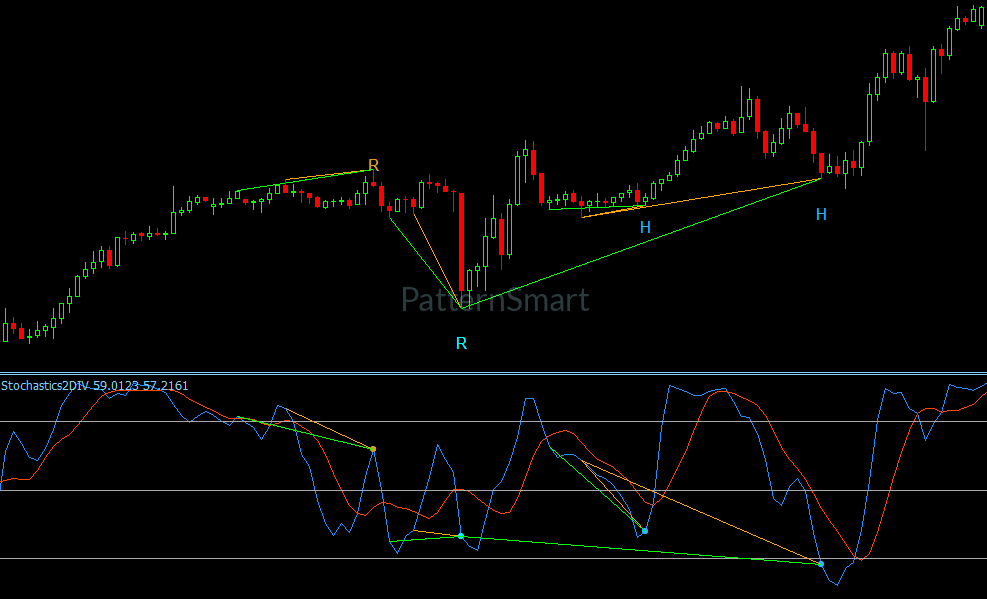
Regular Bullish Divergence: Price creates equal or lower lows while momentum forms higher lows, signaling a potential bullish reversal from an oversold condition.
-
Hidden Bullish Divergence: Price forms higher lows while momentum makes lower lows, signaling a potential upward continuation within an established uptrend.
-
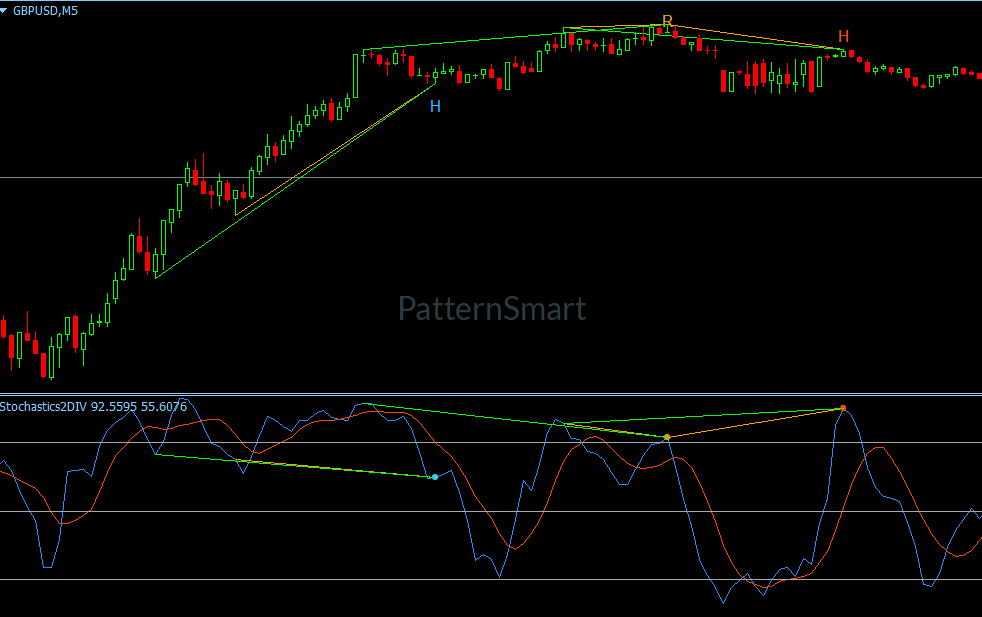
Regular Bearish Divergence: Price reaches higher highs while momentum displays lower highs, indicating weakening buying pressure and a potential bearish reversal.
-
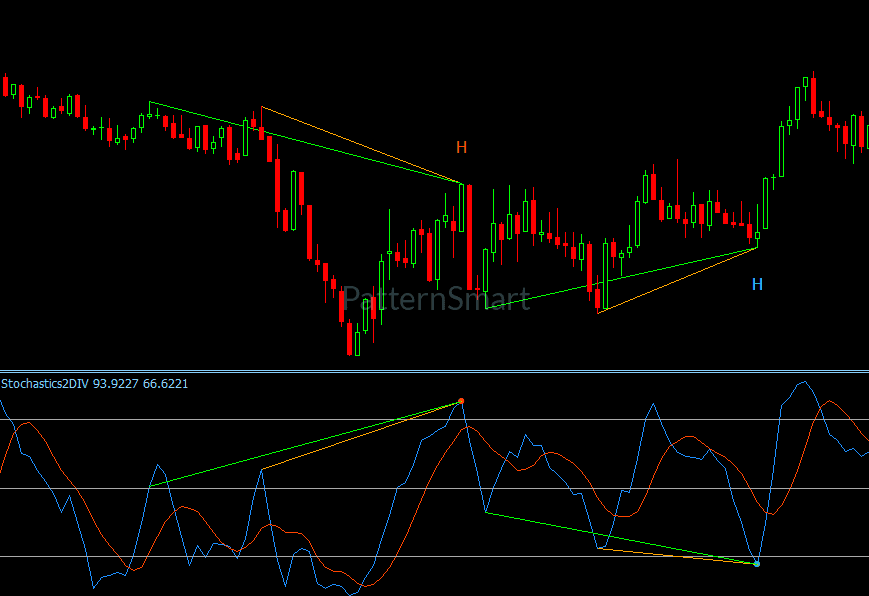
Hidden Bearish Divergence: Price forms lower highs while momentum makes higher highs, indicating trend continuation to the downside.
Core Features and Technical Highlights
1. Dual-Swing Divergence Verification
Rather than relying on isolated momentum peaks or troughs, the indicator tracks consecutive swing highs and lows. This structural validation ensures signals reflect sustained momentum divergence rather than brief price fluctuations.
2. Multi-Range Flexibility
Market structure varies across different assets and timeframes. Stochastics Double Divergence Pro includes configurable swing range options to adapt to various market conditions:
-
Short Range: Captures swift swing points (2 to 7 bars) ideal for fast-paced scalping and intraday trading.
-
Mid Range: Focuses on intermediate swing structures (8 to 13 bars) suited for day trading and swing trading.
-
Long Range: Filters macro swing points (14 to 19 bars) to highlight structural reversals on higher timeframes.
3. Customizable Oscillators & Line Selection
Traders can calculate divergence metrics using either the %K line or the %D line of the Stochastic oscillator. Standard parameters—including %K Period, %D Period, and Slowing—remain fully customizable, alongside technical moving average methods and price fields (Low/High or Close/Close).
4. Dynamic Visual Tracking & Plotting
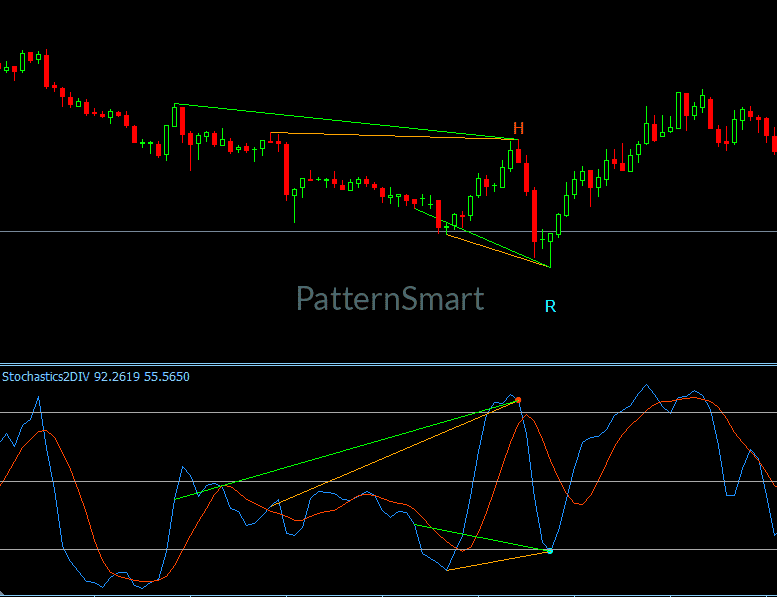
To ensure total visual clarity, the tool draws direct connection lines between relevant price peaks/troughs on the main chart, matched with corresponding oscillator lines in the indicator subwindow. Signals are displayed as clean chart annotations ("R" for Regular, "H" for Hidden) or custom directional arrows.
5. Volatility-Based Spacing
The indicator incorporates Average True Range (ATR) calculations to dynamic adjust label and arrow positioning relative to price bars. This ensures visual cues remain clearly readable during periods of high volatility or consolidation.
6. Signal Density Control
To prevent chart clutter, users can limit signal displays using the built-in signal lifespan feature. The indicator automatically prunes older visual elements and isolates recent setups within a user-defined bar count.
7. Confirmation & Enhanced Filtering Options
Traders can enable bar confirmation rules to ensure a candle closes in the direction of the divergence prior to signal generation. An optional Enhanced Filter Mode adds strict structural criteria to validate relative swing heights and depths, reducing false positives in choppy markets.
Technical Specifications & Parameters
The table below provides a complete overview of configurable input parameters available within the indicator settings interface:
| Parameter Category | Input Name | Default Value | Description |
| Signal Toggles | ShowRegularBullish |
true |
Toggles detection and display of Regular Bullish signals. |
ShowHiddenBullish |
true |
Toggles detection and display of Hidden Bullish signals. | |
ShowRegularBearish |
true |
Toggles detection and display of Regular Bearish signals. | |
ShowHiddenBearish |
true |
Toggles detection and display of Hidden Bearish signals. | |
| Filtering & Setup | Wait1 |
true |
Requires current bar completion to confirm price action direction. |
Enhanced |
true / false |
Enables strict double-swing structural validation filters. | |
FilterLength |
5 |
Smoothing length for stochastic comparison moving averages. | |
DivergenceBarRange |
ShortRange |
Sets swing point search range (ShortRange, MidRange, LongRange). |
|
DivergenceLookback |
5 |
Defines lookback window for stochastic extreme evaluations. | |
| Stochastic Settings | KPeriod |
14 |
Sets the %K calculation period. |
DPeriod |
3 |
Sets the %D calculation period. | |
Slowing |
3 |
Sets the stochastic slowing factor. | |
StochMaMethod |
MODE_SMA |
Moving average calculation method (SMA, EMA, SMMA, LWMA). |
|
StochPriceField |
STO_LOWHIGH |
Price input field (Low/High or Close/Close). |
|
DivValueMode |
StochK |
Selects source line for divergence calculation (StochK or StochD). |
|
| Visual Customization | ShowChar |
true |
Toggles letter labels ("R"/"H") vs. arrow markers. |
ShowLine |
true |
Draws connecting trendlines on price chart and indicator subwindow. | |
PriceLine1Color |
Orange |
Primary connecting line color. | |
PriceLine2Color |
Lime |
Secondary connecting line color. | |
OnlyShowLastSignalWithinBars |
10 |
Restricts visual markers to a rolling window of recent bars. | |
| Alerts | EnableAlert |
true |
Enables active signal alerts. |
ShowAlertMessageBox |
true |
Triggers pop-up message alerts inside MT5. |
Looking for the complete mathematical breakdown, step-by-step optimization guides, and advanced trading strategies? Explore our comprehensive documentation:
Visit the Technical Inputs Manual: Double Divergence Pro for full parameter tuning.
Read the master guide on the Double Divergence Indicator Series.
Tactical Trading Applications
Scenario A: Bullish Trend Reversal at Key Support
-
Price declines toward a major support level or daily demand zone.
-
The indicator detects price forming consecutive lower lows while the Stochastic oscillator records higher lows.
-
A Regular Bullish Signal ("R") forms as the candle closes bullishly.
-
Execution: Trader enters a long position at the open of the next candle, placing a stop-loss below the recent swing low and targeting a risk-to-reward ratio of 1:2 or higher.
Scenario B: Trend Continuation during a Bearish Pullback
-
A currency pair displays a strong overall downtrend on the H4 timeframe.
-
During an upward intraday retracement on the H1 timeframe, price forms lower highs relative to a previous swing high, while the Stochastic oscillator pushes to higher highs.
-
A Hidden Bearish Signal ("H") is printed.
-
Execution: The signal confirms that buying momentum is fading despite the temporary price retracement. Trader executes a short position in alignment with the broader macro trend.
Installation & Setup Instructions
-
Download the file (
Stochastics Double Divergence Pro.mq5or compiled.ex5). -
Open MetaTrader 5. Navigate to File > Open Data Folder.
-
Open the MQL5 directory and navigate to the Indicators subfolder.
-
Copy the indicator file into the Indicators folder.
-
Restart MetaTrader 5 or right-click Indicators in the Navigator panel and select Refresh.
-
Drag Stochastics Double Divergence Pro onto your desired chart.
-
Configure your parameters in the Inputs tab and click OK.
Upgrade Your MT5 Charting Capabilities
The Stochastics Double Divergence Pro for MT5 delivers complete clarity to momentum analysis. By combining multi-range swing detection, hidden and regular divergence tracking, flexible stochastic modes, and configurable chart alerts, this professional tool provides the structural edge required in modern trading.
Add Stochastics Double Divergence Pro to your MetaTrader 5 platform today to capture systematic reversal and continuation signals with precision.
Write a review
Your Name:Your Review: Note: HTML is not translated!
Rating: Bad Good
Enter the code in the box below:


Latest

Welcome to Patternsmart
Converting your indicator from one platform to another.Custom Alert, Autotrader, Indicators, Scan, Screener, Strategy and Signals.
Copyright @ 2026 Patternsmart - All rights reserved
This website is for educational and informational
purposes only and should not be considered a solicitation to buy or sell a
futures contract or make any other type of investment decision. It's not recommended to use any single indicator as sole evaluation criteria. The companies
and services listed on this website are not to be considered a recommendation
and it is the reader's responsibility to evaluate any product, service, or
company. patternsmart is not responsible for the accuracy or content of any
product, service or company linked to on this website.
Futures trading
contains substantial risk and is not for every investor.Please read the following risk disclosure before considering the
trading of this product:
Futures Risk Disclosure. An investor could
potentially lose all or more than the initial investment. Risk capital is money
that can be lost without jeopardizing ones financial security or life style.
Only risk capital should be used for trading and only those with sufficient risk
capital should consider trading. Past performance is not necessarily indicative
of future results.
Trading stocks, options, futures and forex involves
speculation, and the risk of loss can be substantial.Investor must consider all
relevant risk factors, including their own personal financial situation, before
trading. Trading foreign exchange on margin carries a high level of risk, as
well as its own unique risk factors. Forex investments are subject to
counter-party risk, as there is no central clearing organization for these
transactions. Please read the following risk disclosure before considering the
trading of this product:
Forex Risk Disclosure. Spreads, Straddles, and other multiple-leg option
strategies can entail substantial transaction costs, including multiple
commissions, which may impact any potential return. Options are not suitable for
all investors as the special risks inherent to options trading may expose
investors to potentially rapid and substantial losses. Prior to trading options,
you should carefully read
Characteristics and Risks of Standardized Options.
patternsmart.com
will not be held liable for the loss of money or any damage caused from relying
on the information on this site. Any investment decision you make in your account is solely your responsibility.
TESTIMONIAL DISCLOSURE: TESTIMONIALS APPEARING ON OUR SITE MAY NOT BE REPRESENTATIVE OF THE EXPERIENCE OF OTHER CLIENTS OR CUSTOMERS AND IS NOT A GUARANTEE OF FUTURE PERFORMANCE OR SUCCESS.