
Your shopping cart is empty!
Shopping Cart
0 item(s) - FreeCustomization and Conversion for: Ctrader, MetaTrader(MT4, MT5), Thinkorswim, NinjaTrader, MultiCharts, Tradingview, Prorealtime, SierraChart, etc.
License renew price will be 20% off for the 2nd year and after.
Every Purchase Comes with a Coupon.
Share Your Experience. Help Other Traders Learn. Get Rewarded.
Share Your Experience. Help Other Traders Learn. Get Rewarded.
Featured




ADX Double Divergence Pro for ProRealTime


 (
(Evaluating Trend Quality Through Multi-Dimensional Analysis
Evaluating the true strength of an existing market trend presents an ongoing challenge for technical analysts. While price action alone shows direction, it frequently obscures declining trend quality or weakening conviction beneath the surface. A market may continue reaching higher highs or lower lows while the underlying participation and momentum begin to deteriorate, often creating unexpected corrections or false breakout scenarios.
Understanding trend quality requires moving beyond basic direction and evaluating whether directional movement continues to receive solid technical confirmation. The ADX Double Divergence Pro indicator for ProRealTime addresses this analytical requirement by applying PatternSmart’s confirmation-first methodology to trend strength evaluation, helping traders distinguish between robust trend continuation and developing structural exhaustion.
Understanding Trend Strength and Divergence Analysis
To analyze trend sustainability effectively, technical analysis distinguishes between trend direction and trend strength:
-
Trend Direction: Identifies the visible path of price action (upward, downward, or lateral).
-
Trend Strength: Measures the degree of directional conviction and structural stability behind that price movement.
The Average Directional Index (ADX) evaluates trend strength regardless of direction. Under normal, healthy market conditions, a strong directional price move is accompanied by rising ADX values, confirming that the trend possesses underlying conviction.
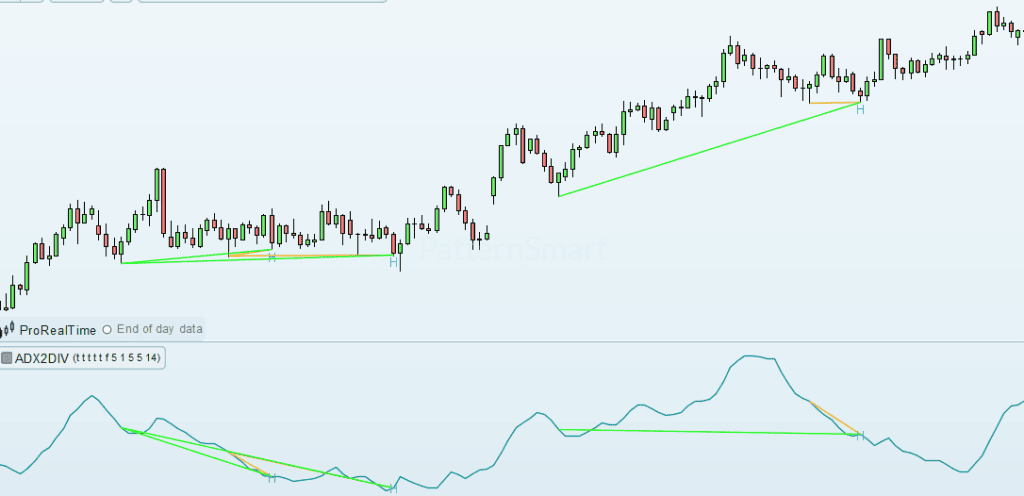
When price continues establishing new extremes while ADX fails to achieve corresponding highs, a divergence develops. This divergence indicates that while price action continues in its original direction, the underlying trend strength is eroding—providing valuable analytical evidence that market conditions deserve closer evaluation.
The Double Divergence Methodology on ADX
Traditional divergence analysis often compares price action against a single indicator peak. The PatternSmart Double Divergence methodology extends this traditional concept into a more structured, confirmation-based analytical framework.
Rather than treating every isolated indicator deviation as an immediate reversal signal, Double Divergence evaluates structural consistency across multiple anchor points. It provides two distinct signal classifications:
1. Regular Divergence
-
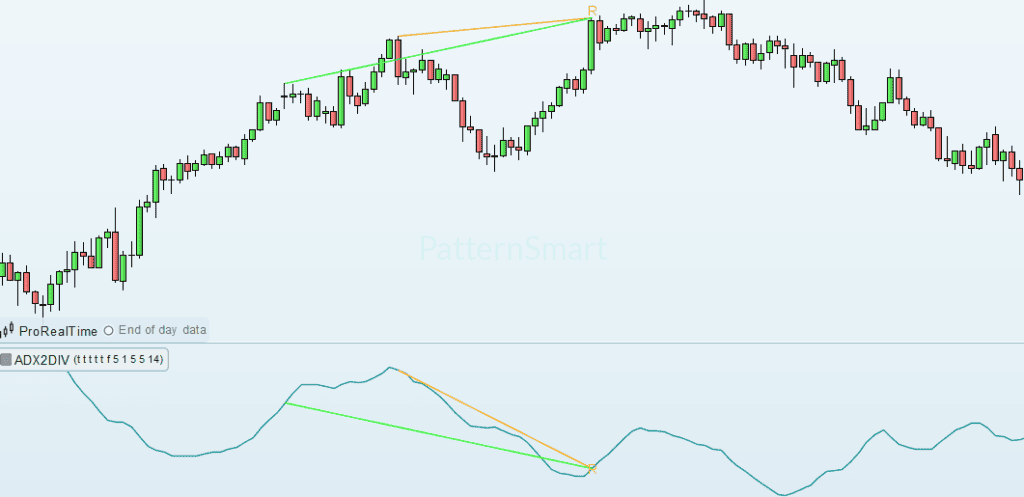
Bullish Regular Divergence: Price forms a lower low while ADX forms a higher low, suggesting declining downward trend strength.
-
Bearish Regular Divergence: Price forms a higher high while ADX forms a lower high, indicating weakening upward trend quality despite advancing price action.
2. Hidden Divergence
-
Bullish Hidden Divergence: Price forms a higher low while ADX forms a lower low during a pullback, providing evidence that the broader bullish trend structure remains intact.
-
Bearish Hidden Divergence: Price forms a lower high while ADX forms a higher high during a temporary retracement, suggesting underlying bearish trend continuation potential.
Regular Bearish Divergence (Trend Weakening):
Price:     [High] --------> [Higher High]
ADX:       [High] --------> [Lower High]   --> Weakening Trend Conviction

Hidden Bullish Divergence (Trend Continuation):
Price:     [Low] ---------> [Higher Low]
ADX:       [Low] ---------> [Lower Low]    --> Underlying Trend Support
By framing these observations within a probabilistic model, Double Divergence acts as an analytical filter, encouraging traders to seek secondary technical confirmation—such as support/resistance levels or candlestick patterns—before forming conclusions.
ProRealTime Architecture & Subchart Configuration
ProRealTime provides a refined, high-precision charting environment favored by professional technical analysts across European and global markets. Its visual clarity and charting engine allow for clean, unencumbered market studies.
Important Technical Note on ProRealTime Architecture:Due to platform limitations within ProRealTime regarding how graphical elements and multi-pane indicators interact, ADX Double Divergence Pro for ProRealTime is delivered as two separate, synchronized indicators:
Show Char) directly over price bars.
Core Indicator Features & Parameters
ADX Double Divergence Pro includes a suite of configurable features defined in the official inputs manual to help tailor structural detection to your charting workflow.
+-----------------------------------------------------------------------+
|                 ADX DOUBLE DIVERGENCE PRO WORKFLOW                     |
+-----------------------------------------------------------------------+
|  [Market Price Data]  --->  [ADX Calculation Engine]                  |
|                                     |                                 |
|                                     v                                 |
|                         [Advanced Parameters]                         |
|                         * Divergence Lookback (5)                     |
|                         * Filter Length (5)                           |
|                         * Divergence Bar Range                        |
|                                     |                                 |
|                                     v                                 |
|                         [Signal Generation & Filtering]               |
|                         * Show Regular / Hidden                       |
|                         * Wait 1 Bar (Confirmation)                   |
|                         * Enhanced Mode (Structural Filtering)        |
|                                     |                                 |
|                                     v                                 |
|                         [Confirmed Divergence Signal]                 |
|                                     |                                 |
|            +------------------------+------------------------+        |
|            |                                                 |        |
|            v                                                 v        |
|   [ProRealTime Main Chart Pane]                 [ProRealTime Subchart Pane]   |
|   * Signal Labels (Show Char)                   * ADX Oscillation Line        |
|   * Price Trendlines (Show Line)                * Indicator Divergence Lines   |
+-----------------------------------------------------------------------+
Signal Generation & Filtering Features
-
Wait 1 Bar: Requires one completed confirmation bar before finalizing a divergence signal, significantly reducing premature signals during rapid price updates.
-
Enhanced Mode: Applies an additional layer of structural validation before confirming a signal, evaluating geometric relationships between historical anchor points to filter out noise.
-
Signal Category Options: Individual toggles (
Show Regular Bullish,Show Regular Bearish,Show Hidden Bullish,Show Hidden Bearish) allow users to focus strictly on specific divergence categories.
Advanced Analytical Parameters
-
Divergence Lookback (Default: 5): Controls the number of historical bars evaluated when identifying local swing highs and swing lows.
-
Filter Length (Default: 5): Determines the internal smoothing period applied during structural evaluation.
-
Divergence Bar Range (Default: ShortRange): Sets the structural search boundaries (
ShortRange,MidRange,LongRange), controlling how far apart historical swing points can be while qualifying as a valid structure.
Visualization & Notification Features
-
Show Char & Show Line: Controls the visibility of text character labels and drawing trendlines across price swings and indicator panes.
-
Only Show Last Signal Within Bars (Default: 10): Automatically manages historical graphical objects to reduce chart clutter by removing older nearby signals.
-
Enable Alert & Alert Sound: Triggers native platform audio alerts (
Alert1.wav) as soon as a qualifying divergence signal is finalized.
Practical Analytical Benefits
Integrating ADX Double Divergence Pro into your ProRealTime workflow delivers several analytical advantages:
-
Objective Trend Quality Assessment: Moves beyond subjective evaluation by measuring ADX structural conviction against price extremes.
-
Confirmation-First Analysis: Reduces impulsive entries by requiring structural validation and bar completion before confirming signals.
-
Improved Chart Organization: Features like
Only Show Last Signal Within Barsmanage visual density, keeping your workspace clean. -
Dual-Pane Visualization: Utilizing distinct main chart and subchart indicators within ProRealTime ensures clarity without cluttering your primary price action view.
-
Flexible Market Application: Functions consistently across Forex, stocks, indices, commodities, and futures markets on any chart timeframe.
Frequently Asked Questions
Why does ADX Double Divergence Pro for ProRealTime use two separate indicators?
Due to platform architectural requirements in ProRealTime, drawing price trendlines on the primary price pane and indicator trendlines in a separate pane requires two dedicated indicator components. Applying both the main chart and subchart indicators ensures full visual presentation across both panes while keeping calculation logic synchronized.
Does ADX divergence predict immediate price reversals?
No. ADX measures trend strength rather than trend direction. A divergence indicates that trend strength is changing relative to price, serving as technical evidence that a trend may be exhausting or consolidating, rather than a guaranteed reversal prediction.
What is the difference between "Wait 1 Bar" and "Enhanced Mode"?
Wait 1 Bar controls confirmation timing by waiting for a bar to close before finalizing a signal. Enhanced Mode controls confirmation quality by applying additional structural validation to historical swing points before accepting the divergence structure.Can I adjust the sensitivity for intraday charts?
Yes. Adjusting advanced parameters such as
Divergence Lookback, Filter Length, and modifying Divergence Bar Range from ShortRange to MidRange allows you to customize structural detection to faster intraday bar intervals.Conclusion
The ADX Double Divergence Pro indicator for ProRealTime brings structured, confirmation-based trend strength analysis to professional charting workflows. By combining the unique trend-measuring capabilities of ADX with PatternSmart's multi-layered divergence framework, traders can evaluate market structure with greater clarity and discipline.
To enhance your chart analysis and evaluate trend quality across your preferred markets, explore how ADX Double Divergence Pro for ProRealTime integrates into your analytical process.
Write a review
Your Name:Your Review: Note: HTML is not translated!
Rating: Bad Good
Enter the code in the box below:


Latest

Welcome to Patternsmart
Converting your indicator from one platform to another.Custom Alert, Autotrader, Indicators, Scan, Screener, Strategy and Signals.
Copyright @ 2026 Patternsmart - All rights reserved
This website is for educational and informational
purposes only and should not be considered a solicitation to buy or sell a
futures contract or make any other type of investment decision. It's not recommended to use any single indicator as sole evaluation criteria. The companies
and services listed on this website are not to be considered a recommendation
and it is the reader's responsibility to evaluate any product, service, or
company. patternsmart is not responsible for the accuracy or content of any
product, service or company linked to on this website.
Futures trading
contains substantial risk and is not for every investor.Please read the following risk disclosure before considering the
trading of this product:
Futures Risk Disclosure. An investor could
potentially lose all or more than the initial investment. Risk capital is money
that can be lost without jeopardizing ones financial security or life style.
Only risk capital should be used for trading and only those with sufficient risk
capital should consider trading. Past performance is not necessarily indicative
of future results.
Trading stocks, options, futures and forex involves
speculation, and the risk of loss can be substantial.Investor must consider all
relevant risk factors, including their own personal financial situation, before
trading. Trading foreign exchange on margin carries a high level of risk, as
well as its own unique risk factors. Forex investments are subject to
counter-party risk, as there is no central clearing organization for these
transactions. Please read the following risk disclosure before considering the
trading of this product:
Forex Risk Disclosure. Spreads, Straddles, and other multiple-leg option
strategies can entail substantial transaction costs, including multiple
commissions, which may impact any potential return. Options are not suitable for
all investors as the special risks inherent to options trading may expose
investors to potentially rapid and substantial losses. Prior to trading options,
you should carefully read
Characteristics and Risks of Standardized Options.
patternsmart.com
will not be held liable for the loss of money or any damage caused from relying
on the information on this site. Any investment decision you make in your account is solely your responsibility.
TESTIMONIAL DISCLOSURE: TESTIMONIALS APPEARING ON OUR SITE MAY NOT BE REPRESENTATIVE OF THE EXPERIENCE OF OTHER CLIENTS OR CUSTOMERS AND IS NOT A GUARANTEE OF FUTURE PERFORMANCE OR SUCCESS.