
Your shopping cart is empty!
Shopping Cart
0 item(s) - FreeCustomization and Conversion for: Ctrader, MetaTrader(MT4, MT5), Thinkorswim, NinjaTrader, MultiCharts, Tradingview, Prorealtime, SierraChart, etc.
License renew price will be 20% off for the 2nd year and after.
Every Purchase Comes with a Coupon.
Share Your Experience. Help Other Traders Learn. Get Rewarded.
Share Your Experience. Help Other Traders Learn. Get Rewarded.
Featured




Double Top Chart Pattern Indicator for Sierra Chart

 (
Professional Double Top Pattern Detection for Sierra Chart Traders
Identify one of the most recognized bearish reversal formations in technical analysis with the Double Top Chart Pattern Indicator for Sierra Chart. Designed for traders who want to streamline chart analysis and reduce manual pattern scanning, this indicator automatically highlights potential Double Top formations directly on your charts.
Whether you trade stocks, futures, forex, commodities, or indices through Sierra Chart, the indicator helps you locate possible market reversal opportunities quickly and efficiently, allowing you to focus on trade planning and risk management instead of spending hours searching for chart patterns.
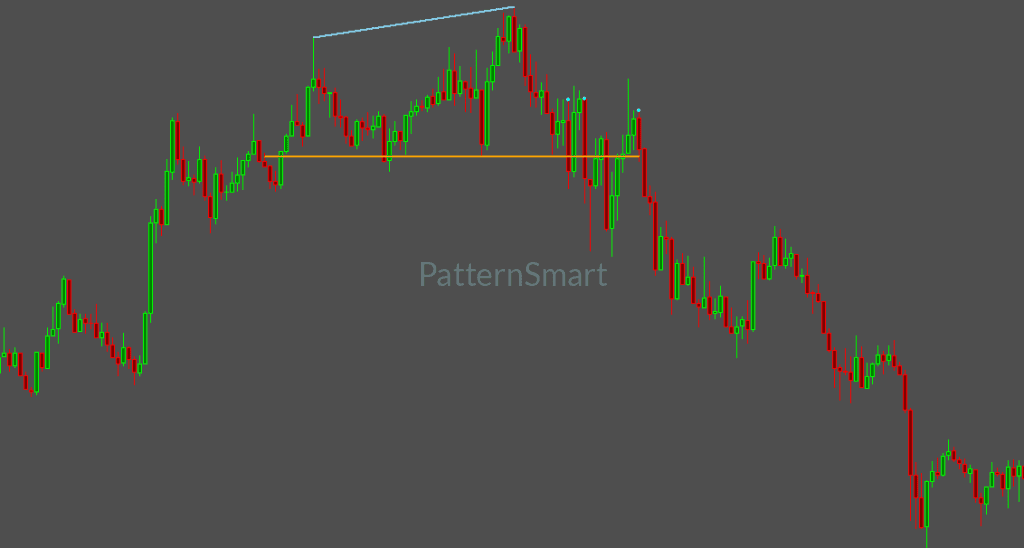
What is a Double Top Pattern?
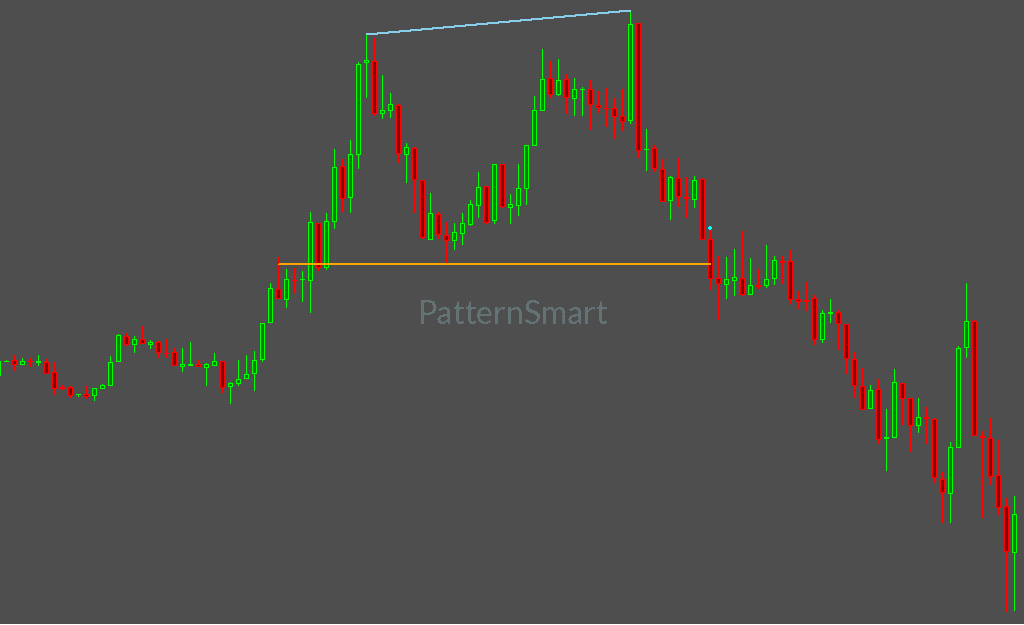
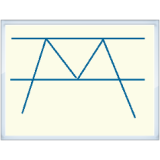
A Double Top is a classic bearish reversal chart pattern that forms after an extended upward movement. The pattern consists of two significant price peaks occurring at approximately the same level, separated by an intervening decline.
When properly formed, the pattern may indicate that buying pressure is weakening and that a potential trend reversal could occur. Because of its widespread recognition among technical traders, the Double Top pattern is used across numerous financial markets and timeframes.
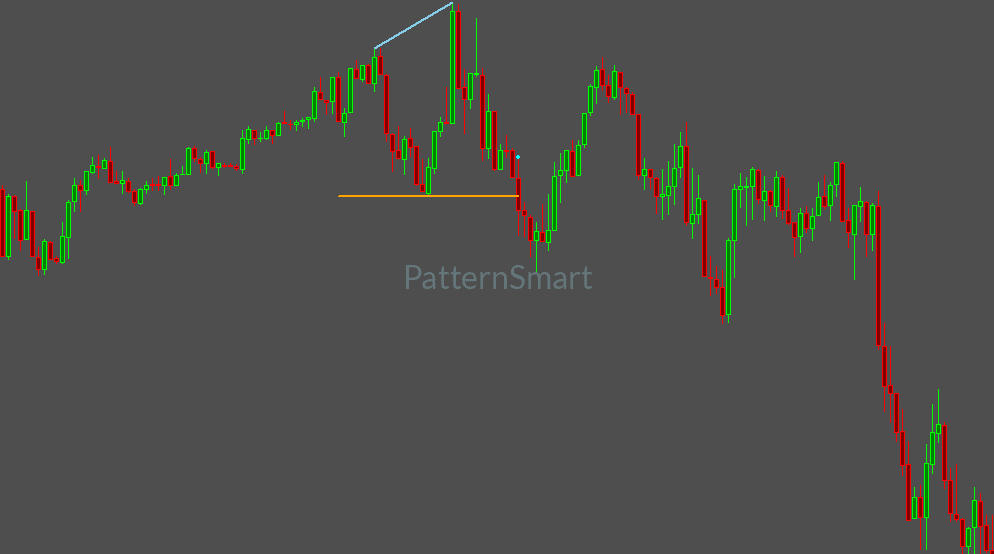
The Double Top Chart Pattern Indicator continuously scans market data and visually highlights these formations whenever they meet the selected pattern criteria.
Key Features
Automatic Double Top Pattern Recognition
The indicator continuously monitors market activity and automatically identifies potential Double Top formations as they develop. This eliminates the need for constant manual chart inspection while helping traders discover opportunities they might otherwise overlook.
Multiple Pattern Size Detection
Different traders look for different types of setups. The indicator allows you to scan for multiple pattern categories:
- Enable Small Pattern
- Enable Medium Pattern
- Enable Large Pattern
This flexibility allows day traders, swing traders, and position traders to customize pattern recognition according to their preferred trading style and market conditions.
Adjustable Detection Range
Customize the scanning range to control how much market history the indicator evaluates when searching for valid Double Top structures.
The adjustable range setting provides flexibility for various chart periods and trading methodologies.
Show Latest Pattern Only Option
Keep charts clean and focused by displaying only the most recently detected Double Top pattern.
This feature is particularly useful for active traders who prefer highlighting current setups while reducing historical chart clutter.
Real-Time Market Monitoring
As new price bars are created, the indicator continues evaluating market conditions and searching for fresh Double Top opportunities, helping traders stay informed about developing reversal structures.
Alert Notifications
Enable built-in alerts to receive notifications whenever a new qualifying pattern is detected.
Benefits include:
- Faster reaction to emerging setups
- Reduced screen monitoring
- Improved workflow automation
- Better market awareness
Fully Customizable Visual Appearance
Adapt the indicator to your chart theme and personal preferences by customizing:
- Top Line Color
- Support Line Color
- Line Width
The configurable visual settings ensure the identified patterns remain clear and easy to interpret across different chart backgrounds and workspaces.
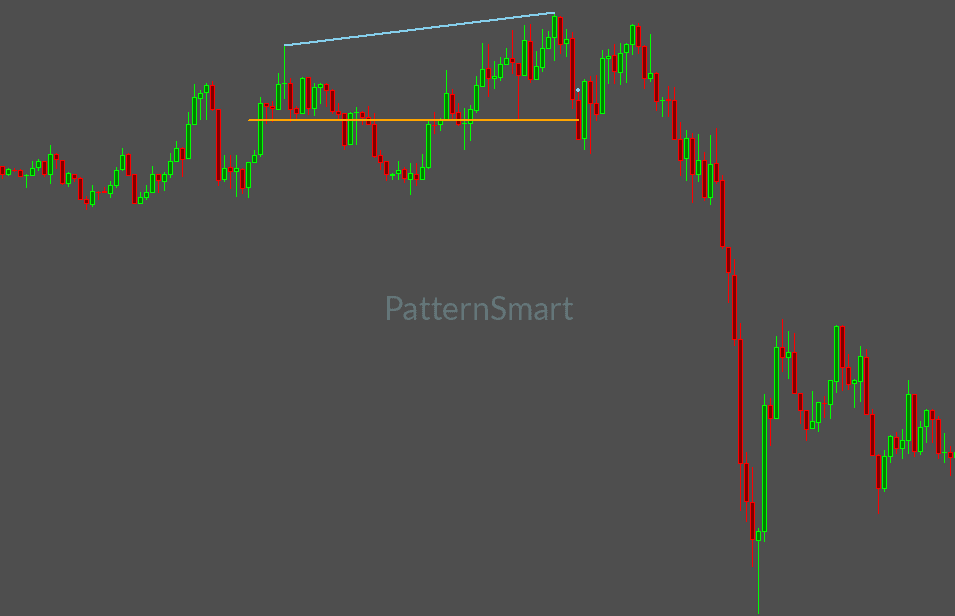
Designed for Sierra Chart
The Double Top Chart Pattern Indicator is built specifically for Sierra Chart users and integrates seamlessly with existing chart layouts.
Benefits include:
- Fast pattern visualization
- Clean chart presentation
- Easy installation
- Flexible customization
- Compatibility with multiple chart timeframes
- Suitable for futures, forex, stocks, and CFDs
Trading Applications
Traders use Double Top patterns in many different ways, including:
Reversal Analysis
Monitor areas where an established uptrend may be losing momentum and potentially transitioning into a bearish phase.
Confirmation Tool
Use detected patterns as part of a broader technical analysis approach that includes:
- Support and resistance zones
- Volume analysis
- Trend analysis
- Momentum indicators
- Price action confirmation
Multi-Timeframe Analysis
Scan for Double Top formations on higher timeframes while refining entries on lower timeframe charts for improved trade planning.
Risk Management Planning
Pattern structures may help traders identify logical areas for:
- Entry planning
- Stop-loss placement
- Profit target estimation
- Risk-to-reward analysis
Why Use an Automated Double Top Indicator?
Manually identifying chart patterns can be time-consuming and subjective. Even experienced traders may interpret patterns differently.
The Double Top Chart Pattern Indicator helps by:
- Reducing chart analysis workload
- Providing objective pattern visualization
- Improving consistency across charts
- Helping discover opportunities faster
- Supporting disciplined trading routines
With automatic detection, traders can spend less time searching and more time evaluating potential trading opportunities.
Customizable Inputs
The indicator includes the following configurable settings:
| Input | Description |
|---|---|
| Enable Small Pattern | Detect smaller Double Top formations |
| Enable Medium Pattern | Detect medium-sized Double Top formations |
| Enable Large Pattern | Detect larger market structures |
| Range | Controls pattern scanning distance |
| Show Last Pattern Only | Displays only the most recent detected pattern |
| Enable Alert | Activates detection notifications |
| Top Line Color | Customize upper resistance line appearance |
| Support Line Color | Customize support level appearance |
| Line Width | Adjust pattern line thickness |
Benefits at a Glance
✅ Automatic Double Top detection
✅ Multiple pattern size options
✅ Adjustable scanning range
✅ Real-time pattern monitoring
✅ Alert notifications
✅ Clean chart visualization
✅ Customizable colors and styles
✅ Suitable for all experience levels
✅ Optimized for Sierra Chart
✅ No source code provided
Important Notice
This product is delivered as a compiled Sierra Chart indicator. The source code is not included with the purchase. The indicator is intended to assist with chart pattern recognition and market analysis. All trading decisions remain the responsibility of the user.
Write a review
Your Name:Your Review: Note: HTML is not translated!
Rating: Bad Good
Enter the code in the box below:
Latest



Welcome to Patternsmart
Converting your indicator from one platform to another.Custom Alert, Autotrader, Indicators, Scan, Screener, Strategy and Signals.
Copyright @ 2026 Patternsmart - All rights reserved
This website is for educational and informational
purposes only and should not be considered a solicitation to buy or sell a
futures contract or make any other type of investment decision. It's not recommended to use any single indicator as sole evaluation criteria. The companies
and services listed on this website are not to be considered a recommendation
and it is the reader's responsibility to evaluate any product, service, or
company. patternsmart is not responsible for the accuracy or content of any
product, service or company linked to on this website.
Futures trading
contains substantial risk and is not for every investor.Please read the following risk disclosure before considering the
trading of this product:
Futures Risk Disclosure. An investor could
potentially lose all or more than the initial investment. Risk capital is money
that can be lost without jeopardizing ones financial security or life style.
Only risk capital should be used for trading and only those with sufficient risk
capital should consider trading. Past performance is not necessarily indicative
of future results.
Trading stocks, options, futures and forex involves
speculation, and the risk of loss can be substantial.Investor must consider all
relevant risk factors, including their own personal financial situation, before
trading. Trading foreign exchange on margin carries a high level of risk, as
well as its own unique risk factors. Forex investments are subject to
counter-party risk, as there is no central clearing organization for these
transactions. Please read the following risk disclosure before considering the
trading of this product:
Forex Risk Disclosure. Spreads, Straddles, and other multiple-leg option
strategies can entail substantial transaction costs, including multiple
commissions, which may impact any potential return. Options are not suitable for
all investors as the special risks inherent to options trading may expose
investors to potentially rapid and substantial losses. Prior to trading options,
you should carefully read
Characteristics and Risks of Standardized Options.
patternsmart.com
will not be held liable for the loss of money or any damage caused from relying
on the information on this site. Any investment decision you make in your account is solely your responsibility.
TESTIMONIAL DISCLOSURE: TESTIMONIALS APPEARING ON OUR SITE MAY NOT BE REPRESENTATIVE OF THE EXPERIENCE OF OTHER CLIENTS OR CUSTOMERS AND IS NOT A GUARANTEE OF FUTURE PERFORMANCE OR SUCCESS.