
Your shopping cart is empty!
Shopping Cart
0 item(s) - FreeCustomization and Conversion for: Ctrader, MetaTrader(MT4, MT5), Thinkorswim, NinjaTrader, MultiCharts, Tradingview, Prorealtime, SierraChart, etc.
License renew price will be 20% off for the 2nd year and after.
Every Purchase Comes with a Coupon.
Share Your Experience. Help Other Traders Learn. Get Rewarded.
Share Your Experience. Help Other Traders Learn. Get Rewarded.
Featured
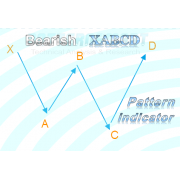

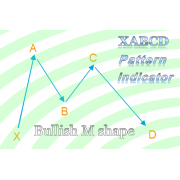

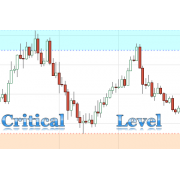

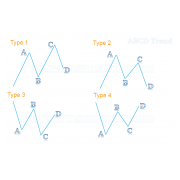

Momentum Double Divergence Pro for MultiCharts


 (
(Momentum Double Divergence Pro for MultiCharts
Master Momentum Transitions with Precision Signal Confirmation
Trading momentum shifts requires identifying weakening price velocity before visible market reversals occur. While standard technical oscillators often generate noisy or conflicting signals, Momentum Double Divergence Pro for MultiCharts delivers a disciplined, confirmation-first framework built specifically for multi-asset traders and technical analysts.
By pairing raw price action with rate-of-change momentum analysis, this professional indicator identifies critical points where market acceleration or deceleration no longer supports prevailing trends. Designed to integrate natively into MultiCharts, it turns complex momentum divergence into structured, actionable market evidence.
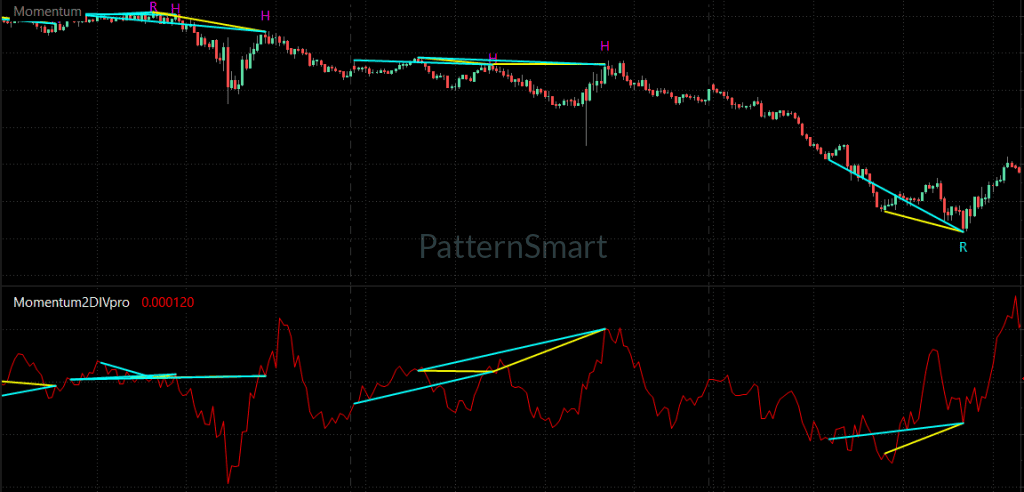
The Analytical Foundation: Rate-of-Change & Divergence
Understanding Rate of Change
The Momentum indicator measures how rapidly price changes relative to a specific historical period. Rather than focusing purely on trend direction or overbought/oversold boundaries, it highlights price acceleration and deceleration.
-
Accelerating Momentum: Price is advancing at an increasing speed, signaling strong underlying participation.
-
Decelerating Momentum: Price may still be reaching new highs, but the speed of the advance is slowing—often providing an early warning shift in market sentiment.
Traditional vs. Double Divergence Analysis
Traditional divergence occurs when price action and an indicator move out of agreement. While valuable, standalone divergence can produce false signals during strong, persistent trends where momentum fluctuates without leading to price reversals.
Traditional Divergence:
Price Action (Higher High)  <--->  Momentum (Lower High)  = Unconfirmed Signal

PatternSmart Methodology:
Price Action + Momentum Divergence + Multi-Layer Confirmation = Higher Analytical Confidence
The PatternSmart methodology transforms traditional divergence from a simple signal generator into a multi-layered analytical process. Rather than treating every divergence as an automatic counter-trend opportunity, Double Divergence Pro emphasizes context, probability, and confirmation.
Primary Signal Classifications
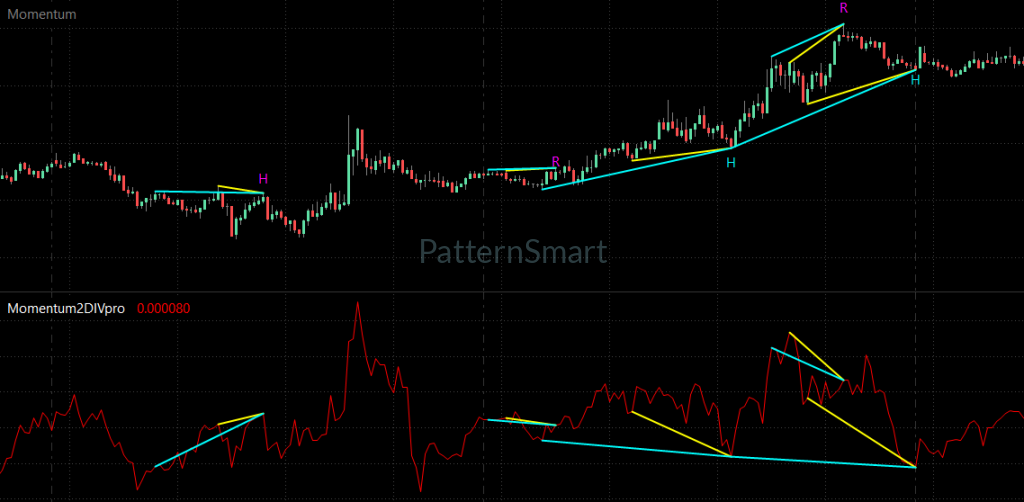
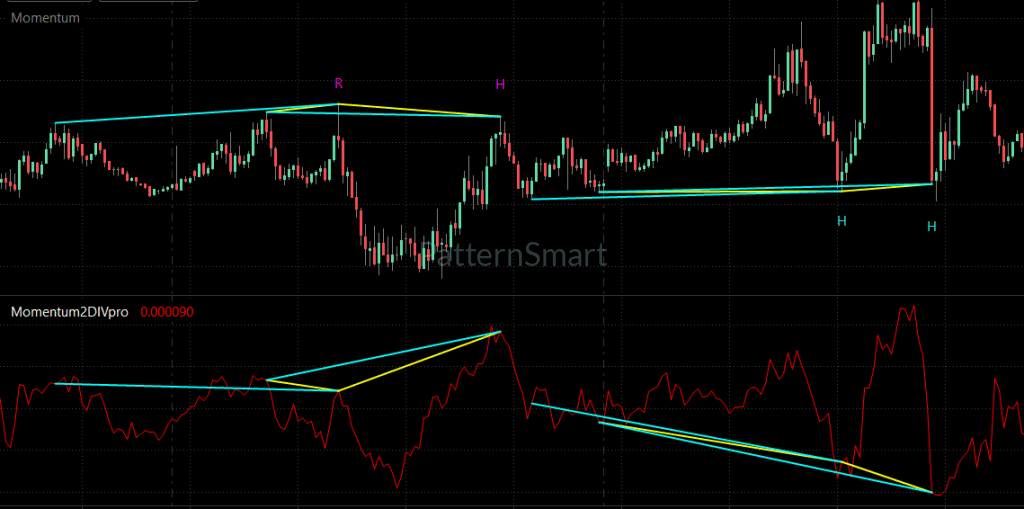
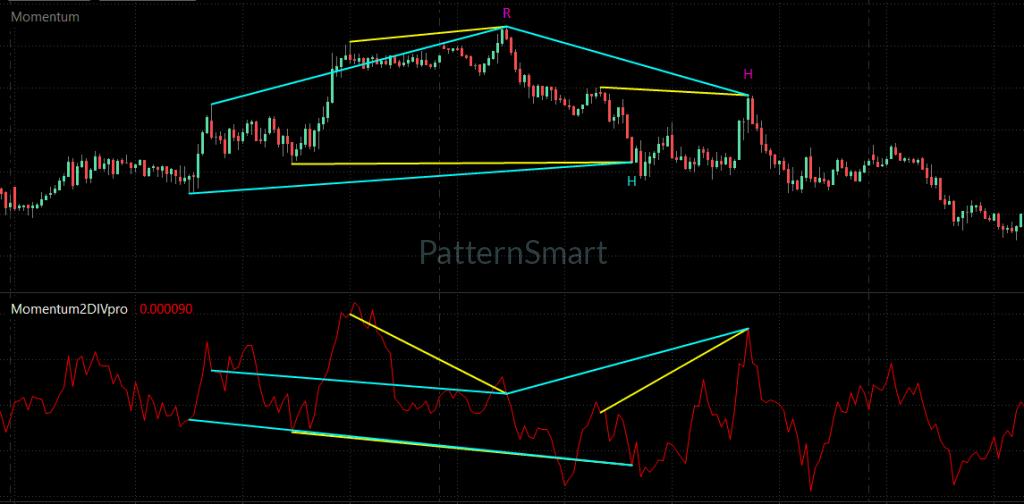
Momentum Double Divergence Pro automatically detects, classifies, and plots four primary divergence structures directly on your MultiCharts workspace:
| Signal Category | Market Structure | Indicator Behavior | Analytical Significance |
| Bullish Regular Divergence | Price forms a Lower Low | Momentum forms a Higher Low | Indicates deceleration in selling pressure; potential early warning of a bullish reversal. |
| Bearish Regular Divergence | Price forms a Higher High | Momentum forms a Lower High | Indicates deceleration in buying pressure; potential early warning of a bearish reversal. |
| Bullish Hidden Divergence | Price forms a Higher Low | Momentum forms a Lower Low | Suggests underlying bullish momentum remains intact despite a temporary price pullback. |
| Bearish Hidden Divergence | Price forms a Lower High | Momentum forms a Higher High | Suggests underlying bearish momentum remains intact despite a temporary upward rally. |
Designed for MultiCharts Workspaces
MultiCharts is renowned for high-performance charting, advanced backtesting, and institutional-grade technical analysis. Momentum Double Divergence Pro is optimized to leverage MultiCharts' native architecture:
-
High-Precision Chart Rendering: Seamlessly overlay dynamic divergence lines and customizable visual markers directly across main price panels or sub-charts without chart lag.
-
Multi-Timeframe Workspace Integration: Analyze momentum behavior on intraday tick, volume, or time-based charts alongside higher-timeframe daily and weekly trends.
-
Flexible Alert System: Receive instant audio, visual, or programmatic alerts whenever confirmed divergence structures form, keeping you informed across multiple symbol monitor lists.
Core Product Features & Practical Benefits
-
Automated Divergence Detection: Eliminates manual trendline drawing by dynamically plotting regular and hidden divergence structures in real time.
-
Configurable Lookback Parameters: Tailor pivot strength, evaluation periods, and smoothing inputs to align with your specific market instrument and time horizon.
-
Filter Unconfirmed Noise: Uses structured confirmation rules to reduce clutter and prioritize meaningful momentum transitions.
-
Visual Alerting Engine: Real-time visual plots and configurable MultiCharts pop-up alerts ensure you never miss developing market setups.
-
Non-Repainting Calculation Logic: Signal markers lock upon bar close, ensuring absolute historical accuracy for reliable charting and performance evaluation.
Frequently Asked Questions
Does Momentum Double Divergence Pro repaint its signals?
No. Once a bar closes and a divergence structure is confirmed, the signal marker remains permanently fixed on the chart.
Can I use this indicator for short-term day trading?
Yes. While momentum analysis applies across all timeframes, its focus on acceleration and deceleration makes it particularly valuable for active day traders and swing traders evaluating intraday momentum shifts.
How does Momentum divergence differ from RSI divergence?
RSI measures relative price changes within a bounded scale (0–100) and emphasizes market extremes. Momentum measures raw rate-of-change velocity without upper or lower boundaries, making it exceptionally sensitive to early changes in speed.
Does this indicator generate automatic buy and sell orders in MultiCharts?
No. PatternSmart products are educational and analytical tools designed to strengthen trader decision-making through objective technical evidence, not automated execution systems.
Elevate Your Momentum Analysis
Stop chasing lagging price movement. Incorporate objective, rate-of-change momentum analysis into your trading workflow today.
Looking for the complete mathematical breakdown, step-by-step optimization guides, and advanced trading strategies? Explore our comprehensive documentation:
Visit the Technical Inputs Manual: Double Divergence Pro for full parameter tuning.
Read the master guide on the Double Divergence Indicator Series.
Write a review
Your Name:Your Review: Note: HTML is not translated!
Rating: Bad Good
Enter the code in the box below:


Latest

Welcome to Patternsmart
Converting your indicator from one platform to another.Custom Alert, Autotrader, Indicators, Scan, Screener, Strategy and Signals.
Copyright @ 2026 Patternsmart - All rights reserved
This website is for educational and informational
purposes only and should not be considered a solicitation to buy or sell a
futures contract or make any other type of investment decision. It's not recommended to use any single indicator as sole evaluation criteria. The companies
and services listed on this website are not to be considered a recommendation
and it is the reader's responsibility to evaluate any product, service, or
company. patternsmart is not responsible for the accuracy or content of any
product, service or company linked to on this website.
Futures trading
contains substantial risk and is not for every investor.Please read the following risk disclosure before considering the
trading of this product:
Futures Risk Disclosure. An investor could
potentially lose all or more than the initial investment. Risk capital is money
that can be lost without jeopardizing ones financial security or life style.
Only risk capital should be used for trading and only those with sufficient risk
capital should consider trading. Past performance is not necessarily indicative
of future results.
Trading stocks, options, futures and forex involves
speculation, and the risk of loss can be substantial.Investor must consider all
relevant risk factors, including their own personal financial situation, before
trading. Trading foreign exchange on margin carries a high level of risk, as
well as its own unique risk factors. Forex investments are subject to
counter-party risk, as there is no central clearing organization for these
transactions. Please read the following risk disclosure before considering the
trading of this product:
Forex Risk Disclosure. Spreads, Straddles, and other multiple-leg option
strategies can entail substantial transaction costs, including multiple
commissions, which may impact any potential return. Options are not suitable for
all investors as the special risks inherent to options trading may expose
investors to potentially rapid and substantial losses. Prior to trading options,
you should carefully read
Characteristics and Risks of Standardized Options.
patternsmart.com
will not be held liable for the loss of money or any damage caused from relying
on the information on this site. Any investment decision you make in your account is solely your responsibility.
TESTIMONIAL DISCLOSURE: TESTIMONIALS APPEARING ON OUR SITE MAY NOT BE REPRESENTATIVE OF THE EXPERIENCE OF OTHER CLIENTS OR CUSTOMERS AND IS NOT A GUARANTEE OF FUTURE PERFORMANCE OR SUCCESS.