
Your shopping cart is empty!
Shopping Cart
0 item(s) - FreeCustomization and Conversion for: Ctrader, MetaTrader(MT4, MT5), Thinkorswim, NinjaTrader, MultiCharts, Tradingview, Prorealtime, SierraChart, etc.
License renew price will be 20% off for the 2nd year and after.
Every Purchase Comes with a Coupon.
Share Your Experience. Help Other Traders Learn. Get Rewarded.
Share Your Experience. Help Other Traders Learn. Get Rewarded.
Featured





MACD Double Divergence Indicator for Sierra Chart


 (
(Introduction: The Challenge of Timing Trend Transitions
Identifying when a trending market is beginning to lose momentum—or when a consolidation phase is quietly preparing for a directional breakout—remains one of the most persistent analytical challenges in technical analysis. For active traders operating in high-performance environments, the difficulty is rarely a lack of information; rather, it is the challenge of distinguishing meaningful structural shifts from everyday market noise.
Price action reflects the immediate balance between buyers and sellers, but price alone does not always reveal the underlying strength or sustainability of a move. A market may continue reaching new price highs while the internal momentum driving that move is quietly deteriorating. Conversely, price may pull back sharply within a strong macro trend even though the underlying trend structure remains technically sound.
Technical momentum oscillators were developed to evaluate these internal dynamics. Among them, the Moving Average Convergence Divergence (MACD) stands out as a foundational tool for evaluating trend development, momentum shifts, and market transitions. However, interpreting MACD behavior—specifically identifying when indicator movement diverges from price action—requires a structured analytical framework.
This product page explores how combining the time-tested principles of MACD momentum analysis with PatternSmart’s confirmation-based Double Divergence methodology provides traders with a disciplined, objective approach to evaluating market transitions within the Sierra Chart environment.
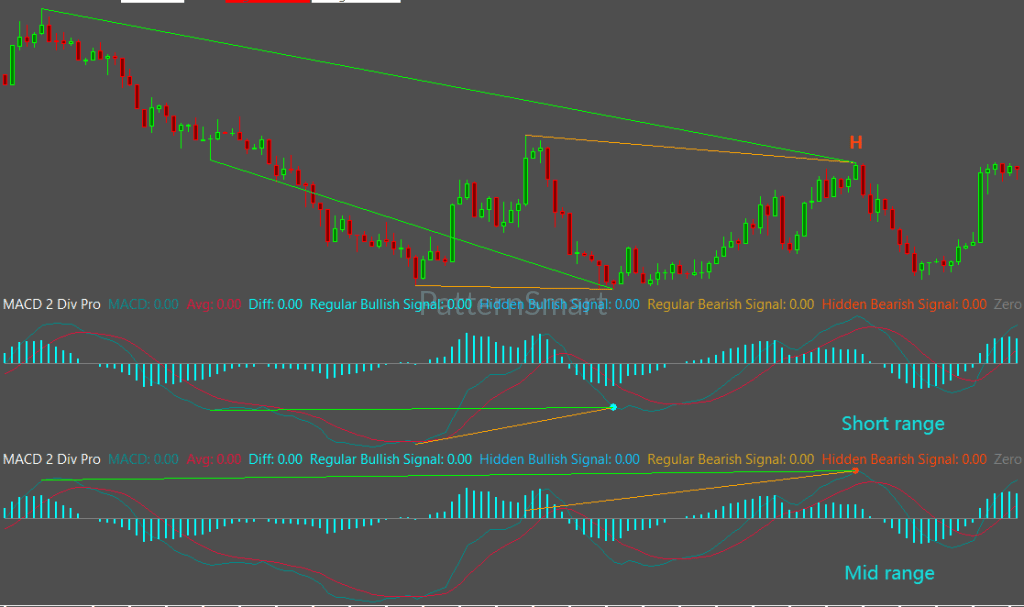
Understanding the Market Challenge: Trend Transitions & Momentum Deceleration
To understand why divergence occurs, one must first examine the relationship between price velocity and trend sustainability. Market trends rarely end abruptly without prior warning signals in underlying momentum. Long before price completes a visible chart pattern reversal, the rate at which price is advancing or declining often begins to slow down.
This slowing process is known as momentum deceleration.
BULLISH REGULAR DIVERGENCE (Conceptual Structure)

Price Action:       High 1 ---------------> Higher High 2
                       \                      /
                        \                    /
                         \                  /
Indicator (MACD):   Peak 1 ---------------> Lower Peak 2
                    (Strong Momentum)       (Weakening Momentum)
In an advancing market, a new price high driven by aggressive buying pressure represents a healthy trend. However, if price later pushes to a higher high while the volume, buying pressure, or rate of price change produces a lower peak on a momentum indicator, the market is exhibiting a difference in behavior.
In traditional technical analysis, this disagreement between price and momentum is termed divergence:
-
Regular Divergence: Price reaches a new extreme (higher high or lower low), but the indicator fails to mirror that extreme. This condition often signals weakening momentum and potential trend exhaustion.
-
Hidden Divergence: Price forms a higher low during a pullback (in an uptrend) or a lower high during a rally (in a downtrend), while the indicator forms a lower low or higher high. This condition suggests that the broader trend structure remains technically intact despite temporary price retracements.
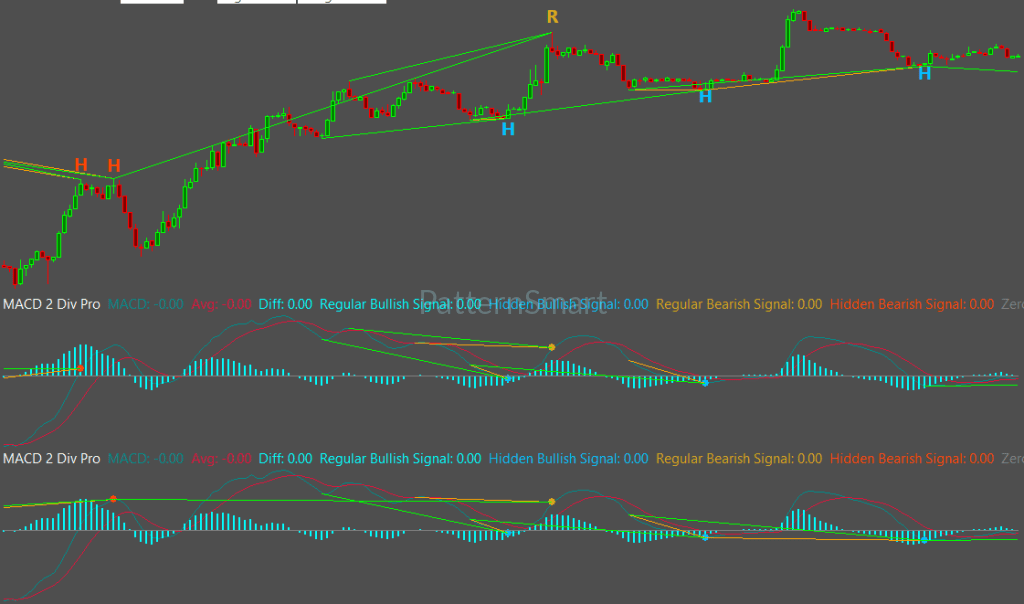
The Problem with Isolated Divergence
While traditional divergence is a valuable analytical observation, it is not a predictive guarantee. In strong, persistent trends, standard momentum oscillators can generate multiple premature divergence signals while price continues to advance. Interpreting every divergence in isolation without structural validation or market context often leads to premature counter-trend anticipation.
To extract practical analytical value from divergence, traders require:
-
A clear understanding of what the underlying indicator actually measures.
-
A structured methodology that prioritizes technical confirmation over prediction.
-
An analytical engine capable of filtering low-quality structural noise.
Understanding the Indicator: The Analytical Purpose of MACD
The Moving Average Convergence Divergence indicator, originally developed by Gerald Appel, combines moving average principles with momentum oscillator design. Unlike pure momentum indicators that measure simple rate-of-change across a fixed lookback window, MACD evaluates the changing relationship between two exponential moving averages (typically the 12-period and 26-period EMAs).
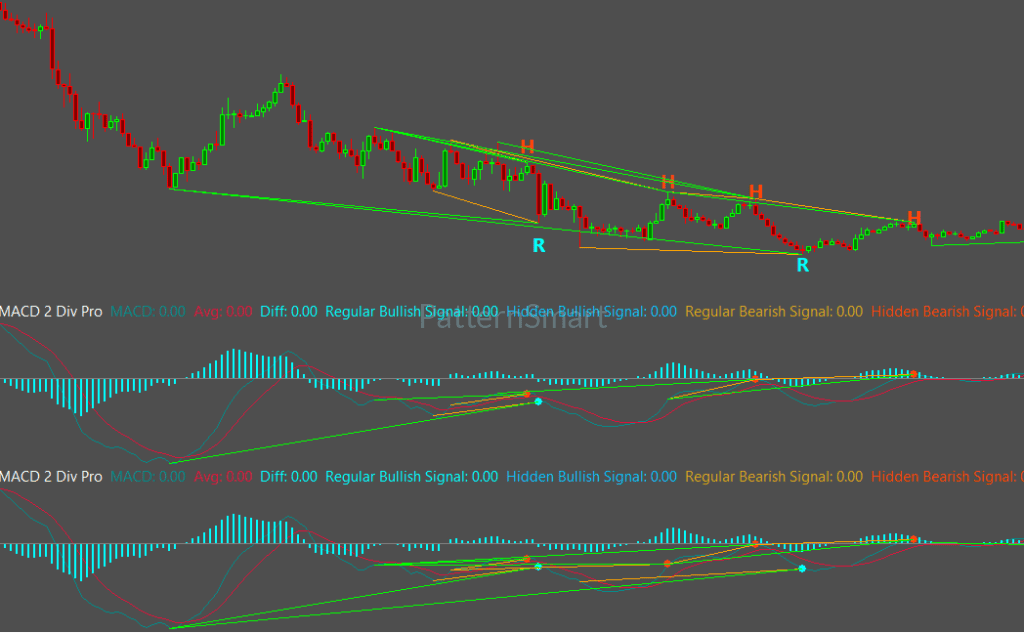
Primary Analytical Focus of MACD
-
Trend Transitions: MACD excels at tracking the transition from consolidation to trend development, as well as the transition from an accelerating trend to momentum exhaustion.
-
Momentum Confirmation: By comparing short-term price velocity to longer-term price trend, MACD identifies whether current price movement is gaining or losing momentum relative to its recent historical baseline.
-
Developing Market Cycles: The interaction between the MACD line and its signal line (typically a 9-period EMA of the MACD line) illustrates shifting cyclical bias across medium-term timeframes.
What MACD Measures vs. What It Does Not
It is essential to align the indicator's analytical characteristics with the trader's analytical objectives:
-
MACD Measures: Moving average convergence/divergence, directional momentum, and trend acceleration/deceleration.
-
MACD Does Not Measure: Absolute overbought/oversold statistical extremes (unlike fixed-bound oscillators like RSI or Stochastics) or capital volume flow (unlike Money Flow).
Because MACD evaluates trend development through smoothed moving average relationships, MACD divergence tends to reflect broader, medium-term structural transitions rather than minor, short-term noise. When MACD diverges from price, it signals that the underlying moving average alignment is no longer accelerating in direction with price—offering a crucial analytical warning that trend quality may be deteriorating.
The PatternSmart Methodology: Why Double Divergence Matters
The PatternSmart Double Divergence methodology extends traditional divergence analysis into a structured, confirmation-based framework. Rather than viewing divergence as an immediate, isolated signal to enter a trade, the PatternSmart framework treats divergence as analytical evidence that must be validated within broader market context.
THE DOUBLE DIVERGENCE ANALYTICAL WORKFLOW

  [ Market Observation ]
            │
            ▼
  [ Divergence Identification ] ── (Price vs. Indicator Disagreement)
            │
            ▼
  [ Structural Validation ] ──── (Evaluation via Filter Length & Lookback)
            │
            ▼
  [ Technical Confirmation ] ──── (Wait 1 Bar & Enhanced Mode Checks)
            │
            ▼
  [ Higher Analytical Confidence ]
Core Methodological Principles
-
Price Always Leads: Price action remains the primary source of technical information. Indicators provide secondary, confirmatory context.
-
Probability Over Certainty: Technical analysis is the process of evaluating evidence to estimate probability. No divergence guarantees a price reversal or trend continuation.
-
Confirmation-First Philosophy: A technical observation becomes actionable only when supported by additional structural confirmation. Higher analytical confidence comes from combining multiple layers of evidence.
-
Indicator and Platform Independence: The core Double Divergence analytical philosophy remains constant regardless of which underlying indicator (MACD, RSI, ADX) or trading platform is used. Only the specific market characteristic being measured adapts.
By applying the Double Divergence methodology to MACD, the indicator transforms from a simple momentum line into a comprehensive structural engine. It systematically scans historical swing points, measures structural symmetry, and highlights both Regular (reversal potential) and Hidden (continuation potential) divergence events with objective precision.
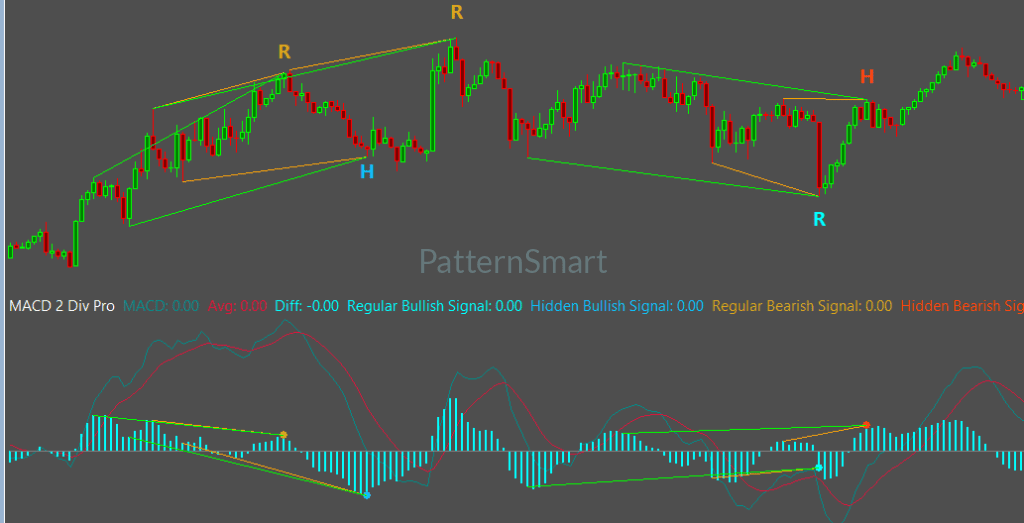
Platform Integration: MACD Double Divergence for Sierra Chart
For traders who choose Sierra Chart, technical analysis is defined by execution speed, charting precision, data integrity, and extreme customization. Sierra Chart is widely regarded as a premier high-performance platform for active futures, index, and Forex traders who require reliable, uncompromised charting tools.
+-----------------------------------------------------------------------+
| Sierra Chart Workspace                                                |
| +-------------------------------------------------------------------+ |
| | Price Chart (ES / NQ Futures)                                     | |
| |                                   /\  (Higher High)               | |
| |                                  /  \                             | |
| |                   /\            /    \                            | |
| |                  /  \          /      \                           | |
| |                 /    \________/        \                          | |
| |                /                        \ [Bearish Regular Line]  | |
| +-------------------------------------------------------------------+ |
| | Subgraph: MACD Double Divergence Study                            | |
| |           /\                                                      | |
| |          /  \           /\  (Lower Peak -> Bearish Divergence)    | |
| | ________/    \_________/  \______________________________________ | |
| +-------------------------------------------------------------------+ |
+-----------------------------------------------------------------------+
Why Sierra Chart Traders Benefit from MACD Double Divergence
Sierra Chart users typically build sophisticated, multi-study workspaces where clarity, calculation performance, and chart organization are paramount. The PatternSmart MACD Double Divergence Indicator for Sierra Chart integrates natively into this professional environment:
-
High-Performance Calculation Engine: Built to leverage Sierra Chart’s efficient processing architecture, ensuring rapid recalculation across historical data without causing chart lag or memory bottlenecks during active trading sessions.
-
Precision Chart Visualization: Draws crisp, customizable divergence lines directly across price bars and study subgraphs, making structural relationships instantly clear during fast-moving market conditions.
-
Streamlined Analytical Workflow: Reduces mental fatigue by automatically identifying valid historical swing anchors, allowing discretionary traders to focus on higher-level context such as market structure, order flow, and key support/resistance levels.
Product Features & Technical Configuration
The MACD Double Divergence Indicator for Sierra Chart includes a robust array of user-configurable inputs documented in the Double Divergence Pro Inputs Manual. These features allow traders to adapt signal sensitivity, filtering rigor, and chart presentation to match their specific timeframes and market conditions.
Here is an overview of the core features powering the indicator:
1. Wait 1 Bar
-
Category: Signal Generation
-
Default Value:
True -
Purpose & Behavior: When set to
True, the indicator requires one completed confirmation bar before finalizing a detected divergence signal. This delays confirmation slightly but significantly reduces premature or repainting signals caused by live, unclosed bar price fluctuations. Setting this toFalseprovides real-time responsiveness at the candidate bar close.
2. Enhanced Mode
-
Category: Signal Filtering
-
Default Value:
False -
Purpose & Behavior: Applies an advanced structural and geometric validation layer to detected divergence structures. When enabled, the indicator evaluates secondary mathematical relationships between divergence anchor points, filtering out lower-quality or noisy divergence setups. It acts as an optional quality-control layer for traders seeking fewer, higher-conviction observations.
3. Divergence Bar Range
-
Category: Advanced Parameters
-
Default Value:
ShortRange -
Purpose & Behavior: Defines the structural search boundaries between historical swing points. Available settings (
ShortRange,MidRange,LongRange) control how far back the calculation engine searches to connect price swings with MACD momentum peaks.ShortRangefocuses on tight, short-term swing structures, whileLongRangeevaluates macro-level multi-leg structural swings.
4. Divergence Lookback & Filter Length
-
Category: Advanced Parameters
-
Default Value:
5(Lookback) /5(Filter Length) -
Purpose & Behavior: These inputs govern internal swing-point detection and calculation smoothing.
Divergence Lookbacksets the number of surrounding bars required to confirm a local price or MACD peak/trough.Filter Lengthcontrols internal smoothing, ensuring that minor price flickering does not disrupt the identification of true structural highs and lows.
5. Custom Alerts & Display Controls
-
Category: Alerts & Notifications / Display & Visualization
-
Default Value:
Enable Alert = True,Show Line = True,Show Char = True -
Purpose & Behavior: Fully integrated with Sierra Chart’s native notification engine (
Alert Sound). Displays customizable text markers (Show Char) and structural trend lines (Show Line) with user-defined colors (Price Line Brush), dash styles, and line widths to suit dark or light chart themes seamlessly.
Practical Analytical Benefits
Integrating the MACD Double Divergence Indicator into your Sierra Chart technical analysis workflow provides several tangible analytical advantages:
-
Objective Signal Consistency: Replaces manual, subjective chart drawing with automated, rule-based algorithmic detection. Ensures that every identified divergence conforms to strict structural criteria.
-
Early Warning of Trend Transitions: Identifies momentum deceleration in developing trends before moving average crossovers or trailing stops are triggered, giving swing and position traders early context on potential trend exhaustion.
-
Multi-Condition Filtering: By utilizing settings like
Wait 1 BarandEnhanced Mode, traders can eliminate market noise and focus exclusively on confirmed, structurally robust divergence patterns. -
Enhanced Multi-Timeframe Alignment: Easily observe whether short-term momentum divergence aligns with macro trend structure on higher-timeframe charts, strengthening overall trade context.
-
Reduced Cognitive Load: Automatically calculates complex historical anchor points, freeing mental bandwidth for risk management, trade execution, and broader market evaluation.
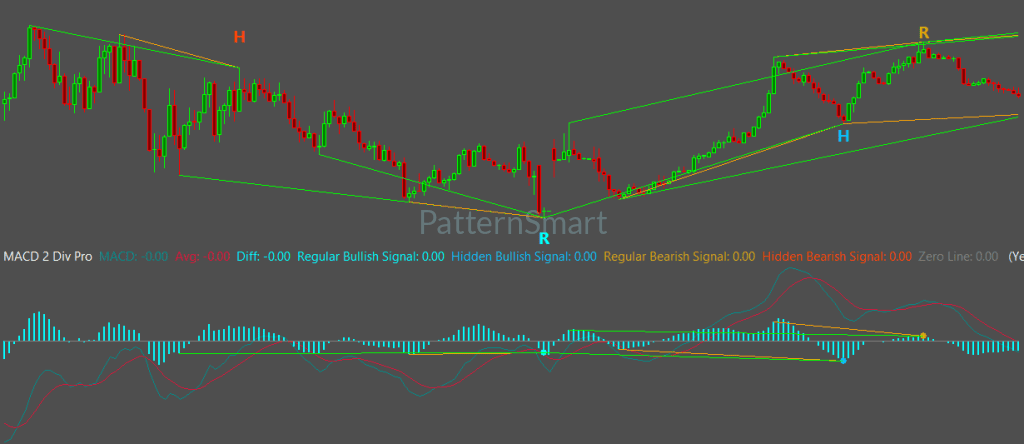
Looking for the complete mathematical breakdown, step-by-step optimization guides, and advanced trading strategies? Explore our comprehensive documentation:
Visit the Technical Inputs Manual: Double Divergence Pro for full parameter tuning.
Read the master guide on the Double Divergence Indicator Series.
Frequently Asked Questions
What is the main difference between Regular and Hidden MACD Divergence?
Regular Divergence occurs when price forms a higher high or lower low while MACD forms a lower high or higher low. It indicates weakening momentum and potential trend exhaustion or reversal. Hidden Divergence occurs when price forms a higher low or lower high while MACD forms a lower low or higher high. It suggests that underlying trend strength remains intact, often signaling trend continuation after a pullback.
Does MACD Double Divergence guarantee a market reversal?
No. In alignment with PatternSmart's core philosophy, divergence represents analytical evidence of changing momentum, not a guaranteed prediction of future price movement. Divergence should always be combined with additional technical confirmation, such as key support/resistance levels, price action patterns, and risk management discipline.
Can I use MACD Double Divergence on intraday futures charts in Sierra Chart?
Yes. The indicator is fully compatible with all Sierra Chart periodicities, including time-based charts (1-min, 5-min, 60-min), tick charts, volume charts, and Renko/range charts across futures, Forex, equities, and indices.
How does "Wait 1 Bar" affect signal timing?
Enabling
Wait 1 Bar ensures that a divergence signal is not officially plotted or alerted until the bar following the divergence structure has completely closed. This provides additional confirmation that the swing high/low has held, reducing false signals during volatile market conditions.Can I run multiple Double Divergence indicators on the same Sierra Chart?
Yes. You can apply multiple PatternSmart Double Divergence indicators (e.g., MACD Double Divergence alongside RSI Double Divergence or Money Flow Double Divergence) on the same chart to compare momentum shifts against capital flow or trend strength.
Conclusion
Technical analysis is most effective when it focuses on evaluating evidence rather than anticipating outcomes. The MACD Double Divergence Indicator for Sierra Chart bridges the gap between classic technical momentum theory and modern, high-performance charting execution.
By combining the trend-transition capabilities of MACD with PatternSmart's disciplined, confirmation-first methodology, traders gain a clearer, more objective perspective on changing market conditions. Whether you are analyzing intraday futures trends or evaluating multi-day swing structures, adding structured double divergence analysis to your Sierra Chart workspace strengthens analytical discipline and elevates technical decision-making.
Write a review
Your Name:Your Review: Note: HTML is not translated!
Rating: Bad Good
Enter the code in the box below:


Latest

Welcome to Patternsmart
Converting your indicator from one platform to another.Custom Alert, Autotrader, Indicators, Scan, Screener, Strategy and Signals.
Copyright @ 2026 Patternsmart - All rights reserved
This website is for educational and informational
purposes only and should not be considered a solicitation to buy or sell a
futures contract or make any other type of investment decision. It's not recommended to use any single indicator as sole evaluation criteria. The companies
and services listed on this website are not to be considered a recommendation
and it is the reader's responsibility to evaluate any product, service, or
company. patternsmart is not responsible for the accuracy or content of any
product, service or company linked to on this website.
Futures trading
contains substantial risk and is not for every investor.Please read the following risk disclosure before considering the
trading of this product:
Futures Risk Disclosure. An investor could
potentially lose all or more than the initial investment. Risk capital is money
that can be lost without jeopardizing ones financial security or life style.
Only risk capital should be used for trading and only those with sufficient risk
capital should consider trading. Past performance is not necessarily indicative
of future results.
Trading stocks, options, futures and forex involves
speculation, and the risk of loss can be substantial.Investor must consider all
relevant risk factors, including their own personal financial situation, before
trading. Trading foreign exchange on margin carries a high level of risk, as
well as its own unique risk factors. Forex investments are subject to
counter-party risk, as there is no central clearing organization for these
transactions. Please read the following risk disclosure before considering the
trading of this product:
Forex Risk Disclosure. Spreads, Straddles, and other multiple-leg option
strategies can entail substantial transaction costs, including multiple
commissions, which may impact any potential return. Options are not suitable for
all investors as the special risks inherent to options trading may expose
investors to potentially rapid and substantial losses. Prior to trading options,
you should carefully read
Characteristics and Risks of Standardized Options.
patternsmart.com
will not be held liable for the loss of money or any damage caused from relying
on the information on this site. Any investment decision you make in your account is solely your responsibility.
TESTIMONIAL DISCLOSURE: TESTIMONIALS APPEARING ON OUR SITE MAY NOT BE REPRESENTATIVE OF THE EXPERIENCE OF OTHER CLIENTS OR CUSTOMERS AND IS NOT A GUARANTEE OF FUTURE PERFORMANCE OR SUCCESS.