Your shopping cart is empty!
Shopping Cart
0 item(s) - FreeCustomization and Conversion for: Ctrader, MetaTrader(MT4, MT5), Thinkorswim, NinjaTrader, MultiCharts, Tradingview, Prorealtime, SierraChart, etc.
License renew price will be 20% off for the 2nd year and after.
Featured

MTF(Multi Time Frame) RSI Divergence indicator, scan, watchlist(custom quotes) for Thinkorswim TOS
 RSI Divergence indicator, scan, watchlist(custom quotes) for Thinkorswim TOS")
") (
(VIP member get 20% off, click here to become a VIP member.
Please note: If you have purchased the RSI Divergence Indicator all-in-one package for Thinkorswim before, you can get this MTF version for just $50. Please contact us for details.
Please note that it does not work on Tick and Range type chart, it only works on Time based chart.
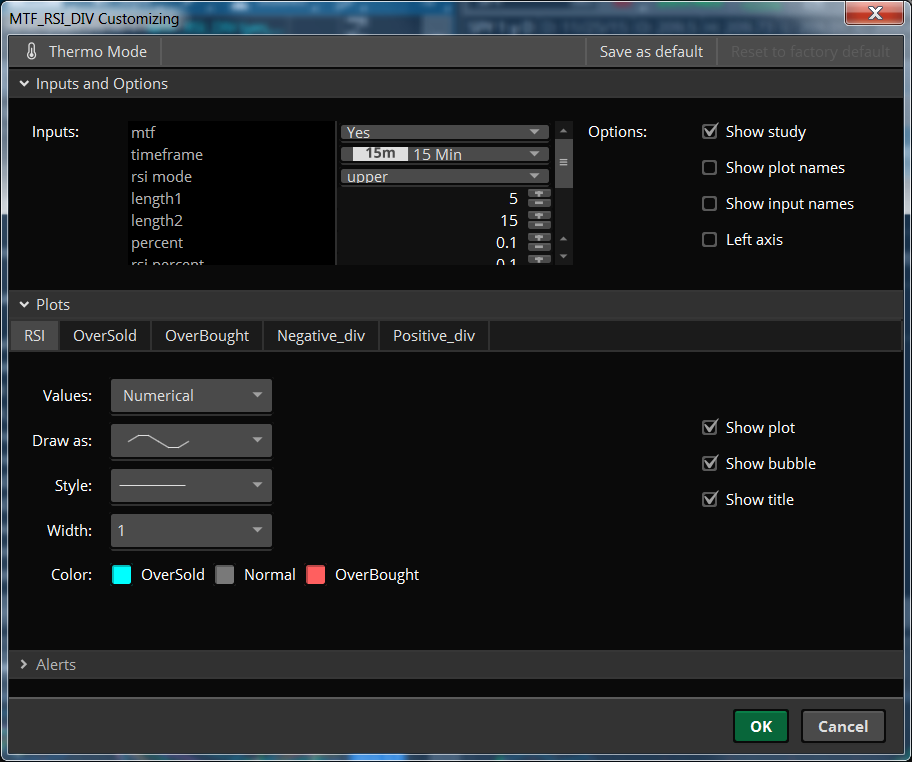
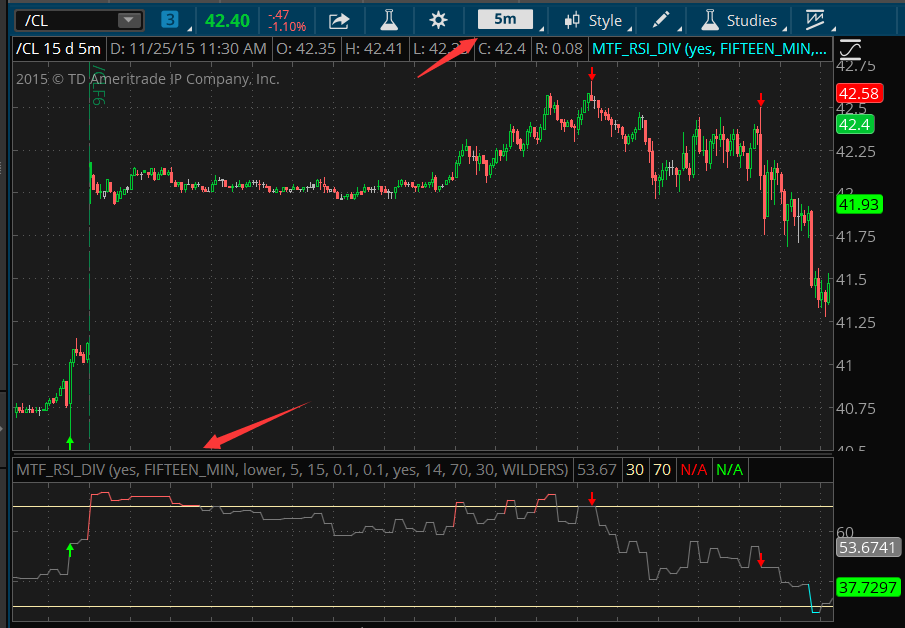
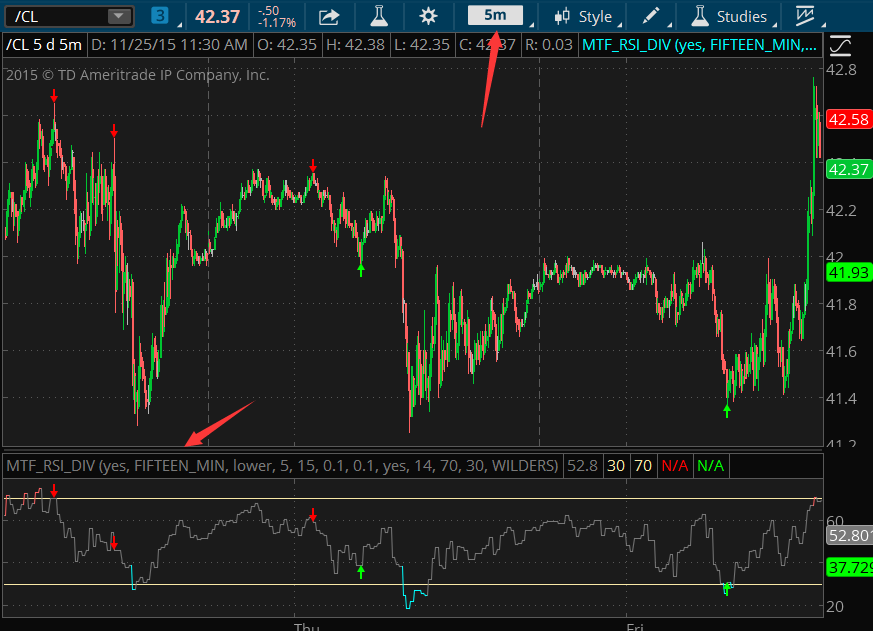
In order to display the RSI divergence signal on both Price and Lower chart, please add the indicator twice(one with RSI MODE input as upper and one with RSI MODE input as lower) all other inputs must be the same for both of them.

This is the MTF(Multi Time Frame) version of our RSI Divergence indicator for Thinkorswim.
It has all the features from RSI Divergence indicator for Thinkorswim TOS When you set 'MTF' input to no, it works as the regular RSI Divergence indicator.
In addition, you will be able to use the MTF (Multi Time Frame) function.
It makes possible to check if there are discrepancies between RSI and price movement in higher timeframes.
It also comes with the:


Please note: If you have purchased the RSI Divergence Indicator all-in-one package for Thinkorswim before, you can get this MTF version for just $50. Please contact us for details.
Please note that it does not work on Tick and Range type chart, it only works on Time based chart.
In order to display the RSI divergence signal on both Price and Lower chart, please add the indicator twice(one with RSI MODE input as upper and one with RSI MODE input as lower) all other inputs must be the same for both of them.
This is the MTF(Multi Time Frame) version of our RSI Divergence indicator for Thinkorswim.
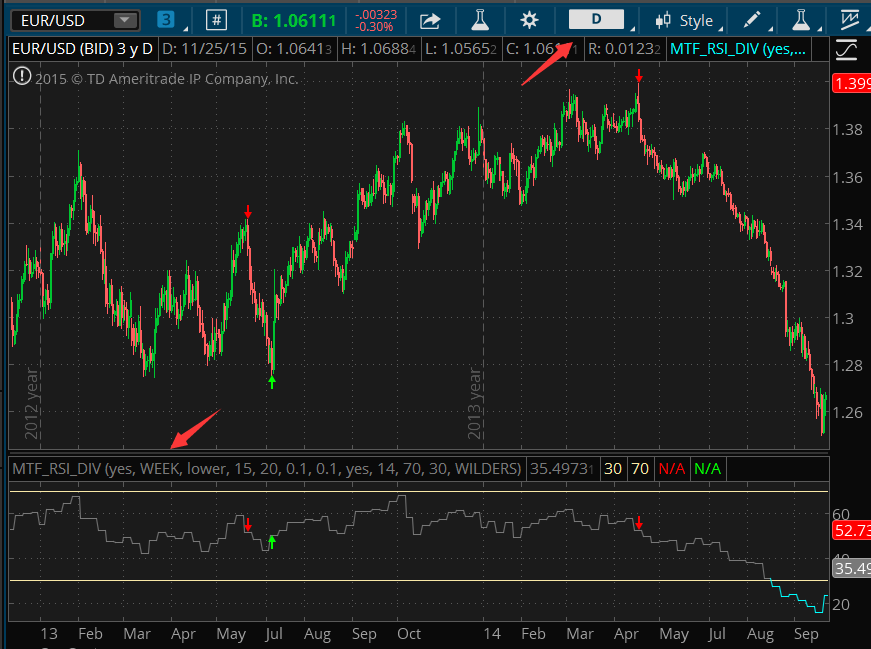
There is no lag or repaint, signals will be drawn at the current bar.
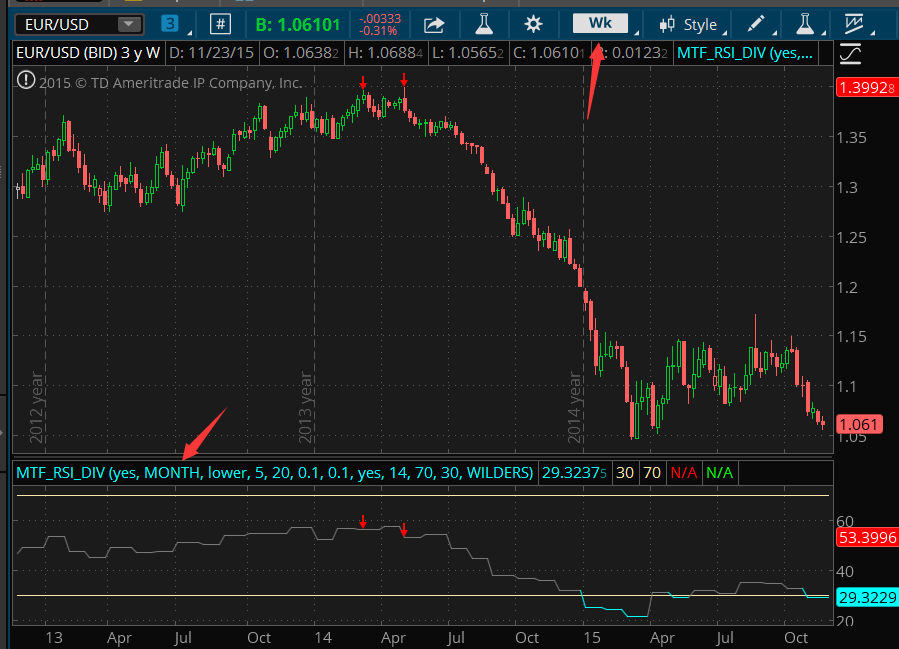
The chart below is the default inputs with a Weekly timeframe on a Daily chart.
As you can see the signal is on the last bar(current bar).

It has all the features from RSI Divergence indicator for Thinkorswim TOS When you set 'MTF' input to no, it works as the regular RSI Divergence indicator.
In addition, you will be able to use the MTF (Multi Time Frame) function.
It makes possible to check if there are discrepancies between RSI and price movement in higher timeframes.
It also comes with the:
- Advanced RSI Divergence SCAN for Thinkorswim TOS
- RSI Divergence signals Custom Quotes for Thinkorswim TOS
Master the Market: How to Use the MTF RSI Divergence Indicator for Precision Trading
In the world of technical analysis, the Relative Strength Index (RSI) is one of the most trusted momentum oscillators. However, even the best indicators can produce "fake outs" when analyzed on a single timeframe. This is where Multi-Time Frame (MTF) analysis and Divergence detection become game-changers.
The MTF RSI Divergence Indicator is designed to filter out market noise and identify high-probability reversal points by synchronizing price action across different timeframes.
What Makes This Indicator Different?
Standard RSI indicators simply show if an asset is overbought or oversold. This professional-grade tool goes several steps further:
-
Zero Lag/Repaint: Signals are drawn on the current bar as they occur, providing real-time accuracy.
-
Dual-Layer Confirmation: It detects discrepancies between price and momentum (Divergence) and allows you to confirm them against a higher timeframe (MTF).
-
Automated Detection: It removes the guesswork by automatically plotting bullish and bearish signals on your chart.
Why Multi-Time Frame Analysis is Essential
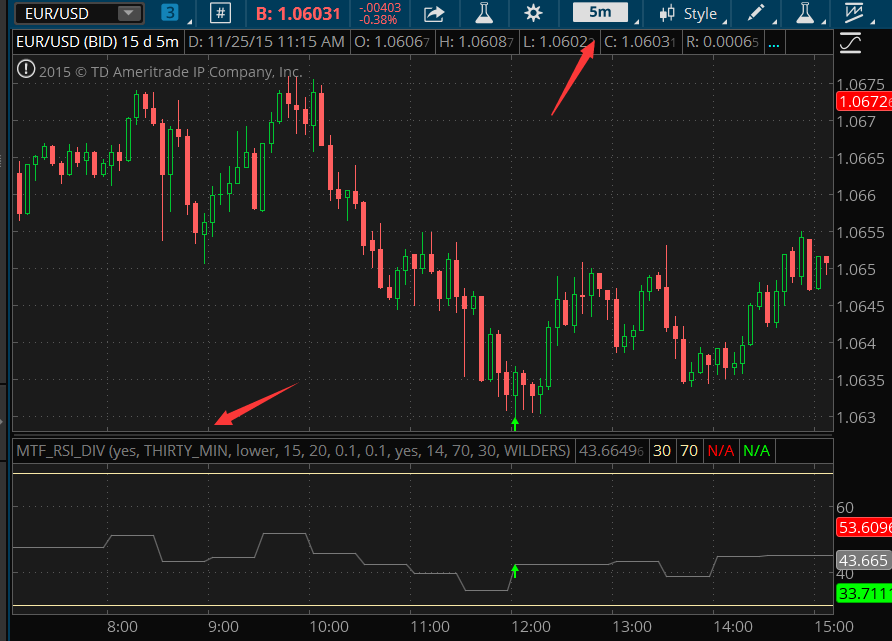
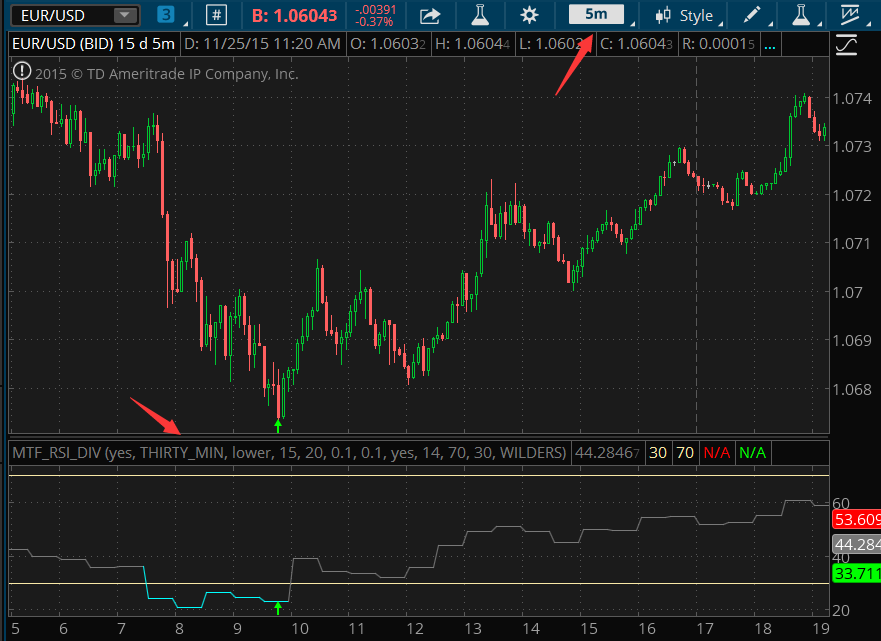
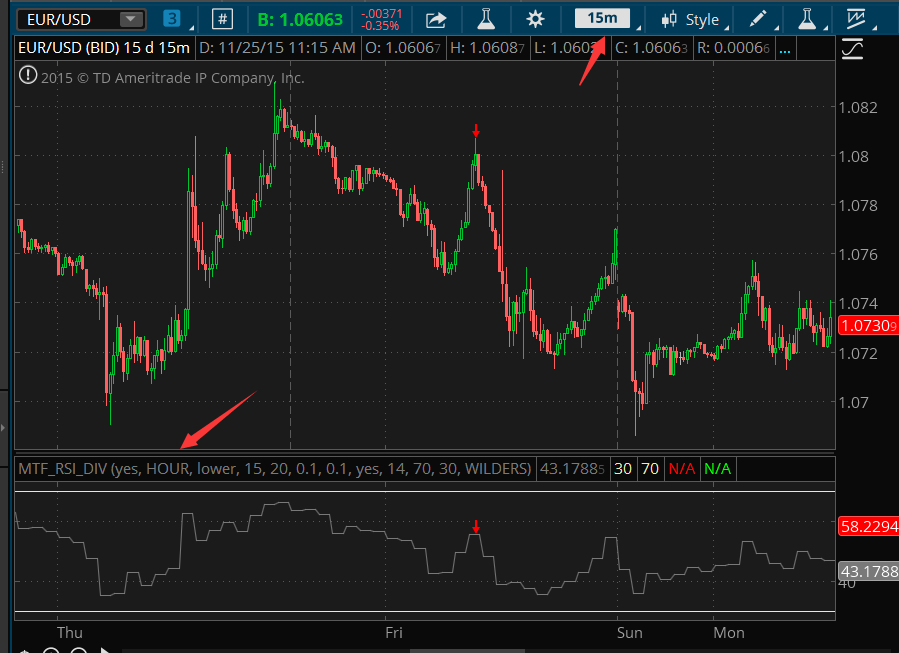
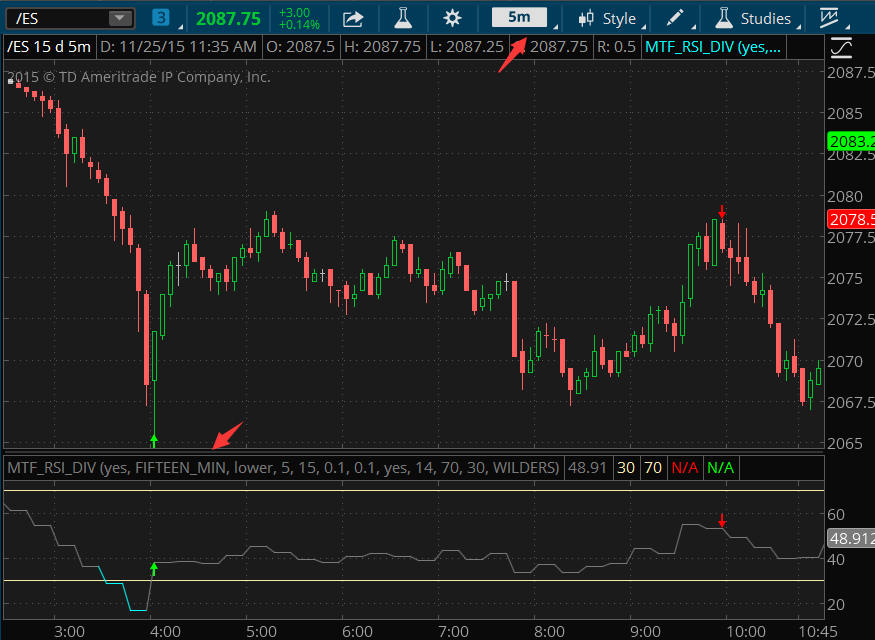
The biggest mistake many day traders make is ignoring the "Big Picture." A bullish divergence on a 5-minute chart might look tempting, but if the 1-hour trend is strongly bearish, that 5-minute signal is likely to fail.
By using the MTF feature, you can:
-
Spot Trend Alignment: Only take long signals on your 1-minute chart when the 15-minute MTF RSI is also showing strength.
-
Filter Noise: Eliminate minor price fluctuations that don't have higher-timeframe backing.
-
Identify Institutional Moves: Higher timeframes (like Daily or Weekly) represent where the "smart money" is moving. Seeing these signals on your lower timeframe chart gives you a massive edge.
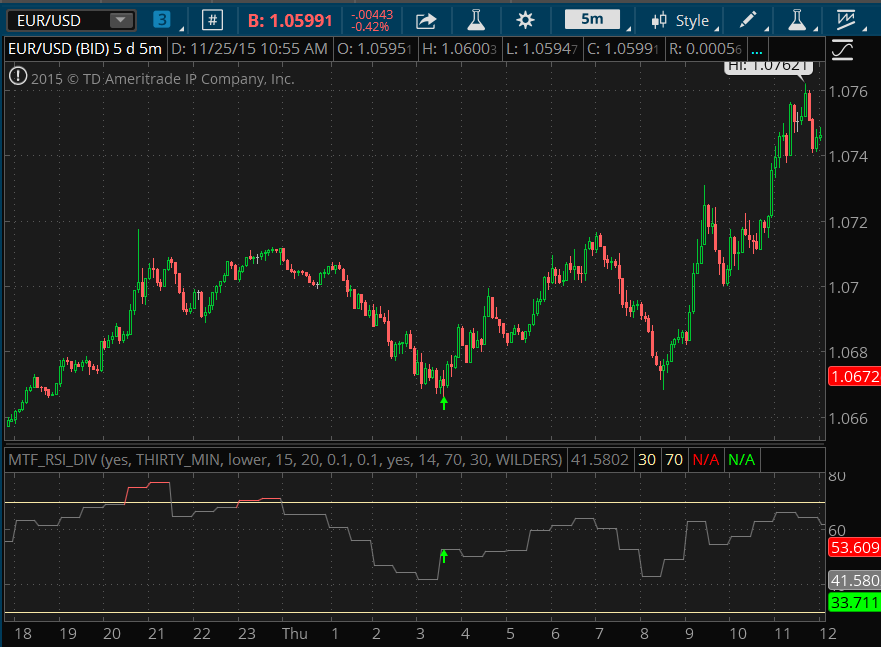
Understanding the Signals: Regular vs. Hidden Divergence
This indicator is built to identify two primary types of market opportunities:
1. Regular Divergence (Trend Reversals)
-
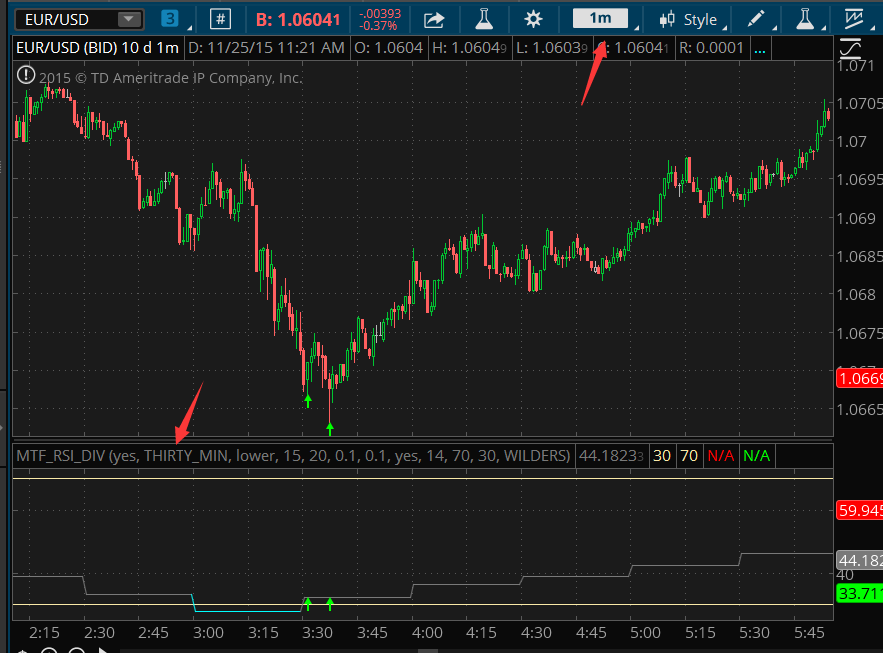
Bullish: Price makes a "Lower Low," but the RSI makes a "Higher Low." This suggests selling pressure is fading, and a move upward is imminent.
-
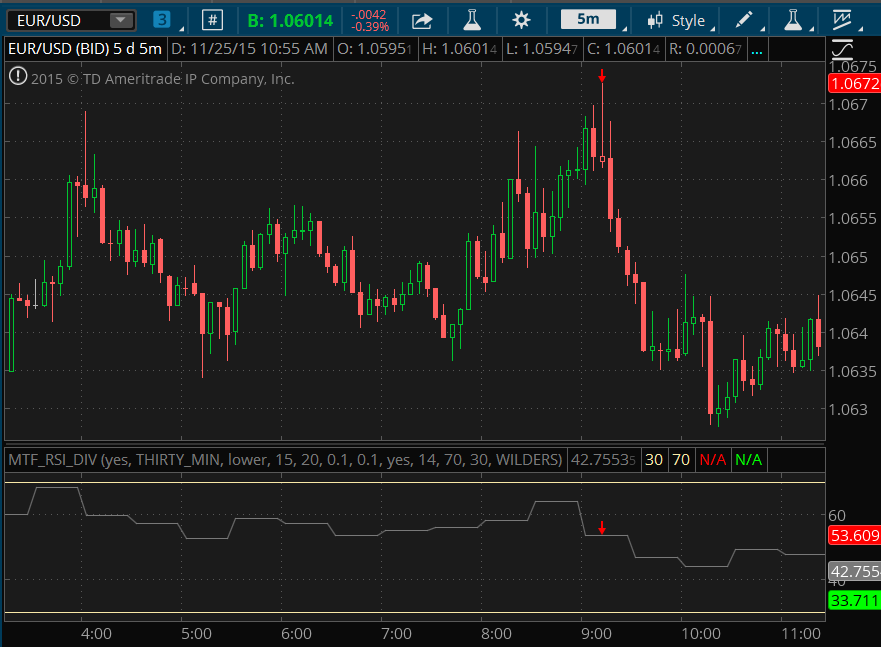
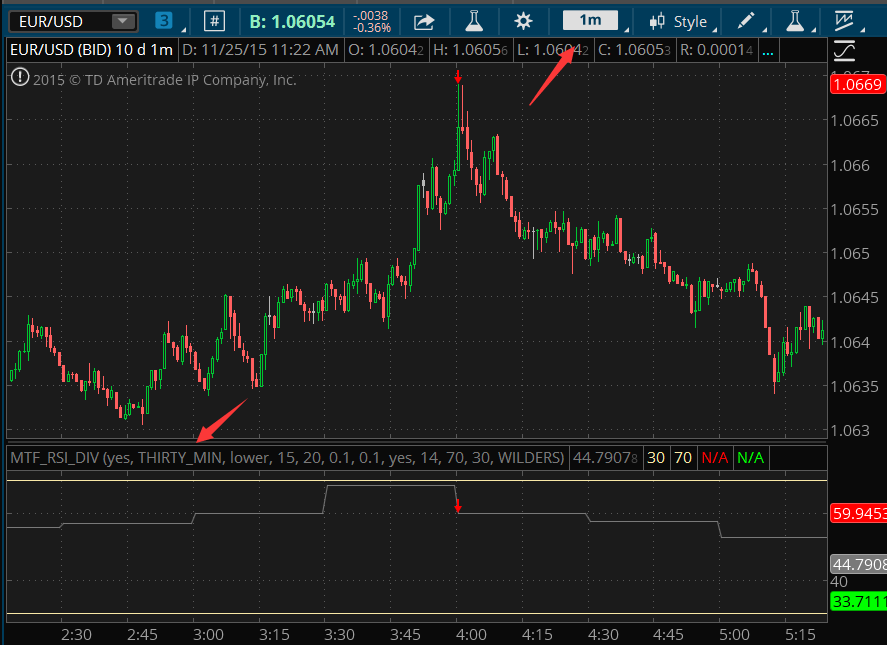
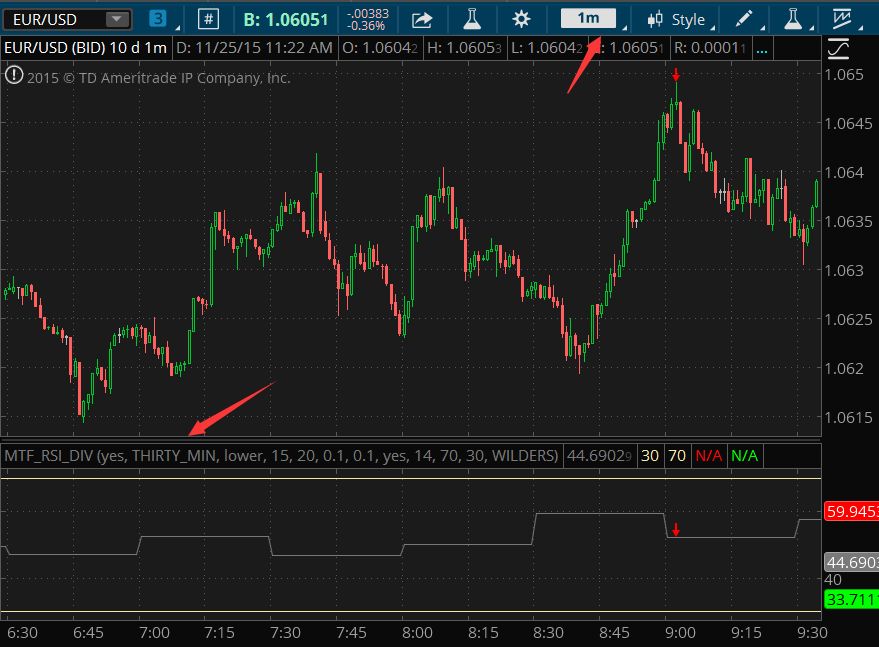
Bearish: Price makes a "Higher High," but the RSI makes a "Lower High." This indicates buying momentum is exhausting, signaling a potential drop.
2. Hidden Divergence (Trend Continuation)
-
Bullish Hidden: Price makes a "Higher Low," but RSI makes a "Lower Low." This often signals that the current uptrend is resetting for its next leg up.
-
Bearish Hidden: Price makes a "Lower High," but RSI makes a "Higher High." This suggests the downtrend is gaining strength after a brief pause.
Practical Trading Strategy: The "Confluence" Approach
To get the most out of the MTF RSI Divergence Indicator, follow this 3-step checklist:
-
Set Your Context: If you are trading on a 5-minute chart, set the indicator's MTF input to 30 minutes or 1 hour.
-
Wait for the Signal: Look for a Bullish Regular Divergence to appear.
-
Confirm with the MTF: Check if the higher timeframe RSI is also in an oversold region or beginning to turn up. When both timeframes align, the probability of a successful trade increases exponentially.
Conclusion
The MTF RSI Divergence Indicator is more than just a momentum tool; it’s a filter for finding clarity in chaotic markets. By combining the precision of divergence with the authority of higher timeframes, you can stop chasing every tick and start trading with the trend.
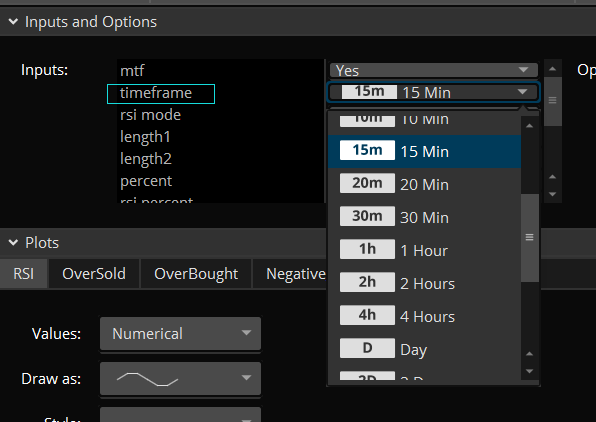
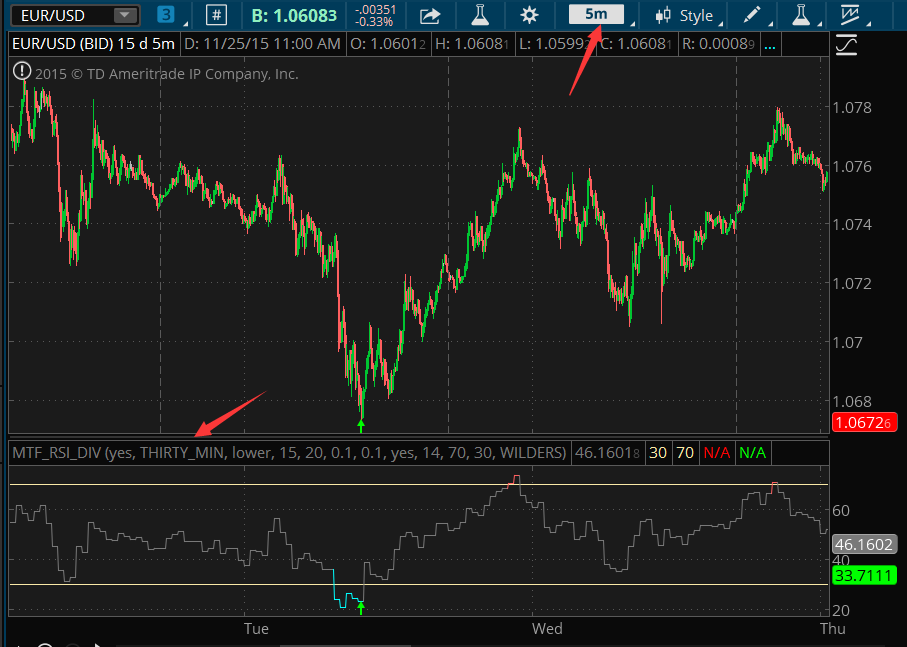
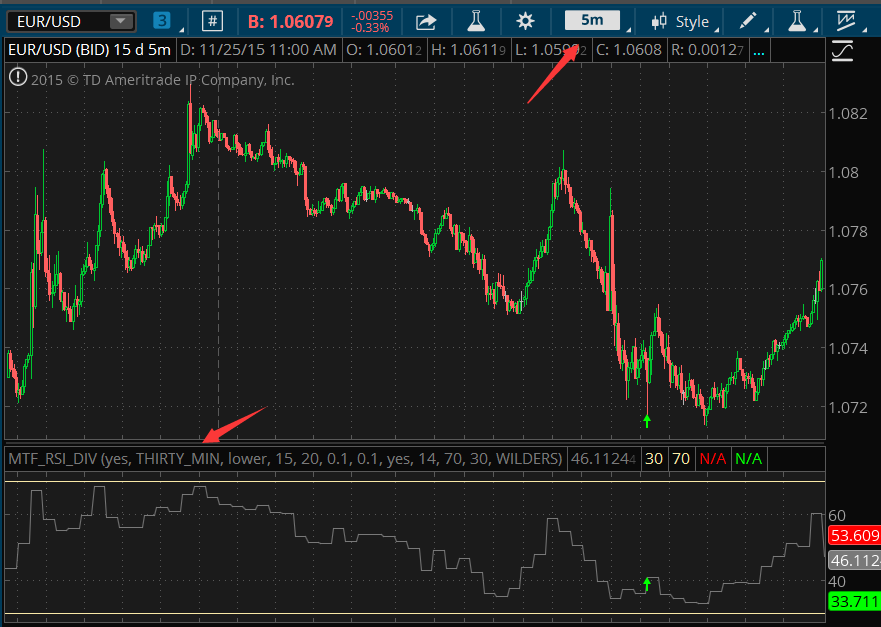
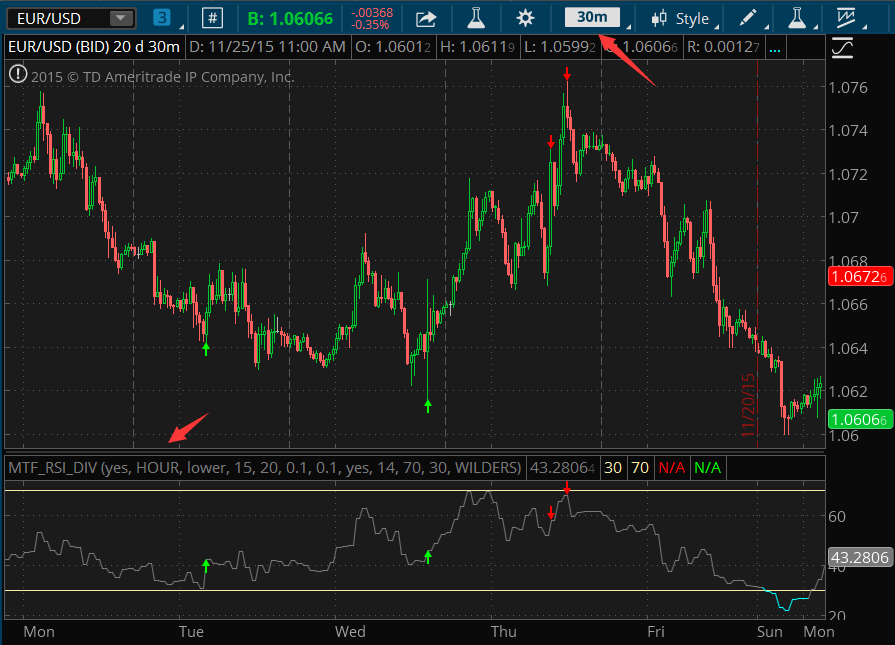
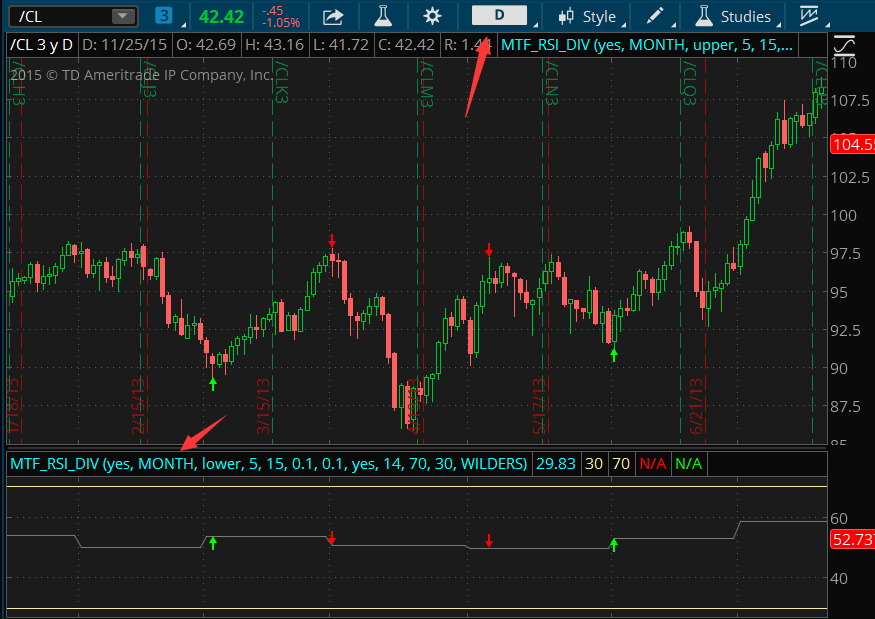
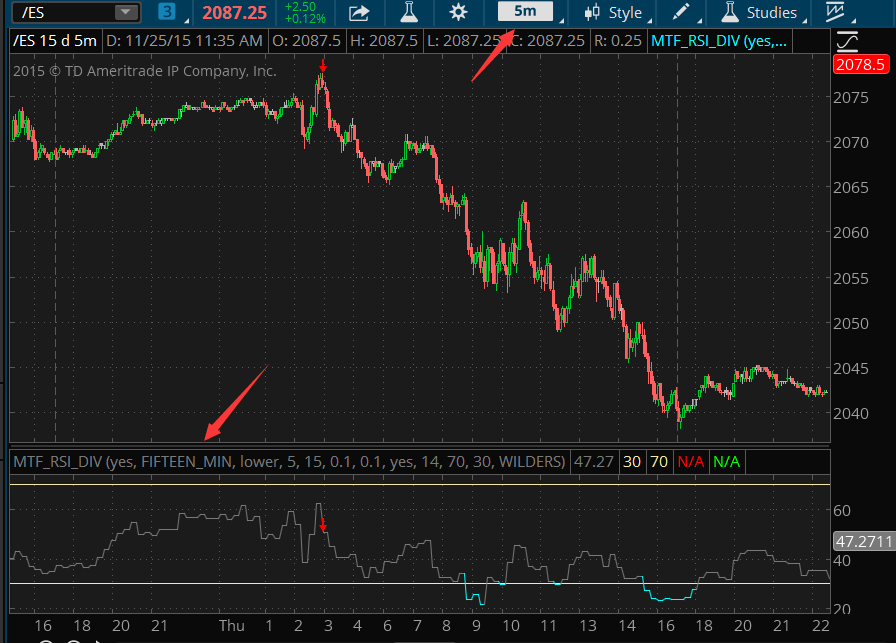
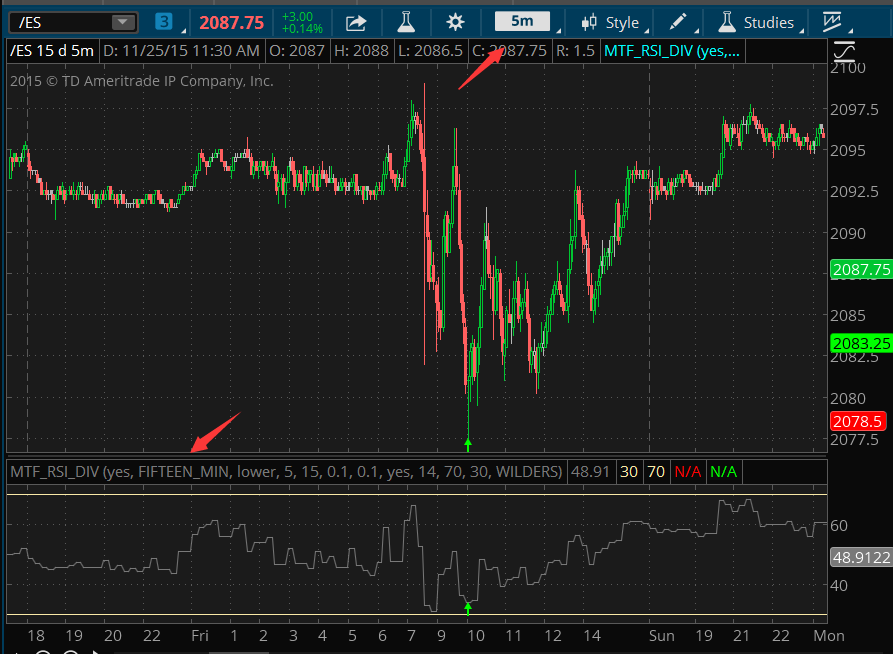
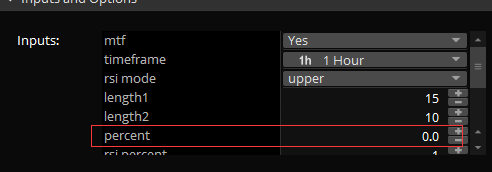
When you use a higher timeframe on a lower one, such as using 1hour on 30 mins chart.
As shown in the picture below.
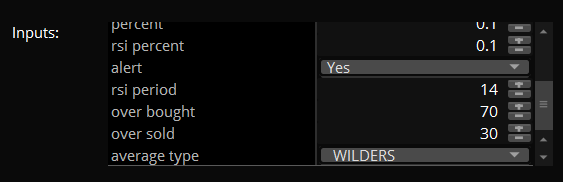
If you want to get more divergence signals, please adjust the percent input to a smaller number.
If you want to get all divergence signals, please adjust the percent input to 0.

Write a review
Your Name:Your Review: Note: HTML is not translated!
Rating: Bad Good
Enter the code in the box below:


Latest


")


Welcome to Patternsmart
Converting your indicator from one platform to another.Custom Alert, Autotrader, Indicators, Scan, Screener, Strategy and Signals.
Copyright @ 2025 Patternsmart - All rights reserved
This website is for educational and informational
purposes only and should not be considered a solicitation to buy or sell a
futures contract or make any other type of investment decision. It's not recommended to use any single indicator as sole evaluation criteria. The companies
and services listed on this website are not to be considered a recommendation
and it is the reader's responsibility to evaluate any product, service, or
company. patternsmart is not responsible for the accuracy or content of any
product, service or company linked to on this website.
Futures trading
contains substantial risk and is not for every investor.Please read the following risk disclosure before considering the
trading of this product:
Futures Risk Disclosure. An investor could
potentially lose all or more than the initial investment. Risk capital is money
that can be lost without jeopardizing ones financial security or life style.
Only risk capital should be used for trading and only those with sufficient risk
capital should consider trading. Past performance is not necessarily indicative
of future results.
Trading stocks, options, futures and forex involves
speculation, and the risk of loss can be substantial.Investor must consider all
relevant risk factors, including their own personal financial situation, before
trading. Trading foreign exchange on margin carries a high level of risk, as
well as its own unique risk factors. Forex investments are subject to
counter-party risk, as there is no central clearing organization for these
transactions. Please read the following risk disclosure before considering the
trading of this product:
Forex Risk Disclosure. Spreads, Straddles, and other multiple-leg option
strategies can entail substantial transaction costs, including multiple
commissions, which may impact any potential return. Options are not suitable for
all investors as the special risks inherent to options trading may expose
investors to potentially rapid and substantial losses. Prior to trading options,
you should carefully read
Characteristics and Risks of Standardized Options.
patternsmart.com
will not be held liable for the loss of money or any damage caused from relying
on the information on this site. Any investment decision you make in your account is solely your responsibility.
TESTIMONIAL DISCLOSURE: TESTIMONIALS APPEARING ON OUR SITE MAY NOT BE REPRESENTATIVE OF THE EXPERIENCE OF OTHER CLIENTS OR CUSTOMERS AND IS NOT A GUARANTEE OF FUTURE PERFORMANCE OR SUCCESS.