
Your shopping cart is empty!
Shopping Cart
0 item(s) - FreeCustomization and Conversion for: Ctrader, MetaTrader(MT4, MT5), Thinkorswim, NinjaTrader, MultiCharts, Tradingview, Prorealtime, SierraChart, etc.
License renew price will be 20% off for the 2nd year and after.
Every Purchase Comes with a Coupon.
Share Your Experience. Help Other Traders Learn. Get Rewarded.
Share Your Experience. Help Other Traders Learn. Get Rewarded.
Featured





DMI Double Divergence Pro Indicator for Tradingview

 (
(Analyze Trend Strength Beyond Price
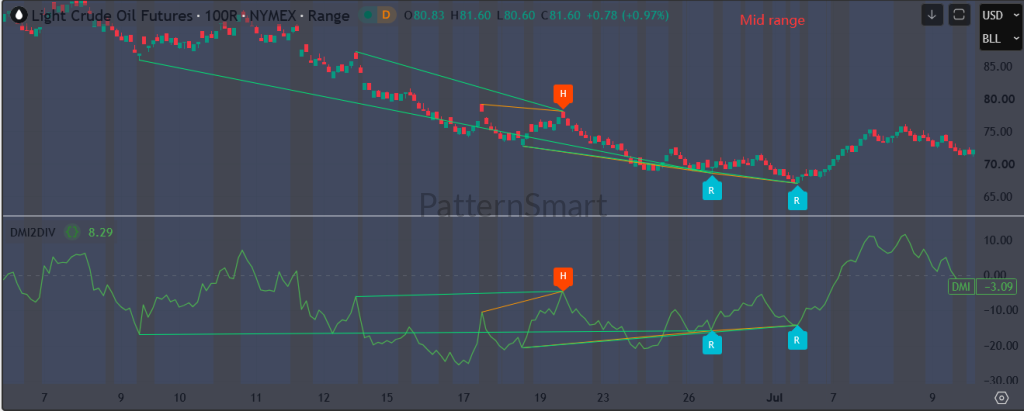
Price trends rarely change direction without subtle shifts in directional strength. The DMI Double Divergence indicator for TradingView helps traders evaluate whether directional movement continues to support price action by combining Directional Movement Index (DMI) analysis with the PatternSmart Double Divergence methodology.
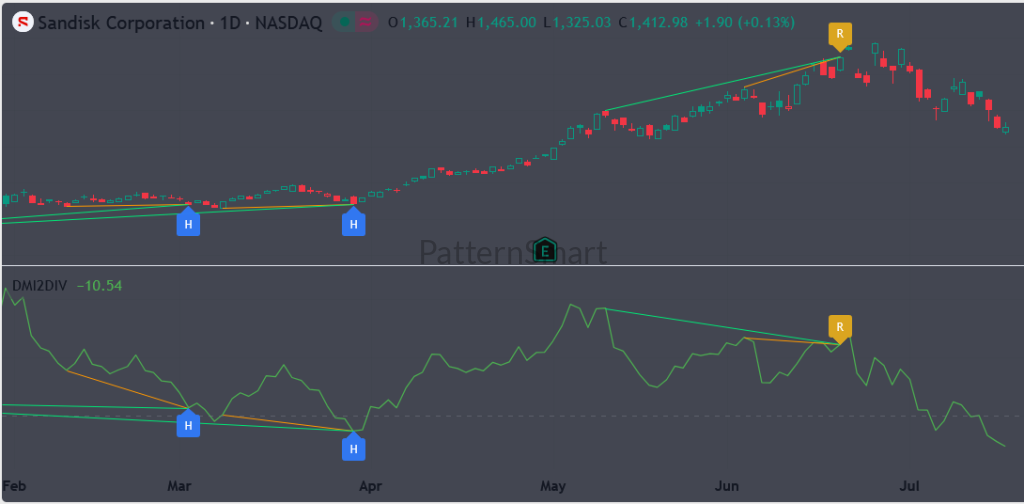
Understanding DMI Divergence
The Directional Movement Index (DMI) evaluates the strength and direction of buying and selling pressure through its directional movement components. Unlike momentum oscillators that primarily measure price acceleration, DMI focuses on the quality and sustainability of an existing trend.
When price continues making new highs or lows while directional movement begins to weaken, the market may be revealing a developing imbalance. Divergence does not predict an immediate reversal, but it may indicate that current price movement deserves closer examination.
Because DMI emphasizes trend strength rather than momentum alone, it is particularly useful for traders who focus on trend continuation, breakout validation, and evolving market structure.
The PatternSmart Double Divergence Methodology
The PatternSmart Double Divergence methodology extends traditional divergence analysis by requiring additional confirmation before a divergence signal is considered complete.
Rather than relying on a single divergence event, the methodology evaluates a sequence of confirmed market behavior to help reduce isolated or low-quality signals. This confirmation-first approach encourages traders to analyze divergence within the broader context of price structure instead of treating every divergence as an automatic trading opportunity.
The result is a disciplined analytical framework that supports probability-based decision making while remaining adaptable across different markets and timeframes.
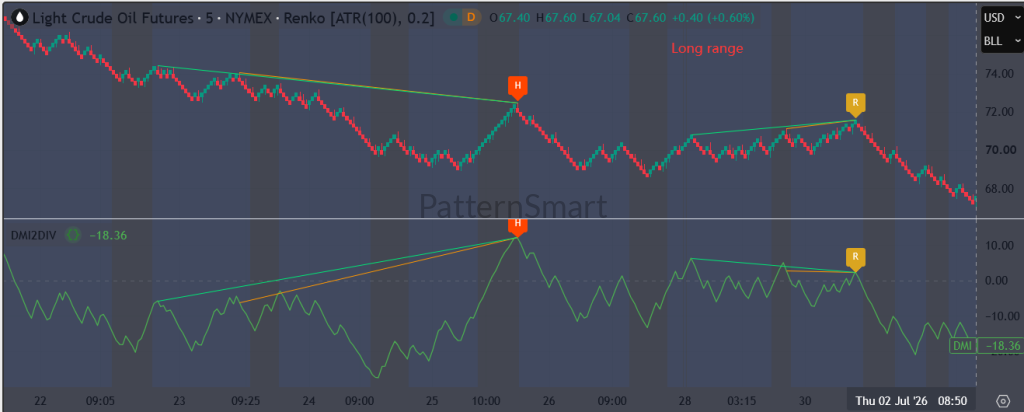
Why Use DMI Double Divergence?
The DMI Double Divergence indicator is designed for traders who want deeper insight into trend quality instead of relying solely on price movement.
It can assist with:
-
Evaluating whether directional strength supports an existing trend.
-
Identifying potential weakening before price visibly changes direction.
-
Confirming trend continuation opportunities.
-
Studying divergence within the context of overall market structure.
-
Supporting discretionary technical analysis with objective visual confirmation.
Like every PatternSmart Double Divergence indicator, it is intended as an analytical tool rather than a standalone trading system.
TradingView Workflow
TradingView provides a flexible cloud-based charting environment that allows traders to analyze markets from virtually any device. Its visual charting tools, customizable layouts, and broad market coverage make it well suited for discretionary technical analysis. The DMI Double Divergence indicator integrates naturally into this workflow, allowing traders to study divergence alongside price action, trend structure, and other chart-based analysis.
Key Features
The TradingView edition includes configurable options that allow traders to tailor the indicator to their preferred analytical workflow while preserving the underlying Double Divergence methodology.
Key capabilities include:
-
Regular Bullish signal display
-
Regular Bearish signal display
-
Hidden Bullish signal display
-
Hidden Bearish signal display
-
Configurable alert support
-
Adjustable alert sound
-
Optional divergence lines
-
Optional chart labels
-
Only Show Last Signal Within Bars setting to help reduce chart clutter
These configuration options influence visualization and notification behavior without altering the core analytical methodology.
Practical Benefits
Experienced traders often combine DMI Double Divergence with broader market analysis rather than using it in isolation.
Potential applications include:
-
Evaluating the quality of developing trends.
-
Confirming weakening directional movement before major price swings.
-
Comparing trend strength across multiple markets.
-
Supporting breakout analysis with additional confirmation.
-
Maintaining a consistent analytical process across different timeframes.
Because every market is unique, divergence should always be interpreted alongside price action, support and resistance, and overall market context.
Frequently Asked Questions
What makes DMI different from momentum-based divergence indicators?
DMI measures directional movement and trend strength rather than pure price momentum, making it especially useful when evaluating the quality of trending markets.
Does divergence guarantee a reversal?
No. Divergence is a form of analytical evidence, not a prediction. The PatternSmart methodology emphasizes confirmation before interpreting a completed divergence signal.
Which markets can I analyze?
The indicator can be applied to any market available on TradingView, including stocks, futures, forex, cryptocurrencies, and indices.
Can I customize which signals are displayed?
Yes. Individual Regular and Hidden Bullish and Bearish divergence signals can be enabled or disabled, allowing the display to match your analytical preferences.
Are alerts available?
Yes. Alert functionality can notify you after confirmed divergence signals, helping you monitor multiple charts more efficiently.
Conclusion
Understanding trend strength requires more than observing price alone. By combining the Directional Movement Index with the PatternSmart Double Divergence methodology, traders gain an additional perspective on whether directional movement continues to support the prevailing market trend.
Rather than attempting to predict market direction, the DMI Double Divergence indicator is designed to help traders evaluate confirmation, trend quality, and developing market structure within a disciplined technical analysis process.
Looking for the complete mathematical breakdown, step-by-step optimization guides, and advanced trading strategies? Explore our comprehensive documentation:
-
Read the master guide on the Double Divergence Indicator Series.
-
Visit the Technical Inputs Manual: Double Divergence Pro for full parameter tuning.
Write a review
Your Name:Your Review: Note: HTML is not translated!
Rating: Bad Good
Enter the code in the box below:

Latest

Welcome to Patternsmart
Converting your indicator from one platform to another.Custom Alert, Autotrader, Indicators, Scan, Screener, Strategy and Signals.
Copyright @ 2026 Patternsmart - All rights reserved
This website is for educational and informational
purposes only and should not be considered a solicitation to buy or sell a
futures contract or make any other type of investment decision. It's not recommended to use any single indicator as sole evaluation criteria. The companies
and services listed on this website are not to be considered a recommendation
and it is the reader's responsibility to evaluate any product, service, or
company. patternsmart is not responsible for the accuracy or content of any
product, service or company linked to on this website.
Futures trading
contains substantial risk and is not for every investor.Please read the following risk disclosure before considering the
trading of this product:
Futures Risk Disclosure. An investor could
potentially lose all or more than the initial investment. Risk capital is money
that can be lost without jeopardizing ones financial security or life style.
Only risk capital should be used for trading and only those with sufficient risk
capital should consider trading. Past performance is not necessarily indicative
of future results.
Trading stocks, options, futures and forex involves
speculation, and the risk of loss can be substantial.Investor must consider all
relevant risk factors, including their own personal financial situation, before
trading. Trading foreign exchange on margin carries a high level of risk, as
well as its own unique risk factors. Forex investments are subject to
counter-party risk, as there is no central clearing organization for these
transactions. Please read the following risk disclosure before considering the
trading of this product:
Forex Risk Disclosure. Spreads, Straddles, and other multiple-leg option
strategies can entail substantial transaction costs, including multiple
commissions, which may impact any potential return. Options are not suitable for
all investors as the special risks inherent to options trading may expose
investors to potentially rapid and substantial losses. Prior to trading options,
you should carefully read
Characteristics and Risks of Standardized Options.
patternsmart.com
will not be held liable for the loss of money or any damage caused from relying
on the information on this site. Any investment decision you make in your account is solely your responsibility.
TESTIMONIAL DISCLOSURE: TESTIMONIALS APPEARING ON OUR SITE MAY NOT BE REPRESENTATIVE OF THE EXPERIENCE OF OTHER CLIENTS OR CUSTOMERS AND IS NOT A GUARANTEE OF FUTURE PERFORMANCE OR SUCCESS.