
Your shopping cart is empty!
Shopping Cart
0 item(s) - FreeCustomization and Conversion for: Ctrader, MetaTrader(MT4, MT5), Thinkorswim, NinjaTrader, MultiCharts, Tradingview, Prorealtime, SierraChart, etc.
License renew price will be 20% off for the 2nd year and after.
Every Purchase Comes with a Coupon.
Share Your Experience. Help Other Traders Learn. Get Rewarded.
Share Your Experience. Help Other Traders Learn. Get Rewarded.
Featured




Bearish Candlestick Pattern Indicator for NinjaTrader 8

 (
(Bearish Candlestick Pattern Indicator for NinjaTrader 8
Recognizing high-quality bearish candlestick patterns in real time can be challenging, especially when multiple formations develop across different markets and timeframes. The Bearish Candlestick Pattern Indicator for NinjaTrader 8 automatically identifies a comprehensive collection of classical bearish reversal and continuation patterns, highlights them directly on the price chart, and provides optional visual and audio notifications so traders never miss important price action opportunities.
This product description is based on the indicator's functionality as implemented in the provided source code.
Detect Multiple Bearish Candlestick Patterns Automatically
Instead of manually scanning every candle, the indicator continuously monitors price action and identifies a wide range of established bearish candlestick formations. When a valid pattern appears, the corresponding candles are highlighted directly on the chart and can be labeled for immediate recognition.
The indicator includes support for:
-
Advance Block
-
Dark Cloud Cover
-
Deliberation
-
Downside Gap Three Methods
-
Downside Tasuki Gap
-
Evening Doji Star
-
Evening Star
-
Falling Three Methods
-
Hanging Man
-
Identical Three Crows
-
In Neck
-
On Neck
-
Shooting Star
-
Three Black Crows
-
Three Inside Down
-
Three Outside Down
-
Thrusting
-
Two Crows
-
Upside Gap Two Crows
This extensive pattern library allows traders to monitor numerous bearish market structures using a single indicator rather than switching between multiple tools.
Designed for Price Action Traders
Candlestick analysis remains one of the most widely used approaches for identifying potential shifts in market sentiment. However, accurately recognizing multi-candle formations requires experience and constant attention.
This indicator removes much of the manual workload by:
-
Continuously evaluating incoming price bars
-
Identifying completed bearish patterns automatically
-
Highlighting qualifying candles
-
Displaying concise pattern abbreviations
-
Generating optional real-time alerts
The result is a cleaner workflow that allows traders to focus on market context and trade management instead of searching for patterns manually.
Clear Visual Identification
Every detected pattern is displayed directly on the price chart using customizable colors.
Visual features include:
-
Color-highlighted pattern candles
-
Pattern abbreviation displayed above or below the candle
-
Individually configurable colors for each pattern
-
Overlay display without requiring a separate indicator panel
Because every pattern uses its own visual style, traders can quickly distinguish between different bearish formations while reviewing historical charts or monitoring live markets.
Flexible Pattern Selection
Different traders prefer different candlestick formations.
Instead of forcing every pattern to remain active, the indicator allows each pattern to be enabled or disabled independently.
This flexibility makes it possible to:
-
Monitor only preferred setups
-
Reduce chart clutter
-
Build a personalized trading workspace
-
Focus on specific market conditions
Trend-Aware Pattern Recognition
Many bearish candlestick formations are most meaningful after an established upward move or within specific market conditions. The indicator evaluates trend context before confirming qualifying patterns, helping reduce signals that occur in less relevant market environments.
This allows traders to concentrate on higher-quality bearish price action rather than every isolated candle formation.
Audio Alerts
Markets move quickly, and traders cannot always watch every chart.
Optional audio alerts notify you whenever a qualifying bearish pattern appears in real time.
Benefits include:
-
No need to constantly monitor charts
-
Faster reaction to new opportunities
-
Suitable for multi-chart workspaces
-
Customizable alert sound selection
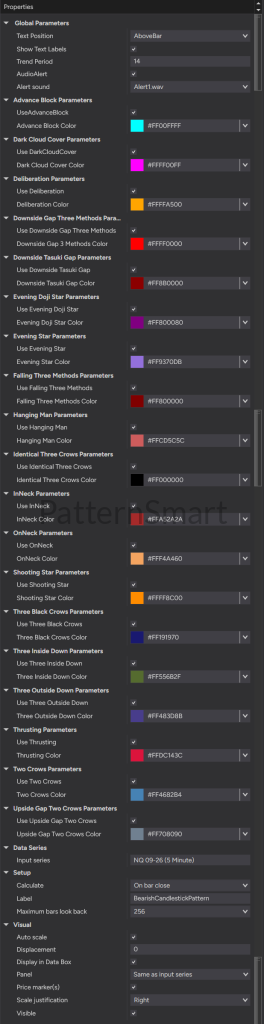
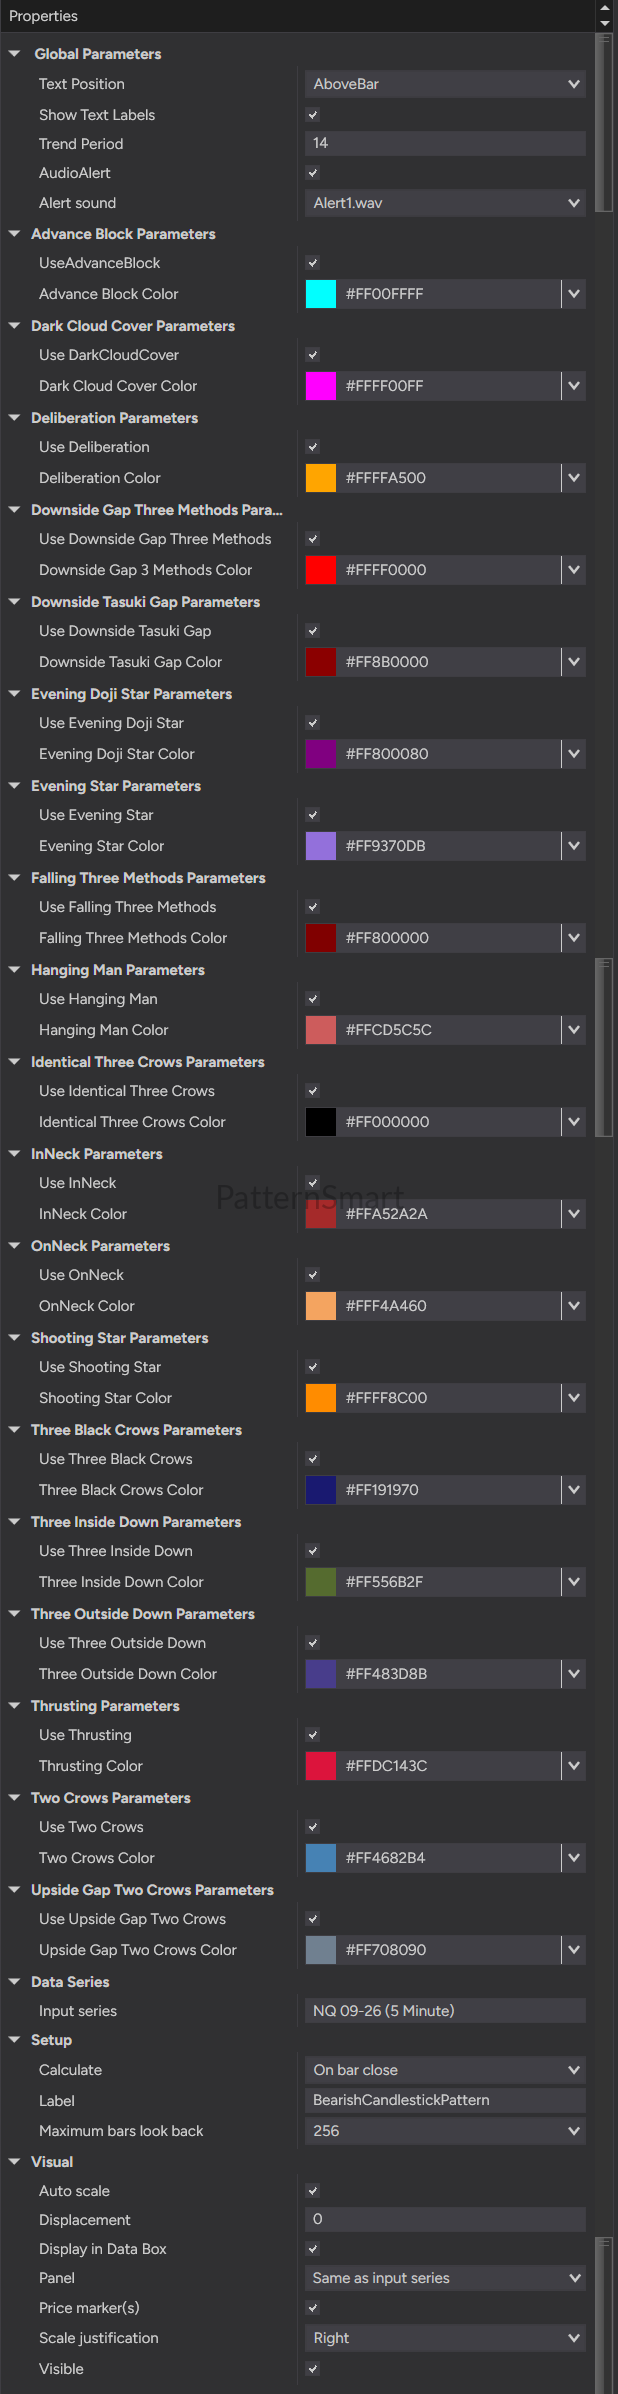
Customizable Display
The indicator offers numerous display options to match individual trading preferences.
Available customization includes:
-
Show or hide pattern labels
-
Position labels above or below price bars
-
Enable or disable audio alerts
-
Customize colors for every individual pattern
-
Configure the trend period used by the indicator
These options make the indicator suitable for both minimalist chart layouts and highly customized trading workspaces.
Ideal For
This indicator is suitable for traders who use:
-
Price action analysis
-
Candlestick trading strategies
-
Swing trading
-
Day trading
-
Futures
-
Forex
-
Stocks
-
CFDs
-
Cryptocurrency markets
Because it works directly from price data, it can be applied to virtually any instrument supported by NinjaTrader 8.
Key Features
-
Detects 19 well-known bearish candlestick patterns automatically
-
Highlights qualifying candles directly on the chart
-
Displays optional pattern labels
-
Individual enable/disable controls for every pattern
-
Custom colors for each pattern
-
Optional real-time audio alerts
-
Trend-aware pattern validation
-
Clean overlay design
-
Compatible with all NinjaTrader 8 supported markets
-
Suitable for discretionary price action trading
Why Use This Indicator?
Manual candlestick analysis becomes increasingly difficult when monitoring multiple instruments or timeframes simultaneously.
The Bearish Candlestick Pattern Indicator automates the identification process while keeping the chart clean and easy to interpret. Rather than spending valuable time searching for developing formations, traders receive immediate visual confirmation whenever a supported bearish pattern is completed.
This improves consistency, reduces missed opportunities, and streamlines chart analysis.
Frequently Asked Questions
Does the indicator generate buy or sell orders?
No. The indicator identifies bearish candlestick patterns and leaves all trading decisions to the trader.
Can individual patterns be disabled?
Yes. Every supported pattern can be enabled or disabled independently.
Can I customize the colors?
Yes. Each pattern has its own configurable highlight color.
Does it provide alerts?
Yes. Optional audio alerts can notify you whenever a qualifying pattern is detected.
Are labels optional?
Yes. Pattern text labels can be turned on or off, and their position can be displayed above or below the price bars.
Which markets are supported?
The indicator can be used on any market available within NinjaTrader 8, including futures, stocks, forex, indices, and cryptocurrencies.
Improve Your Bearish Price Action Analysis
The Bearish Candlestick Pattern Indicator for NinjaTrader 8 combines comprehensive bearish pattern recognition with flexible customization and real-time chart visualization. Whether you are reviewing historical charts or monitoring live markets, it helps you identify important bearish candlestick formations quickly and consistently, allowing you to spend more time evaluating trade opportunities and less time searching for patterns manually.
Explore our complete collection of technical analysis guides, trading insights, and in-depth research on the Bearish Candlestick Pattern Indicator.
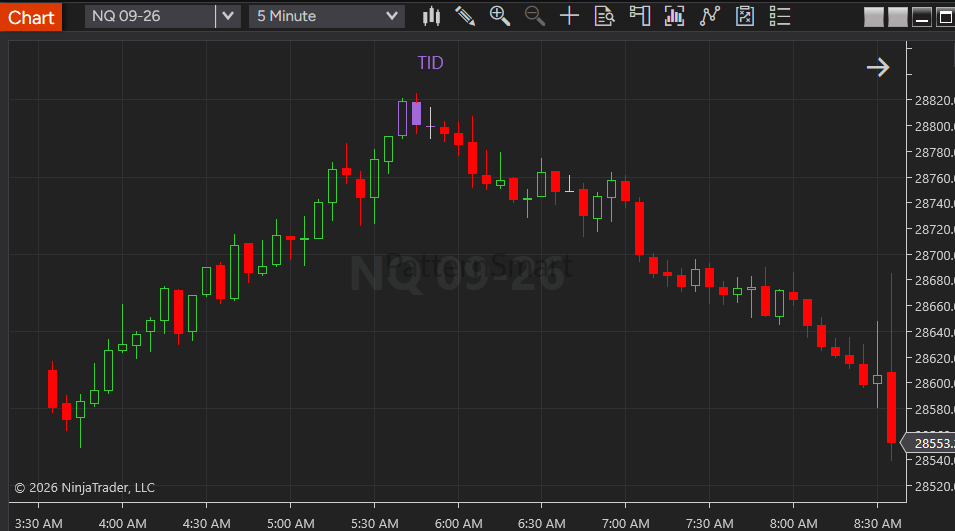
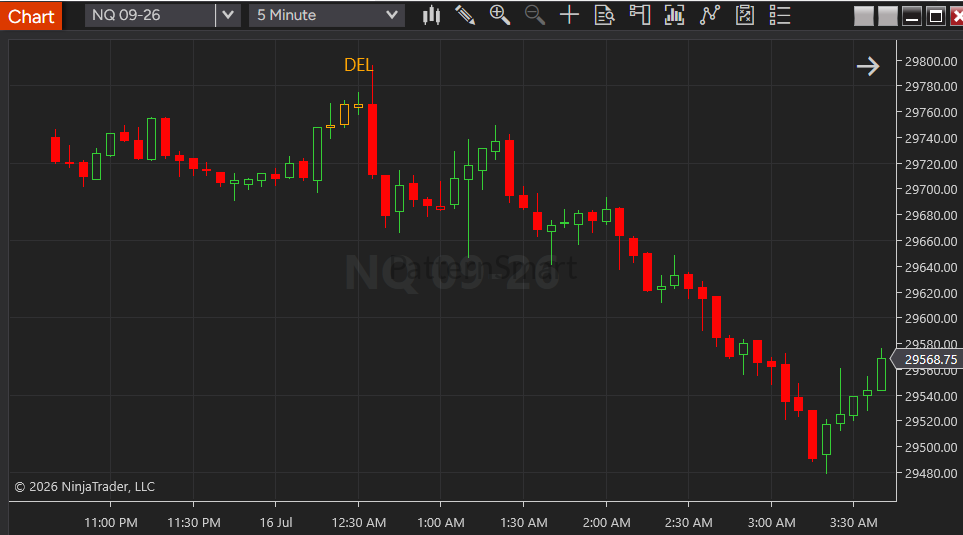
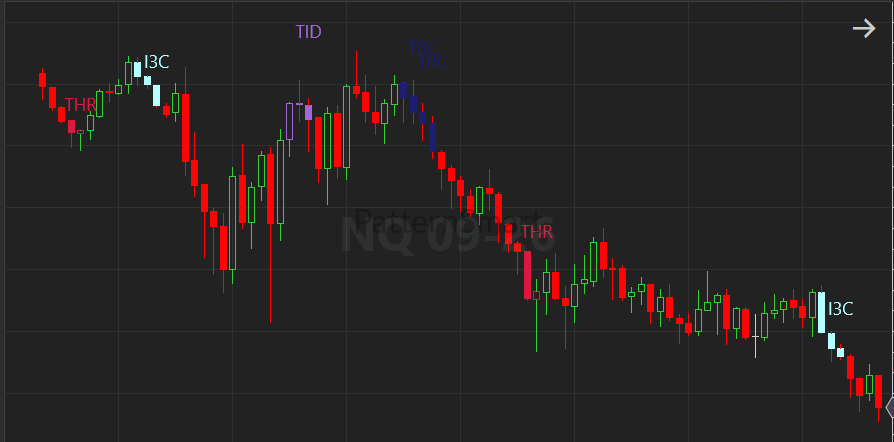
As shown in the chart below, if the Three Inside Down pattern is detected, it will show the abbreviation as TID on chart.
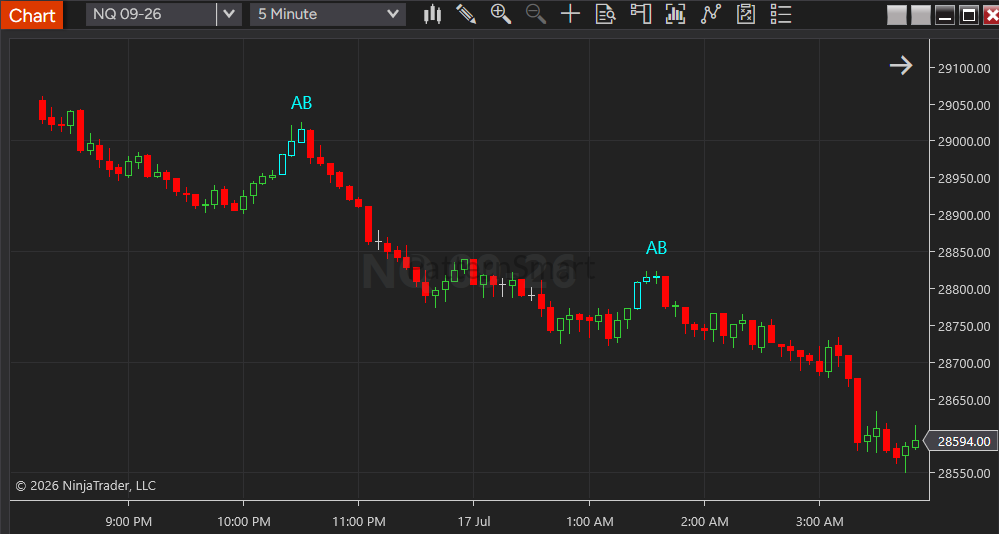
If the AdvanceBlock pattern is detected, it will show the abbreviation as AB on chart.
Write a review
Your Name:Your Review: Note: HTML is not translated!
Rating: Bad Good
Enter the code in the box below:


Latest

Welcome to Patternsmart
Converting your indicator from one platform to another.Custom Alert, Autotrader, Indicators, Scan, Screener, Strategy and Signals.
Copyright @ 2026 Patternsmart - All rights reserved
This website is for educational and informational
purposes only and should not be considered a solicitation to buy or sell a
futures contract or make any other type of investment decision. It's not recommended to use any single indicator as sole evaluation criteria. The companies
and services listed on this website are not to be considered a recommendation
and it is the reader's responsibility to evaluate any product, service, or
company. patternsmart is not responsible for the accuracy or content of any
product, service or company linked to on this website.
Futures trading
contains substantial risk and is not for every investor.Please read the following risk disclosure before considering the
trading of this product:
Futures Risk Disclosure. An investor could
potentially lose all or more than the initial investment. Risk capital is money
that can be lost without jeopardizing ones financial security or life style.
Only risk capital should be used for trading and only those with sufficient risk
capital should consider trading. Past performance is not necessarily indicative
of future results.
Trading stocks, options, futures and forex involves
speculation, and the risk of loss can be substantial.Investor must consider all
relevant risk factors, including their own personal financial situation, before
trading. Trading foreign exchange on margin carries a high level of risk, as
well as its own unique risk factors. Forex investments are subject to
counter-party risk, as there is no central clearing organization for these
transactions. Please read the following risk disclosure before considering the
trading of this product:
Forex Risk Disclosure. Spreads, Straddles, and other multiple-leg option
strategies can entail substantial transaction costs, including multiple
commissions, which may impact any potential return. Options are not suitable for
all investors as the special risks inherent to options trading may expose
investors to potentially rapid and substantial losses. Prior to trading options,
you should carefully read
Characteristics and Risks of Standardized Options.
patternsmart.com
will not be held liable for the loss of money or any damage caused from relying
on the information on this site. Any investment decision you make in your account is solely your responsibility.
TESTIMONIAL DISCLOSURE: TESTIMONIALS APPEARING ON OUR SITE MAY NOT BE REPRESENTATIVE OF THE EXPERIENCE OF OTHER CLIENTS OR CUSTOMERS AND IS NOT A GUARANTEE OF FUTURE PERFORMANCE OR SUCCESS.