
Your shopping cart is empty!
Shopping Cart
0 item(s) - FreeCustomization and Conversion for: Ctrader, MetaTrader(MT4, MT5), Thinkorswim, NinjaTrader, MultiCharts, Tradingview, Prorealtime, SierraChart, etc.
License renew price will be 20% off for the 2nd year and after.
Every Purchase Comes with a Coupon.
Share Your Experience. Help Other Traders Learn. Get Rewarded.
Share Your Experience. Help Other Traders Learn. Get Rewarded.
Featured



CCI Double Divergence Pro for Sierra Chart


 (
(Introduction: The Challenge of Timing Extended Market Movements
Every technical analyst encounters situations where price advances or declines far beyond historical averages. During these extended price swings, traders frequently face a difficult decision: Is the current movement supported by genuine underlying participation, or has price reached an unsustainable statistical extreme?
In experienced market analysis, attempting to guess an exact turning point based solely on price movement is notoriously unreliable. Price can remain extended longer than expected, making unconfirmed counter-trend decisions risky.
The Commodity Channel Index (CCI) was specifically designed to evaluate how far price has deviated from its statistical average. However, simply observing when an oscillator enters extreme territory is rarely enough to form a complete analytical picture.
The PatternSmart CCI Double Divergence Indicator for Sierra Chart solves this challenge by combining statistical price deviation analysis with PatternSmart’s confirmation-based Double Divergence methodology. Operating within Sierra Chart's high-performance charting engine, this professional technical analysis tool helps traders evaluate market extremes, recognize mean-reversion setups, and confirm potential momentum transitions with greater analytical confidence.
Understanding Price Deviation and the Commodity Channel Index
To effectively analyze divergence, it is essential to first understand what the underlying technical indicator measures.
Developed by Donald Lambert, the Commodity Channel Index (CCI) measures the deviation of a security's price from its statistical moving average. Unlike traditional momentum oscillators that are bounded between 0 and 100, CCI is an unbounded oscillator centered around a zero line.
-
Calculated Values Near Zero: Indicate that price is trading close to its statistical average.
-
Positive Readings (e.g., above +100): Suggest that price is trading significantly higher than its historical average.
-
Negative Readings (e.g., below -100): Suggest that price is trading significantly lower than its historical average.
When price moves rapidly in one direction, CCI expands outward, signaling that price is stretched relative to its statistical baseline.
However, an extended CCI reading alone does not mean price will immediately reverse. In powerful trends, price can continue driving higher or lower while CCI remains at extreme levels.
True analytical insight develops when price continues creating new structural highs or lows, but CCI fails to mirror that expansion. This disagreement—known as divergence—signals that while price appears strong on the surface, its statistical momentum is beginning to normalize.
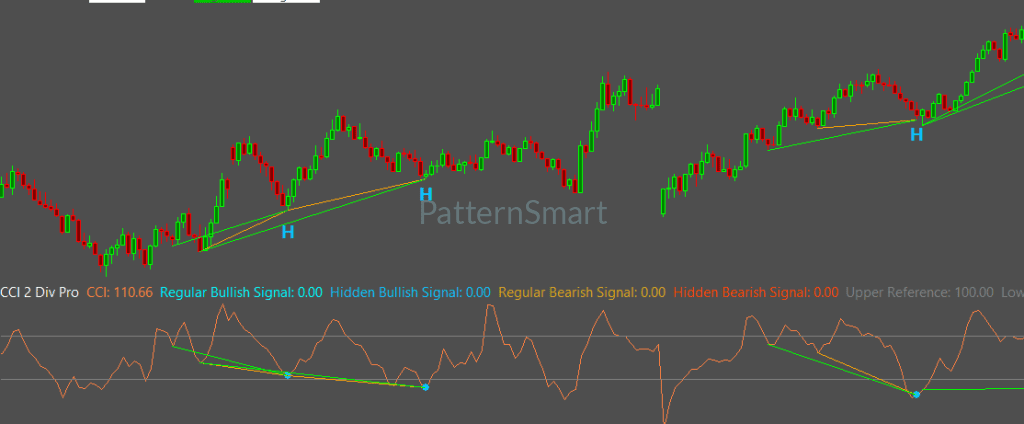
The Double Divergence Methodology: Confirmation Over Prediction
In traditional technical analysis, a single divergence between price and an oscillator is often viewed as a standalone observation. However, isolated signals can be sensitive to market noise, leading to inconsistent interpretations during volatile conditions.
The PatternSmart Double Divergence methodology introduces a structured, confirmation-first framework designed to evaluate market behavior more objectively.
Observation vs. Prediction
Divergence represents an analytical observation, not a predictive guarantee. It informs traders that price action and the selected indicator are no longer operating in complete agreement.
Probability and Evidence
Financial markets are inherently probabilistic. Double Divergence seeks to accumulate multiple layers of technical evidence to strengthen analytical confidence before conclusions are formed.
Context Matters
Divergence carries the most weight when interpreted alongside broader market structure, key support and resistance levels, and overall trend context.
Rather than predicting guaranteed market reversals, the Double Divergence methodology compares multiple historical price points and indicator swing structures to filter out weak observations. By requiring structural agreement across multiple anchor points, the indicator identifies situations where momentum is genuinely deteriorating beneath extended price movement.
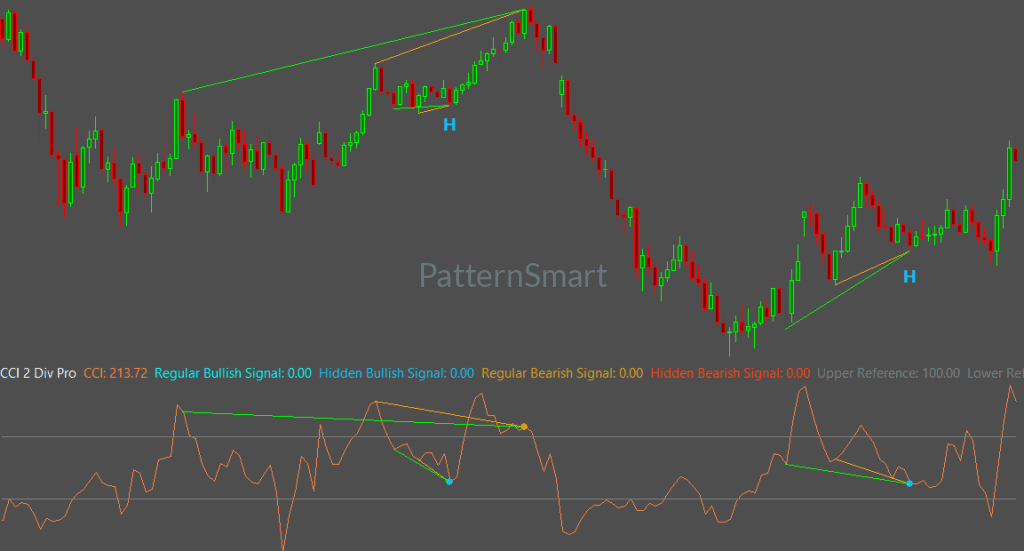
Signal Classifications
The indicator categorizes market observations into four distinct signal types:
-
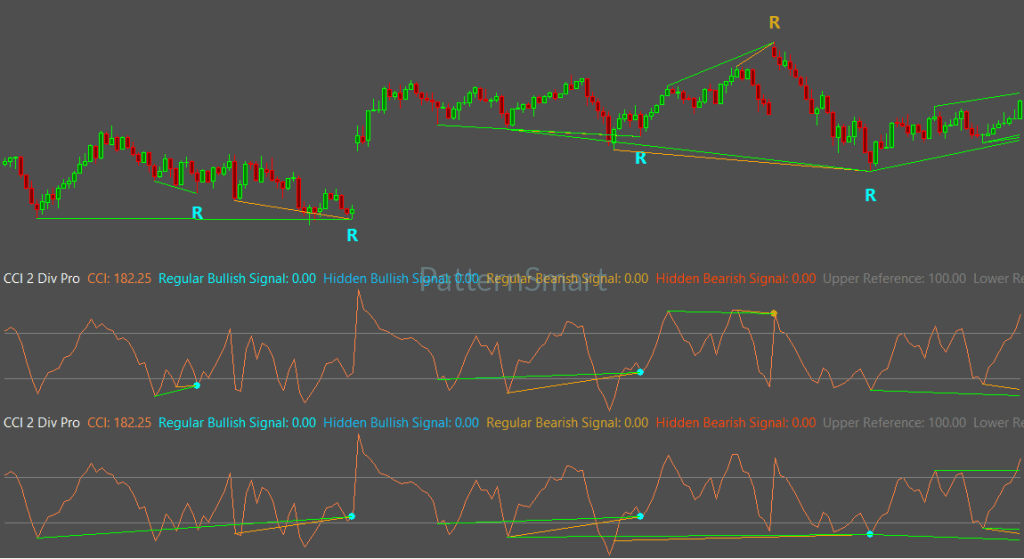
Bullish Regular Divergence: Price forms a lower low while CCI forms a higher low. This observation suggests that downward momentum is weakening, signaling potential mean-reversion or a bullish reversal.
-
Bearish Regular Divergence: Price forms a higher high while CCI forms a lower high. This suggests that upward momentum is deteriorating, highlighting potential exhaustion near market extremes.
-
Bullish Hidden Divergence: Price forms a higher low while CCI forms a lower low. This frequently occurs during temporary pullbacks within an established uptrend, offering evidence of underlying trend continuation.
-
Bearish Hidden Divergence: Price forms a lower high while CCI forms a higher high. This often develops during temporary upward bounces within an established downtrend, supporting trend continuation analysis.
Regular Bearish Divergence (Market Extremes)
Price:     [Higher High]  ---> Momentum Exhaustion
CCI:       [Lower High]   ---> Momentum Deterioration

Regular Bullish Divergence (Mean Reversion)
Price:     [Lower Low]    ---> Price Extended
CCI:       [Higher Low]   ---> Underlying Buying Support
High-Performance Integration for Sierra Chart
Sierra Chart is recognized throughout the industry for its exceptional execution speed, high-performance charting capabilities, and precise data processing. Professional futures and equity traders rely on Sierra Chart because it handles complex calculations effortlessly.
The PatternSmart CCI Double Divergence Indicator is natively engineered to integrate seamlessly into the Sierra Chart environment:
-
Engineered for Speed: Built to take advantage of Sierra Chart’s high-performance architecture, evaluating multi-bar historical divergence structures in real time without lagging chart redrawn cycles.
-
Custom Workspace Flexibility: Integrates cleanly with Sierra Chart’s sub-graphs, custom chart studies, and control panels, ensuring your workspace remains organized and uncluttered.
-
Precision Chart Visualization: Draws crisp divergence trendlines directly on price charts and sub-graphs, allowing traders to evaluate historical swing points instantly without manual drawing tools.
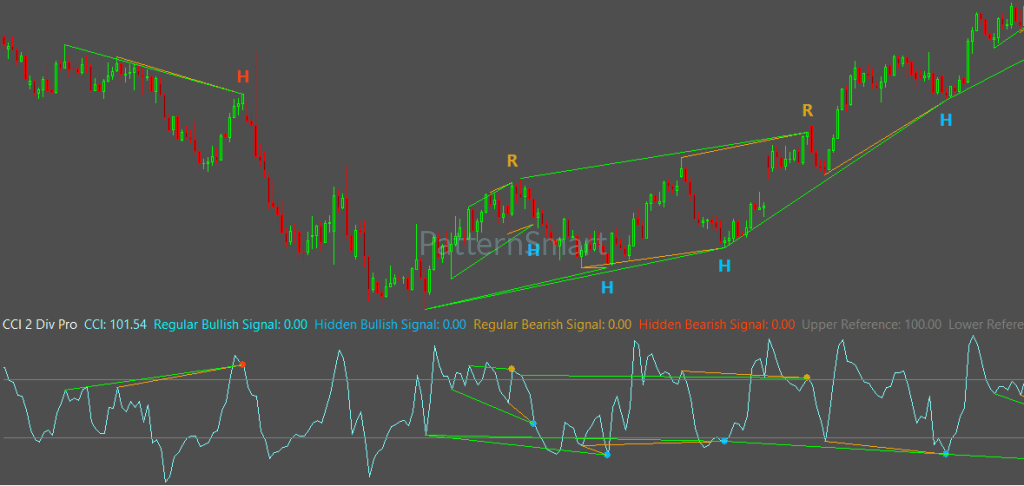
Key Indicator Features and Configuration
The PatternSmart CCI Double Divergence Indicator includes a suite of configurable features documented in the official Double Divergence Pro Inputs Manual. These features allow traders to customize signal timing, structural validation, and chart display according to their analytical requirements.
Core Configurable Features
-
Wait 1 Bar (
Default: True): Belongs to the Signal Generation category. When enabled, the indicator requires one completed bar after divergence detection before finalizing the signal. This adds confirmation and prevents premature signal confirmation during live, incomplete bar updates. -
Enhanced Mode (
Default: False): Belongs to the Signal Filtering category. Applies an additional layer of structural and geometric validation between historical divergence anchor points. Enabling Enhanced Mode filters out lower-quality signals, placing greater emphasis on high-conviction structural patterns. -
Divergence Bar Range (
Default: ShortRange): An Advanced Parameter that defines the historical search boundaries for divergence anchor points. Options includeShortRange,MidRange, andLongRangeto adapt the structural search to different chart intervals and market cycles. -
Divergence Lookback (
Default: 5): An Advanced Parameter that controls the number of historical bars evaluated when identifying local swing highs and swing lows for divergence analysis. -
Alerts and Notifications (
Default: True): Belongs to the Alerts & Notifications category. Triggers Sierra Chart's native audio and visual notifications (Alert Sound) immediately upon signal confirmation, ensuring traders stay informed of developing setups without constantly monitoring every window.
Practical Analytical Benefits for Traders
Integrating the PatternSmart CCI Double Divergence Indicator into your daily analysis provides clear, practical advantages:
-
Objective Identification of Market Extremes: Removes subjective guesswork when evaluating statistically extended price movements.
-
Improved Reversal and Mean-Reversion Timing: Highlights situations where price continues moving in one direction while CCI momentum begins normalizing toward equilibrium.
-
Streamlined Chart Analysis: Replaces manual line drawing with automatic, real-time divergence detection and clear visual mapping.
-
Noise Reduction through Confirmation: Settings like
Enhanced ModeandWait 1 Barhelp reduce chart noise, allowing you to focus on high-quality technical evidence. -
Disciplined Decision-Making: Encourages a structured workflow—moving from market observation to technical confirmation before taking action.
Frequently Asked Questions
What does the CCI Double Divergence Indicator measure best?
The indicator evaluates price deviation and mean-reversion potential. It is particularly effective at identifying statistical market extremes and cyclical momentum shifts in range-bound or overextended markets.
What is the difference between Regular and Hidden CCI Divergence?
Regular divergence signals potential momentum exhaustion and trend reversals (e.g., higher price highs with lower CCI highs). Hidden divergence signals potential trend continuation following pullbacks (e.g., higher price lows with lower CCI lows).
Does this indicator require manual drawing on Sierra Chart?
No. The indicator automatically identifies valid price and indicator swing points, calculates divergence conditions, and draws visual confirmation lines directly on your Sierra Chart workspace.
Can I adjust the indicator for different chart timeframes?
Yes. By configuring settings such as Divergence Bar Range and Divergence Lookback, you can easily adapt the structural search distance to suit tick charts, minute intervals, or daily timeframes.
Conclusion: Elevate Your Technical Analysis
Evaluating extended market conditions requires a balance between price observation and momentum confirmation. By measuring how far price has deviated from statistical norms, the Commodity Channel Index provides a unique window into market extremes. Combined with PatternSmart's Double Divergence methodology, it becomes a powerful framework for evaluating cyclical turning points and mean-reversion opportunities.
The PatternSmart CCI Double Divergence Indicator for Sierra Chart equips traders with an objective, high-performance tool designed to strengthen technical analysis and encourage disciplined decision-making.
Looking for the complete mathematical breakdown, step-by-step optimization guides, and advanced trading strategies? Explore our comprehensive documentation:
Visit the Technical Inputs Manual: Double Divergence Pro for full parameter tuning.
Read the master guide on the Double Divergence Indicator Series.
Write a review
Your Name:Your Review: Note: HTML is not translated!
Rating: Bad Good
Enter the code in the box below:


Latest

Welcome to Patternsmart
Converting your indicator from one platform to another.Custom Alert, Autotrader, Indicators, Scan, Screener, Strategy and Signals.
Copyright @ 2026 Patternsmart - All rights reserved
This website is for educational and informational
purposes only and should not be considered a solicitation to buy or sell a
futures contract or make any other type of investment decision. It's not recommended to use any single indicator as sole evaluation criteria. The companies
and services listed on this website are not to be considered a recommendation
and it is the reader's responsibility to evaluate any product, service, or
company. patternsmart is not responsible for the accuracy or content of any
product, service or company linked to on this website.
Futures trading
contains substantial risk and is not for every investor.Please read the following risk disclosure before considering the
trading of this product:
Futures Risk Disclosure. An investor could
potentially lose all or more than the initial investment. Risk capital is money
that can be lost without jeopardizing ones financial security or life style.
Only risk capital should be used for trading and only those with sufficient risk
capital should consider trading. Past performance is not necessarily indicative
of future results.
Trading stocks, options, futures and forex involves
speculation, and the risk of loss can be substantial.Investor must consider all
relevant risk factors, including their own personal financial situation, before
trading. Trading foreign exchange on margin carries a high level of risk, as
well as its own unique risk factors. Forex investments are subject to
counter-party risk, as there is no central clearing organization for these
transactions. Please read the following risk disclosure before considering the
trading of this product:
Forex Risk Disclosure. Spreads, Straddles, and other multiple-leg option
strategies can entail substantial transaction costs, including multiple
commissions, which may impact any potential return. Options are not suitable for
all investors as the special risks inherent to options trading may expose
investors to potentially rapid and substantial losses. Prior to trading options,
you should carefully read
Characteristics and Risks of Standardized Options.
patternsmart.com
will not be held liable for the loss of money or any damage caused from relying
on the information on this site. Any investment decision you make in your account is solely your responsibility.
TESTIMONIAL DISCLOSURE: TESTIMONIALS APPEARING ON OUR SITE MAY NOT BE REPRESENTATIVE OF THE EXPERIENCE OF OTHER CLIENTS OR CUSTOMERS AND IS NOT A GUARANTEE OF FUTURE PERFORMANCE OR SUCCESS.