
Your shopping cart is empty!
Shopping Cart
0 item(s) - FreeCustomization and Conversion for: Ctrader, MetaTrader(MT4, MT5), Thinkorswim, NinjaTrader, MultiCharts, Tradingview, Prorealtime, SierraChart, etc.
License renew price will be 20% off for the 2nd year and after.
Every Purchase Comes with a Coupon.
Share Your Experience. Help Other Traders Learn. Get Rewarded.
Share Your Experience. Help Other Traders Learn. Get Rewarded.
Featured





RSI Double Divergence Pro for Sierra Chart


 (
(Introduction: The Challenge of Single-Point Momentum Divergence
Evaluating market momentum is a fundamental practice in technical analysis, yet identifying genuine shifts in market behavior remains a persistent challenge. Traders routinely rely on momentum oscillators like the Relative Strength Index (RSI) to detect potential trend exhaustion or continuation. However, standard technical indicators often present significant operational hurdles when applied in real-time trading environments.
Conventional divergence indicators compare price movement against momentum across a single historical swing point. In fast-moving or strongly trending markets, a single-pivot divergence frequently produces premature warnings. Price may continue to advance or decline while generating multiple consecutive single-point divergences, leading to false reversal expectations and premature counter-trend execution. Furthermore, traditional setups require traders to constantly shift their focus between price candles on the primary chart and indicator waves in a subchart pane, creating visual disconnects during critical market moments.
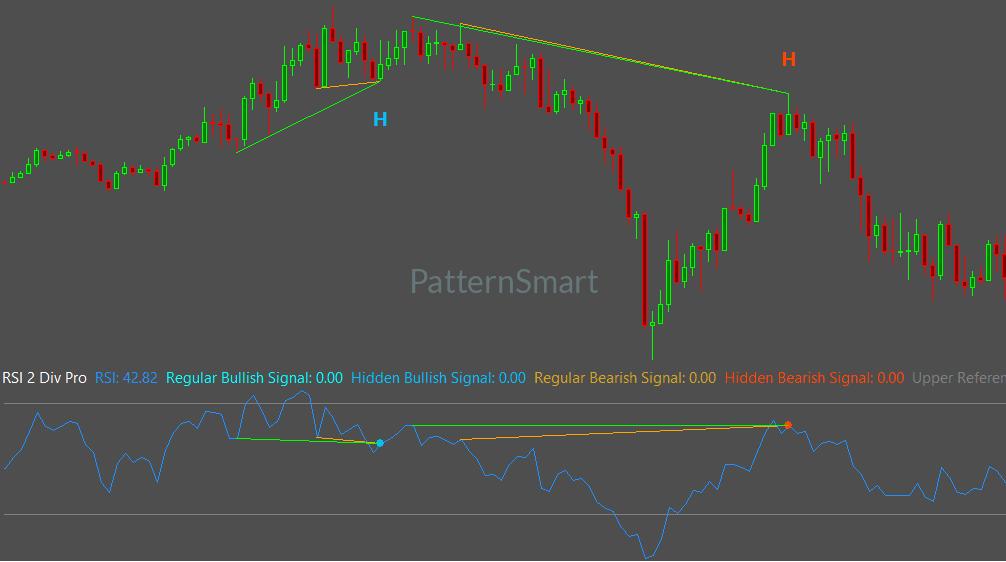
The PatternSmart RSI Double Divergence Indicator for Sierra Chart solves these challenges by combining the speed of the Relative Strength Index with PatternSmart’s confirmation-first Double Divergence methodology. Built specifically for the high-performance Sierra Chart environment, this indicator evaluates momentum structural agreement across two consecutive historical anchor points, filtering market noise and delivering objective analytical confirmation directly within your charting workspace.
Understanding Momentum Exhaustion and the RSI
To evaluate market shifts effectively, analysts must first understand the relationship between price expansion and the velocity of buying or selling pressure.
The Role of RSI in Technical Analysis
The Relative Strength Index (RSI) measures the speed and magnitude of recent price changes to evaluate whether price movement is supported by strong momentum or experiencing momentum decay. Under normal market conditions, price action and RSI develop in relative alignment:
-
In a healthy uptrend: Rising price highs are supported by expanding RSI peaks, reflecting strong buying pressure.
-
In a healthy downtrend: Falling price lows are matched by declining RSI troughs, reflecting sustained selling pressure.
When this relationship begins to decouple, the market communicates valuable analytical evidence.
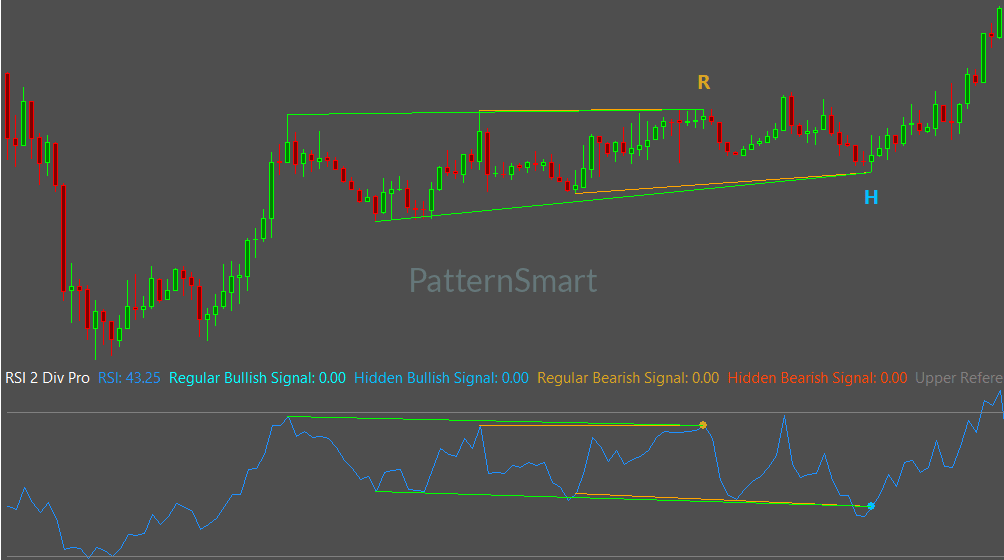
Why Divergence Occurs
Divergence occurs when price action and an indicator no longer move in agreement. Rather than serving as a guaranteed prediction of an immediate price reversal, divergence indicates a change in the rate of price acceleration. It reveals that while price may continue to print new highs or lows, the underlying momentum driving that movement has begun to decay or realign.
REGULAR BEARISH DIVERGENCE (Reversal Potential)
Price Action:   [Swing High 1] ----(Higher High)----> [Swing High 2]
                                    \ (Decay)
RSI Momentum:   [RSI Peak 1]   ----(Lower High)-----> [RSI Peak 2]

HIDDEN BULLISH DIVERGENCE (Continuation Potential)
Price Action:   [Swing Low 1]  ----(Higher Low)-----> [Swing Low 2]
                                    / (Expansion)
RSI Momentum:   [RSI Trough 1] ----(Lower Low)------> [RSI Trough 2]
Divergence is an analytical observation that highlights structural disagreement. Evaluating this disagreement within its broader market context allows traders to analyze potential trend transitions or pullbacks with greater precision.
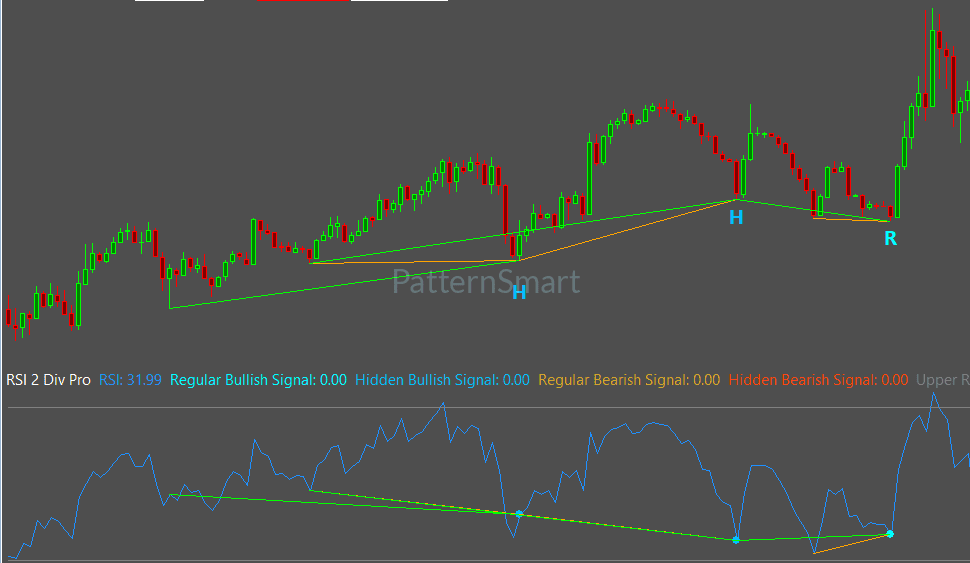
The Double Divergence Methodology: Confirmation Over Prediction
Traditional technical analysis often encourages traders to react to isolated technical events. The PatternSmart Double Divergence methodology replaces single-pivot assumptions with a structured, confirmation-first analytical process.
Dual-Anchor Verification Architecture
Instead of evaluating divergence across a single historical price peak or trough, the Double Divergence methodology requires dual-anchor verification. A divergence signal is validated only when price momentum establishes structural divergence across two consecutive historical swing points.
TRADITIONAL SINGLE DIVERGENCE (Higher Noise Potential)
Price:     Low 1 --------> Lower Low 2 (Signal Triggered)
RSI:       Low 1 --------> Higher Low 2

DOUBLE DIVERGENCE DUAL-ANCHOR MODEL (Higher Confirmation)
Price:     Low 1 ----> Low 2 ----> Lower Low 3 (Confirmed Signal)
RSI:       Low 1 ----> Higher Low 2 ----> Higher Low 3
By requiring multi-pivot structural agreement, the Double Divergence algorithm systematically filters out temporary market noise and minor price flurries. This dual-anchor structure confirms that a momentum shift is sustained across multiple market cycles before a signal is finalized.
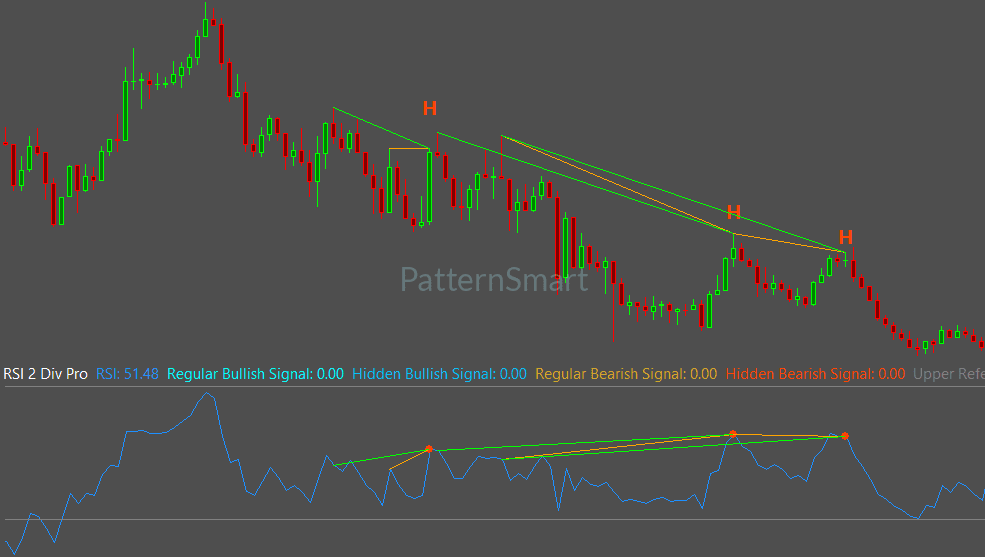
The Confirmation Principle
Financial markets operate on probability rather than certainty. Within the Double Divergence framework:
-
Divergence represents information, not prediction: A signal highlights changing market conditions rather than guaranteeing a specific outcome.
-
Confirmation strengthens confidence: Waiting for dual-anchor alignment and candle closure provides stronger analytical support.
-
Context remains essential: Divergence should always be interpreted alongside market structure, support and resistance levels, and broader trend dynamics.
High-Performance Integration for Sierra Chart
Sierra Chart is widely recognized among professional futures, Forex, and equities traders for its exceptional performance, low-latency execution, and precision charting capability. High-volume traders rely on Sierra Chart because its rendering engine handles complex calculations without lag or chart freezing.
The RSI Double Divergence Indicator for Sierra Chart is natively compiled to take full advantage of Sierra Chart’s advanced computing infrastructure:
-
Engine Efficiency: Operates with minimal CPU overhead, maintaining rapid chart updating during volatile market opens and high-volume economic releases.
-
Visual Precision: Draws clean visual overlays directly on your primary price chart and RSI subchart panes without cluttering the Sierra Chart environment.
-
Workflow Consistency: Integrates naturally with Sierra Chart's global alert systems, custom chart studies, and multi-chart workspace configurations.
By pairing Sierra Chart’s computational speed with PatternSmart's confirmation-first methodology, traders gain a reliable, high-performance environment for real-time market analysis.
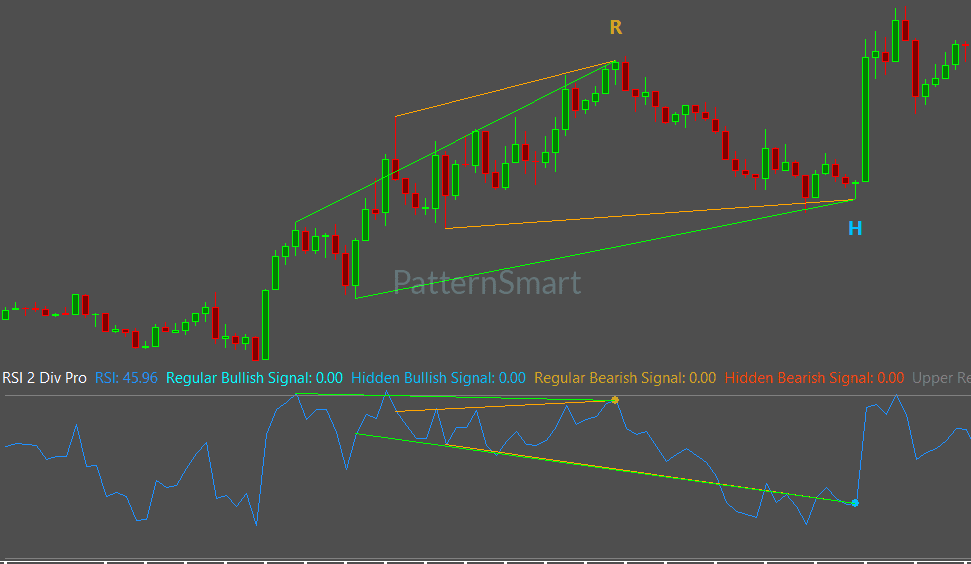
Core Product Features & Signal Engine
The RSI Double Divergence Indicator for Sierra Chart provides a robust suite of analytical, structural, and visual settings from the official Double Divergence Pro feature set.
                       COMPREHENSIVE PROCESSING WORKFLOW

   +-----------------------------------------------------------------------+
   |                        1. SIGNAL GENERATION                           |
   |   Show Regular Bullish [R]  |  Show Regular Bearish [R]               |
   |   Show Hidden Bullish [H]   |  Show Hidden Bearish [H]                |
   +-----------------------------------------------------------------------+
                                       |
                                       v
   +-----------------------------------------------------------------------+
   |                      2. ADVANCED PARAMETERS                           |
   |   Divergence Bar Range      |  Divergence Lookback  |  Filter Length  |
   +-----------------------------------------------------------------------+
                                       |
                                       v
   +-----------------------------------------------------------------------+
   |                        3. SIGNAL FILTERING                            |
   |   Enhanced Mode (Applies Strict Geometric Validation)                |
   |   Wait 1 Bar (Requires Candle Close Before Signal Finalization)       |
   +-----------------------------------------------------------------------+
                                       |
                                       v
   +-----------------------------------------------------------------------+
   |                   4. ALERTS & VISUALIZATION                            |
   |   Enable Alert / Sound      |  Show Char / Show Line                  |
   |   Only Show Last Signal Within Bars  |  Price Line Brush & Dash Style |
   +-----------------------------------------------------------------------+
1. Complete 4-in-1 Divergence Detection
The detection engine continuously scans for four distinct divergence structures across all timeframe intervals:
-
Regular Bullish Divergence (
R): Price forms a lower low while RSI forms a higher low. Indicates potential exhaustion of selling pressure and potential bullish reversal. -
Regular Bearish Divergence (
R): Price forms a higher high while RSI forms a lower high. Indicates potential exhaustion of buying pressure and potential bearish reversal. -
Hidden Bullish Divergence (
H): Price forms a higher low while RSI forms a lower low. Highlights underlying buying strength during temporary pullbacks in an established uptrend (continuation). -
Hidden Bearish Divergence (
H): Price forms a lower high while RSI forms a higher high. Highlights underlying selling pressure during temporary retracements in an established downtrend (continuation).
2. "Wait 1 Bar" Non-Repainting Engine
Signal stability is critical for objective technical analysis. When
Wait 1 Bar is enabled (True), the indicator waits for the confirmation bar to close completely before finalizing the signal print and triggering alerts. This guarantees that historical signals displayed on your Sierra Chart workspace accurately match the real-time conditions evaluated at the time of execution.3. Enhanced Mode Filtering
Enhanced Mode provides an optional structural filtering layer. When set to True, the algorithm evaluates additional geometric relationships between historical swing points before confirming a signal. This extra validation step filters out lower-quality setups, helping traders focus on well-defined divergence structures.4. Advanced Structural Controls
-
Divergence Bar Range: Configures the structural search boundaries (
ShortRange,MidRange, orLongRange) to adjust the allowable distance between historical anchor points. -
Divergence Lookback: Controls the number of historical bars evaluated when identifying local swing highs and swing lows.
-
Filter Length: Sets the internal smoothing period used during structural evaluation to adapt sensitivity to volatile or quiet market conditions.
Practical Analytical Benefits
Integrating the RSI Double Divergence Indicator into your Sierra Chart workspace delivers practical analytical advantages:
-
Improved Signal Filtering: Dual-anchor verification and
Enhanced Modesignificantly reduce false divergence signals caused by minor market fluctuations. -
Clear Categorization: Visual labels (
Rfor Regular,Hfor Hidden) instantly distinguish between reversal opportunities and trend continuation entries. -
Reduced Screen Fatigue: Automated dual-panel line plotting connects price pivots directly to RSI subchart waves, eliminating manual line drawing and reducing visual disconnects.
-
Customizable Alerts: Real-time audio and visual alerts notify you immediately when a valid setup confirms, eliminating the need to monitor dozens of charts manually.
-
Structured Decision-Making: Provides objective, repeatable technical evidence to complement price action, trend analysis, and risk management strategies.
Looking for the complete mathematical breakdown, step-by-step optimization guides, and advanced trading strategies? Explore our comprehensive documentation:
Visit the Technical Inputs Manual: Double Divergence Pro for full parameter tuning.
Read the master guide on the Double Divergence Indicator Series.
Frequently Asked Questions
What is the primary difference between Regular and Hidden Divergence?
Regular Divergence highlights potential market reversals by identifying momentum decay when price makes a new extreme high or low. Hidden Divergence highlights potential trend continuation by showing that underlying momentum is expanding even as price completes a temporary pullback or retracement within an established trend.
Does the indicator repaint confirmed historical signals?
No. When the
Wait 1 Bar setting is enabled (True), signals are confirmed only after the execution bar has closed. Once a bar closes and a signal is printed, the indicator does not repaint or adjust historical signals.How does "Enhanced Mode" affect signal frequency?
Enhanced Mode applies strict geometric and structural validation rules to detected setups. Enabling Enhanced Mode reduces overall signal frequency by filtering out lower-quality or irregular divergence structures, focusing on higher-conviction setups.Can I adjust the indicator for different timeframes on Sierra Chart?
Yes. You can adjust the
Divergence Bar Range, Divergence Lookback, and Filter Length parameters to suit any timeframe or trading style—from tick and volume charts to daily timeframes.What markets can I analyze with this indicator on Sierra Chart?
The RSI Double Divergence Indicator functions across all markets supported by Sierra Chart, including E-mini futures, commodities, Forex currency pairs, major stock indices, and individual equities.
Conclusion
Technical analysis requires structured evidence, objective interpretation, and reliable tools. By combining the momentum tracking of the Relative Strength Index with PatternSmart’s dual-anchor Double Divergence methodology, the RSI Double Divergence Indicator for Sierra Chart provides a robust framework for evaluating market turns and trend continuation entries.
Rather than relying on single-pivot assumptions or lagging indicators, traders can analyze momentum shifts with greater confidence, supported by Sierra Chart’s high-performance charting environment.
Write a review
Your Name:Your Review: Note: HTML is not translated!
Rating: Bad Good
Enter the code in the box below:


Latest

Welcome to Patternsmart
Converting your indicator from one platform to another.Custom Alert, Autotrader, Indicators, Scan, Screener, Strategy and Signals.
Copyright @ 2026 Patternsmart - All rights reserved
This website is for educational and informational
purposes only and should not be considered a solicitation to buy or sell a
futures contract or make any other type of investment decision. It's not recommended to use any single indicator as sole evaluation criteria. The companies
and services listed on this website are not to be considered a recommendation
and it is the reader's responsibility to evaluate any product, service, or
company. patternsmart is not responsible for the accuracy or content of any
product, service or company linked to on this website.
Futures trading
contains substantial risk and is not for every investor.Please read the following risk disclosure before considering the
trading of this product:
Futures Risk Disclosure. An investor could
potentially lose all or more than the initial investment. Risk capital is money
that can be lost without jeopardizing ones financial security or life style.
Only risk capital should be used for trading and only those with sufficient risk
capital should consider trading. Past performance is not necessarily indicative
of future results.
Trading stocks, options, futures and forex involves
speculation, and the risk of loss can be substantial.Investor must consider all
relevant risk factors, including their own personal financial situation, before
trading. Trading foreign exchange on margin carries a high level of risk, as
well as its own unique risk factors. Forex investments are subject to
counter-party risk, as there is no central clearing organization for these
transactions. Please read the following risk disclosure before considering the
trading of this product:
Forex Risk Disclosure. Spreads, Straddles, and other multiple-leg option
strategies can entail substantial transaction costs, including multiple
commissions, which may impact any potential return. Options are not suitable for
all investors as the special risks inherent to options trading may expose
investors to potentially rapid and substantial losses. Prior to trading options,
you should carefully read
Characteristics and Risks of Standardized Options.
patternsmart.com
will not be held liable for the loss of money or any damage caused from relying
on the information on this site. Any investment decision you make in your account is solely your responsibility.
TESTIMONIAL DISCLOSURE: TESTIMONIALS APPEARING ON OUR SITE MAY NOT BE REPRESENTATIVE OF THE EXPERIENCE OF OTHER CLIENTS OR CUSTOMERS AND IS NOT A GUARANTEE OF FUTURE PERFORMANCE OR SUCCESS.