Your shopping cart is empty!
Shopping Cart
0 item(s) - FreeCustomization and Conversion for: Ctrader, MetaTrader(MT4, MT5), Thinkorswim, NinjaTrader, MultiCharts, Tradingview, Prorealtime, SierraChart, etc.
License renew price will be 20% off for the 2nd year and after.
Featured


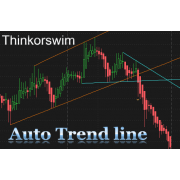
CCI Divergence Indicator all-in-one package for Thinkorswim


") (
(VIP member get 15% off, click here to become a VIP member.
This CCI divergence Indicator all-in-one package for Thinkorswim includes:
No matter what kind of strategy you have, timing is one of the most important elements in trading.
Everyone wants to be one step ahead of the game. But how and is it even possible?
A lot of traders rely on CCI indicator and most of them spend their day to stare at the charts for hours and waiting for CCI divergence to happen on current bar. Experienced traders can manage to follow multiple charts at the same time, if you are one of them, you know you have been doing this for years.
Now, imagine an indicator can automatically generate a sound alert whenever there is an CCI Divergence on the chart, if you are away from your computer it can even send you an SMS. This is one step ahead of others.
If you need to watch dozens of symbols at the same time, the chart indicator cannot give signals for all of them unless you open dozens of charts which obviously not an option. In order to get Divergence signals for all symbols in your watchlist, the CCI Divergence Custom Quotes is your best solution. It's capable to show Divergence signals in all timeframes you chose with separate columns. This is another step ahead of others.
If you don't want to wait for the signals to appear on watchlist, the CCI Divergence SCAN makes it possible for you to search the whole market with CCI Divergence together with any other criteria you like to add.
With these three products together, you are a few steps ahead of others.This CCI divergence Indicator all-in-one package for Thinkorswim includes:
- CCI Divergence indicator for Thinkorswim TOS
- Advanced CCI Divergence SCAN for Thinkorswim TOS
- CCI Divergence signals Custom Quotes for Thinkorswim TOS
The CCI Divergence Indicator is a powerful tool that combines the momentum-measuring capabilities of the Commodity Channel Index (CCI) with the concept of divergence to identify potential trend reversals and continuations. Its usefulness lies in its ability to spot hidden weaknesses in a trend that may not be apparent from price action alone.
Here's a detailed breakdown of why it's a valuable tool for traders.
1. It Provides Early Warning Signals of Potential Trend Exhaustion
This is the primary and most powerful use of CCI divergence. It can signal that a trend is losing momentum before the price itself actually reverses.
-
What it does: The indicator compares the direction of the price with the direction of the CCI oscillator.
-
Bearish Divergence (Sell Signal): Price makes a higher high, but the CCI makes a lower high. This indicates that while price is pushing to a new extreme, the underlying buying momentum is actually weaker. It's a warning that the uptrend is exhausted and a reversal or pullback is likely.
-
Bullish Divergence (Buy Signal): Price makes a lower low, but the CCI makes a higher low. This indicates that while price is falling to a new low, the underlying selling momentum is waning. It's a warning that the downtrend is exhausted and a reversal or bounce is likely.
-
-
Why it's useful: It allows you to anticipate reversals and exit long positions (or even prepare for short entries) before a major price drop occurs, protecting profits and capital.
2. It Helps Distinguish Between a Pullback and a True Reversal
Not every price dip is a reason to panic. Divergence can help you understand the character of a counter-trend move.
-
What it shows: In a strong uptrend, a pullback will often show bullish divergence (price makes a lower low, CCI makes a higher low). This is a "good" pullback and a potential buying opportunity within the larger trend.
-
Why it's useful: It helps you stay in a trending trade by confirming that the pullback is likely just a pause, not a trend change. This prevents you from being shaken out of a good position prematurely.
3. It Generates High-Probability Entry and Exit Signals
CCI divergence is not meant to be used in isolation; it generates signals that require confirmation for high-probability trades.
-
Entry Signal:
-
For a Long Trade: Identify a bullish divergence. Wait for a confirming price action signal, such as a bullish engulfing pattern or a break above a minor resistance level. Then enter the trade.
-
For a Short Trade: Identify a bearish divergence. Wait for a confirming signal, like a bearish engulfing pattern or a break below a minor support level. Then enter the short.
-
-
Exit Signal: A divergence forming against your position (e.g., a bearish divergence while you are long) is a strong signal to take profits or tighten your stop-loss.
4. It Works on Any Timeframe and Any Market
The principles of momentum divergence are universal.
-
What it does: Whether you're a day trader on a 5-minute chart or a long-term investor on a weekly chart, the CCI Divergence indicator can identify momentum shifts.
-
Why it's useful: The methodology is consistent and scalable. A divergence on a weekly chart signals a major trend change, while a divergence on a 1-minute chart signals a short-term reversal.
Practical Trading Example (Bearish Divergence)
Let's walk through a short trade using CCI divergence.
-
Identify the Divergence: Stock XYZ is in an uptrend. It makes a high at $100, pulls back, and then rallies to a new high at $110. You look at the CCI indicator:
-
At the $100 high, the CCI reading was +150.
-
At the $110 high, the CCI reading is only +100.
-
This is a clear Bearish Divergence: Price made a higher high ($100 -> $110), but CCI made a lower high (+150 -> +100).
-
-
Wait for Confirmation: You do not short immediately. You wait for price to confirm the momentum weakness. A few days later, the price breaks below the short-term support trendline connecting the recent lows.
-
Execute the Trade:
-
Entry: You enter a short position on the break of support at $105.
-
Stop-Loss: You place your stop-loss order just above the recent high of $110.
-
Profit Target: You target the next major support level, perhaps near the previous pullback low at $90.
-
-
Outcome: The trade was based on the early warning (divergence) and executed on the confirmation (break of support), giving it a high probability of success.
Crucial Limitations and Tips for Use
-
It is a Warning, Not a Signal: This is the most important point. Divergence alone is not a reason to enter a trade. It only tells you that momentum is slowing, not that the trend has reversed. The trend can continue for a long time (a phenomenon called "divergence divergence") without reversing. Always wait for price action confirmation (a break of a trendline, a key level, or a reversal candlestick pattern).
-
Avoid "Noise" on Low Timeframes: On very short timeframes (e.g., 1-minute charts), divergence can appear frequently and lead to false signals. It is most reliable on higher timeframes (1-hour, 4-hour, Daily).
-
Adjust CCI Settings: The standard setting for CCI is 20 periods. Sometimes adjusting this to 14 or 50 can help smooth the oscillator and identify more meaningful divergences, reducing noise.
-
Use in Confluence: A CCI divergence signal becomes exponentially more powerful when it occurs at a key:
-
Support or Resistance Level
-
Fibonacci Retracement Level
-
Trend Line
-
Summary: Why the CCI Divergence Indicator is Useful
In essence, the CCI Divergence indicator is useful because it:
-
Spots Hidden Weakness: Reveals slowing momentum that isn't visible on the price chart alone.
-
Provides Early Warnings: Offers a chance to anticipate reversals and manage risk proactively.
-
Filters Trades: Helps distinguish strong trends from weakening ones, allowing you to avoid low-probability entries.
-
Is a Universal Tool: Works across all markets and timeframes, providing a consistent framework for analysis.
It is the ultimate tool for the trader who wants to understand not just what the price is doing, but how it is doing it—the underlying force and momentum behind the move. When used correctly as a warning system to be confirmed by price, it is an invaluable part of a technical trader's toolkit.
Write a review
Your Name:Your Review: Note: HTML is not translated!
Rating: Bad Good
Enter the code in the box below:
Latest


Welcome to Patternsmart
Converting your indicator from one platform to another.Custom Alert, Autotrader, Indicators, Scan, Screener, Strategy and Signals.
Copyright @ 2026 Patternsmart - All rights reserved
This website is for educational and informational
purposes only and should not be considered a solicitation to buy or sell a
futures contract or make any other type of investment decision. It's not recommended to use any single indicator as sole evaluation criteria. The companies
and services listed on this website are not to be considered a recommendation
and it is the reader's responsibility to evaluate any product, service, or
company. patternsmart is not responsible for the accuracy or content of any
product, service or company linked to on this website.
Futures trading
contains substantial risk and is not for every investor.Please read the following risk disclosure before considering the
trading of this product:
Futures Risk Disclosure. An investor could
potentially lose all or more than the initial investment. Risk capital is money
that can be lost without jeopardizing ones financial security or life style.
Only risk capital should be used for trading and only those with sufficient risk
capital should consider trading. Past performance is not necessarily indicative
of future results.
Trading stocks, options, futures and forex involves
speculation, and the risk of loss can be substantial.Investor must consider all
relevant risk factors, including their own personal financial situation, before
trading. Trading foreign exchange on margin carries a high level of risk, as
well as its own unique risk factors. Forex investments are subject to
counter-party risk, as there is no central clearing organization for these
transactions. Please read the following risk disclosure before considering the
trading of this product:
Forex Risk Disclosure. Spreads, Straddles, and other multiple-leg option
strategies can entail substantial transaction costs, including multiple
commissions, which may impact any potential return. Options are not suitable for
all investors as the special risks inherent to options trading may expose
investors to potentially rapid and substantial losses. Prior to trading options,
you should carefully read
Characteristics and Risks of Standardized Options.
patternsmart.com
will not be held liable for the loss of money or any damage caused from relying
on the information on this site. Any investment decision you make in your account is solely your responsibility.
TESTIMONIAL DISCLOSURE: TESTIMONIALS APPEARING ON OUR SITE MAY NOT BE REPRESENTATIVE OF THE EXPERIENCE OF OTHER CLIENTS OR CUSTOMERS AND IS NOT A GUARANTEE OF FUTURE PERFORMANCE OR SUCCESS.