
Your shopping cart is empty!
Shopping Cart
0 item(s) - FreeCustomization and Conversion for: Ctrader, MetaTrader(MT4, MT5), Thinkorswim, NinjaTrader, MultiCharts, Tradingview, Prorealtime, SierraChart, etc.
License renew price will be 20% off for the 2nd year and after.
Every Purchase Comes with a Coupon.
Share Your Experience. Help Other Traders Learn. Get Rewarded.
Share Your Experience. Help Other Traders Learn. Get Rewarded.
Featured





Dynamic Supply Demand Zone indicator for tradingview
.png "Dynamic Supply Demand Zone indicator for tradingview")
.png "Dynamic Supply Demand Zone indicator for tradingview")
.png "Dynamic Supply Demand Zone indicator for tradingview")
 (
(
The Dynamic Supply & Demand Zone indicator identifies and displays active supply and demand zones directly on the price chart. It helps traders monitor potential reaction areas, zone strength, breakout or breakdown possibility, price distance to zones, and recent broken-zone statistics.
The indicator can also provide visual labels, dashboard information, and alerts for first touches, breakouts, breakdowns, and rejections.
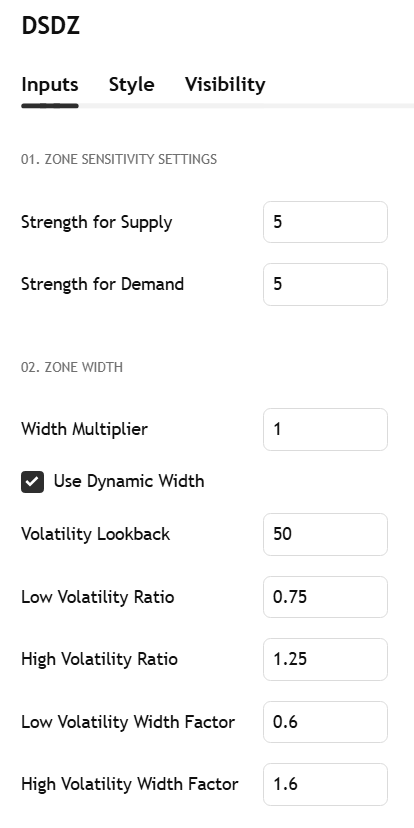
01. Zone Sensitivity Settings
|
Input |
Description |
Practical Impact |
|
Strength for Supply |
Controls how selective the indicator is when identifying potential supply zones. |
A higher setting requires a stronger and more clearly confirmed price structure before a supply zone is created, which usually results in fewer but more selective zones. A lower setting makes the indicator more responsive, but it may generate more zones during choppy or noisy market conditions. |
|
Strength for Demand |
Controls how selective the indicator is when identifying potential demand zones. |
A higher setting requires a stronger and more clearly confirmed price structure before a demand zone is created, which usually results in fewer but more stable zones. A lower setting makes the indicator react faster, but it may create more frequent zones in less stable market conditions. |
02. Zone Width Settings
|
Input |
Description |
Practical Impact |
|
Width Multiplier |
Adjusts the base width of each supply and demand zone. |
Increasing this value makes zones wider, giving price more room to interact with the zone. Decreasing it makes zones tighter and more selective. |
|
Use Dynamic Width |
Enables automatic zone-width adjustment based on market volatility. |
When enabled, the indicator adjusts zone width according to volatility conditions. This helps prevent zones from being too narrow in volatile markets or too wide in quiet markets. |
|
Volatility Lookback |
Sets the lookback period used to evaluate average volatility for dynamic zone width. |
A longer lookback creates smoother and more stable width adjustment. A shorter lookback reacts faster to recent volatility changes. |
|
Low Volatility Ratio |
Defines the threshold used to identify lower-volatility conditions. |
When market volatility is relatively low, zone width may be reduced. This can make zones more precise during quiet market conditions. |
|
High Volatility Ratio |
Defines the threshold used to identify higher-volatility conditions. |
When market volatility is relatively high, zone width may be expanded. This helps the zones better fit fast-moving or wide-range markets. |
|
Low Volatility Width Factor |
Controls how much the zone width is reduced during low-volatility conditions. |
Lower values create narrower zones during quiet markets. Higher values keep low-volatility zones wider. |
|
High Volatility Width Factor |
Controls how much the zone width is expanded during high-volatility conditions. |
Higher values create wider zones during volatile markets. Lower values keep zones tighter even when volatility increases. |
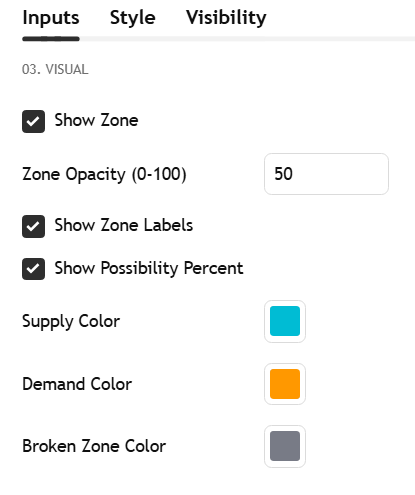
03. Visual Settings
|
Input |
Description |
Practical Impact |
|
Show Zone |
Shows or hides the supply and demand zone rectangles on the chart. |
When enabled, traders can visually identify active supply and demand areas. Turning it off creates a cleaner chart while still allowing the indicator to calculate internally. |
|
Zone Opacity |
Controls the transparency of the zone fill. |
A lower value makes zones more transparent and less intrusive. A higher value makes zones more visible but may cover price bars more strongly. |
|
Show Zone Labels |
Shows or hides text labels next to active zones. |
Labels provide quick information about zone type, possibility percentage, and zone state such as fresh, tested, weak, or broken. |
|
Show Possibility Percent |
Shows or hides the BO(breakout)Possibility / BD(breakdown)Possibility percentage on zone labels. |
When enabled, traders can quickly evaluate whether an active supply or demand zone is more likely to be challenged. Turning it off simplifies the chart display. |
|
Supply Color |
Sets the color used for supply zones and supply-related plots. |
Helps visually distinguish supply areas from demand areas. |
|
Demand Color |
Sets the color used for demand zones and demand-related plots. |
Helps visually identify potential support or demand areas on the chart. |
|
Broken Zone Color |
Sets the color used after a zone has been broken. |
Makes it easier to distinguish broken zones from active zones. This helps traders avoid treating failed zones the same as current valid zones. |
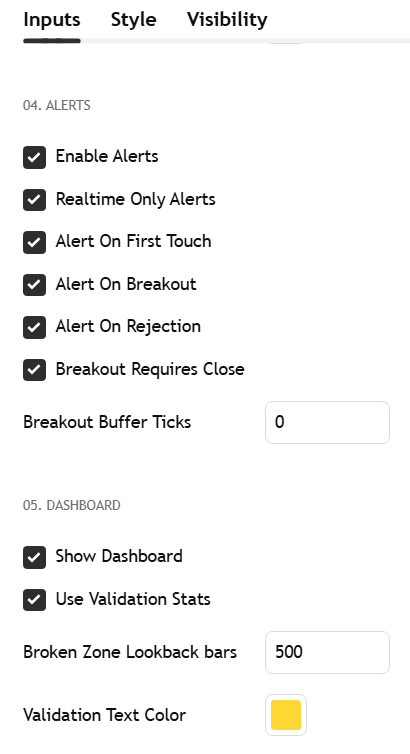
04. Alert Settings
|
Input |
Description |
Practical Impact |
|
Enable Alerts |
Turns all indicator alerts on or off. |
When disabled, no alert will trigger, even if individual alert conditions are enabled. |
|
Realtime Only Alerts |
Limits alerts to realtime market data only. |
Helps prevent historical alerts from triggering when the indicator is first loaded or recalculated. |
|
Alert On First Touch |
Triggers an alert when price first touches a fresh supply or demand zone. |
Useful for traders who want to monitor the first test of a newly formed zone. |
|
Alert On Breakout |
Triggers an alert when price breaks above a supply zone or breaks below a demand zone. |
Useful for breakout, breakdown, or failed-zone monitoring. |
|
Alert On Rejection |
Triggers an alert when price touches a zone and then moves away from it. |
Useful for traders looking for possible rejection behavior around supply or demand areas. |
|
Breakout Requires Close |
Determines whether a breakout or breakdown requires a bar close beyond the zone. |
When enabled, breakout confirmation is more conservative. When disabled, a high or low beyond the zone may be enough, which can trigger earlier but may be more sensitive to wick movement. |
|
Breakout Buffer Ticks |
Sets the number of ticks price must move beyond the zone before a breakout or breakdown is confirmed. |
Increasing this value can help filter out small or insignificant zone violations. A lower value makes the indicator more sensitive. |
|
Alert sound |
Selects the sound file used for indicator alerts. |
Allows traders to customize the audio notification used when alert conditions occur. |
06. Dashboard Settings
|
Input |
Description |
Practical Impact |
|
Show Dashboard |
Shows or hides the on-chart dashboard. |
The dashboard provides a summary of active supply and demand zones, including zone range, departure, speed, width, distance, and related statistics. |
|
Use Validation Stats |
Shows or hides broken-zone ratio statistics for Supply BO and Demand BD. |
Helps traders review how often recent zones have been broken within the selected lookback window. |
|
Validation Lookback bars |
Sets the number of recent bars used for broken-zone ratio statistics. |
A larger value gives a broader historical sample. A smaller value focuses more on recent market behavior. |
|
Validation Text Color |
Sets the text color for validation statistics on the dashboard. |
Improves readability of the validation section on different chart backgrounds. |
Usage Notes
For cleaner discretionary chart reading, keep Show Zone, Show Zone Labels, and Show Dashboard enabled.
For more conservative breakout or breakdown confirmation, enable Breakout Requires Close and increase Breakout Buffer Ticks.
For faster and more sensitive zone detection, reduce Strength for Supply and Strength for Demand.
For fewer and more selective zones, increase Strength for Supply and Strength for Demand.
For volatile instruments or fast timeframes, enable Use Dynamic Width so the zone width can adapt to changing market conditions.
Please click this link to the following articles for a better understanding of how to use the Dynamic Supply Demand Zone indicator. These articles include case studies, guidance on adjusting input settings, explanations of the dashboard values, and other practical information to help you use the indicator more effectively.
Write a review
Your Name:Your Review: Note: HTML is not translated!
Rating: Bad Good
Enter the code in the box below:

Latest

Welcome to Patternsmart
Converting your indicator from one platform to another.Custom Alert, Autotrader, Indicators, Scan, Screener, Strategy and Signals.
Copyright @ 2026 Patternsmart - All rights reserved
This website is for educational and informational
purposes only and should not be considered a solicitation to buy or sell a
futures contract or make any other type of investment decision. It's not recommended to use any single indicator as sole evaluation criteria. The companies
and services listed on this website are not to be considered a recommendation
and it is the reader's responsibility to evaluate any product, service, or
company. patternsmart is not responsible for the accuracy or content of any
product, service or company linked to on this website.
Futures trading
contains substantial risk and is not for every investor.Please read the following risk disclosure before considering the
trading of this product:
Futures Risk Disclosure. An investor could
potentially lose all or more than the initial investment. Risk capital is money
that can be lost without jeopardizing ones financial security or life style.
Only risk capital should be used for trading and only those with sufficient risk
capital should consider trading. Past performance is not necessarily indicative
of future results.
Trading stocks, options, futures and forex involves
speculation, and the risk of loss can be substantial.Investor must consider all
relevant risk factors, including their own personal financial situation, before
trading. Trading foreign exchange on margin carries a high level of risk, as
well as its own unique risk factors. Forex investments are subject to
counter-party risk, as there is no central clearing organization for these
transactions. Please read the following risk disclosure before considering the
trading of this product:
Forex Risk Disclosure. Spreads, Straddles, and other multiple-leg option
strategies can entail substantial transaction costs, including multiple
commissions, which may impact any potential return. Options are not suitable for
all investors as the special risks inherent to options trading may expose
investors to potentially rapid and substantial losses. Prior to trading options,
you should carefully read
Characteristics and Risks of Standardized Options.
patternsmart.com
will not be held liable for the loss of money or any damage caused from relying
on the information on this site. Any investment decision you make in your account is solely your responsibility.
TESTIMONIAL DISCLOSURE: TESTIMONIALS APPEARING ON OUR SITE MAY NOT BE REPRESENTATIVE OF THE EXPERIENCE OF OTHER CLIENTS OR CUSTOMERS AND IS NOT A GUARANTEE OF FUTURE PERFORMANCE OR SUCCESS.