Your shopping cart is empty!
Shopping Cart
0 item(s) - FreeCustomization and Conversion for: Ctrader, MetaTrader(MT4, MT5), Thinkorswim, NinjaTrader, MultiCharts, Tradingview, Prorealtime, SierraChart, etc.
License renew price will be 20% off for the 2nd year and after.
Featured


ADX double divergence pro indicator with alert for NinjaTrader 8, 1 year license.

") (
(Manual trend strength and exhaustion hunting can be exhaustive, prone to subjectivity, and frequently disrupted by market noise. The ADX Double Divergence indicator automates this process by scanning for back-to-back, continuous divergence patterns between price action and trend intensity (the Average Directional Index line). By identifying two consecutive divergence points relative to historical swing peaks, this institutional-grade tool provides traders with highly reliable, multi-layered structural confirmations before a trend runs out of steam or aggressively accelerates.
2. Key Features
The ADX Double Divergence indicator seamlessly integrates complex multi-period swing analysis into a clean, actionable visual interface.
- Dual-Layer Signal Confirmation: Unlike standard single-divergence tools, this indicator triggers only when two sequential divergence structures line up against previous swing points, giving you far more reassuring and precise trend signals.
- Comprehensive Pattern Detection: Tracks and isolates four distinct market states simultaneously:
- Regular Bullish / Bearish: For spotting high-probability trend exhaustion and reversals.
- Hidden Bullish / Bearish: For identifying strong trend continuation and acceleration entries.
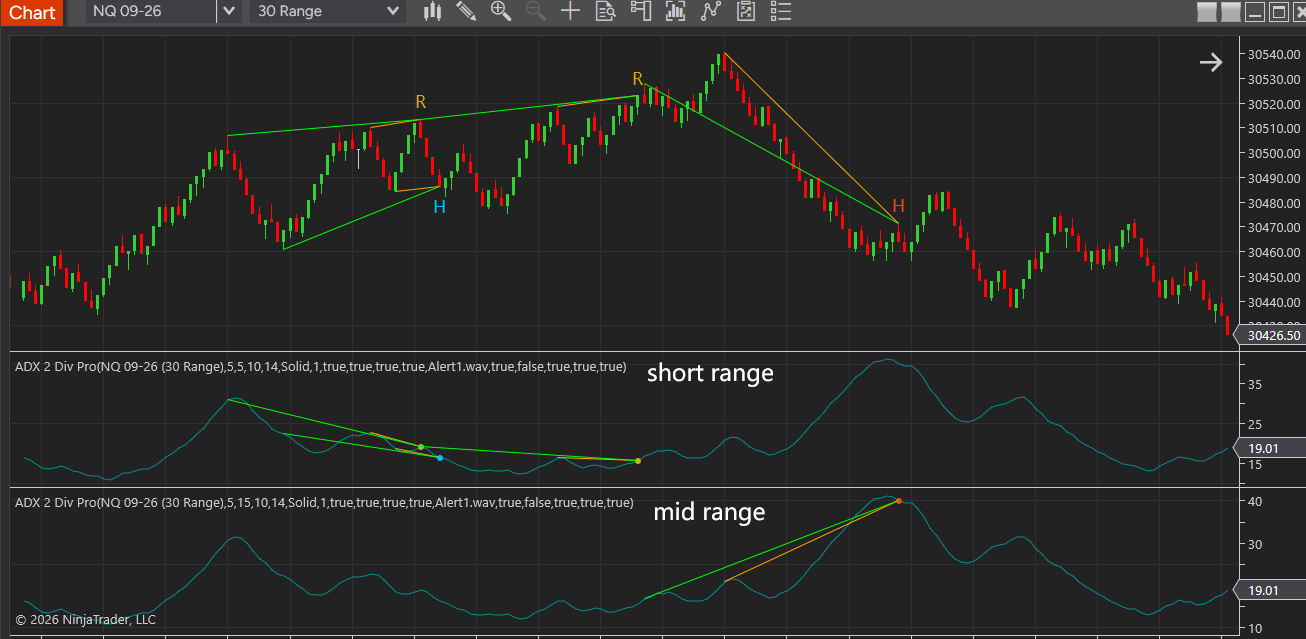
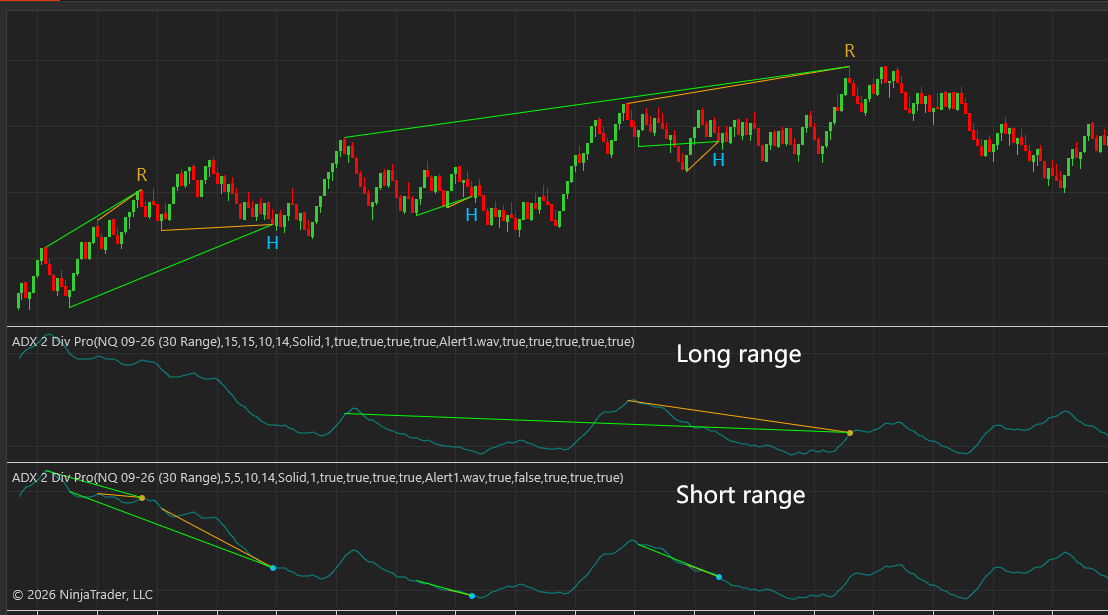
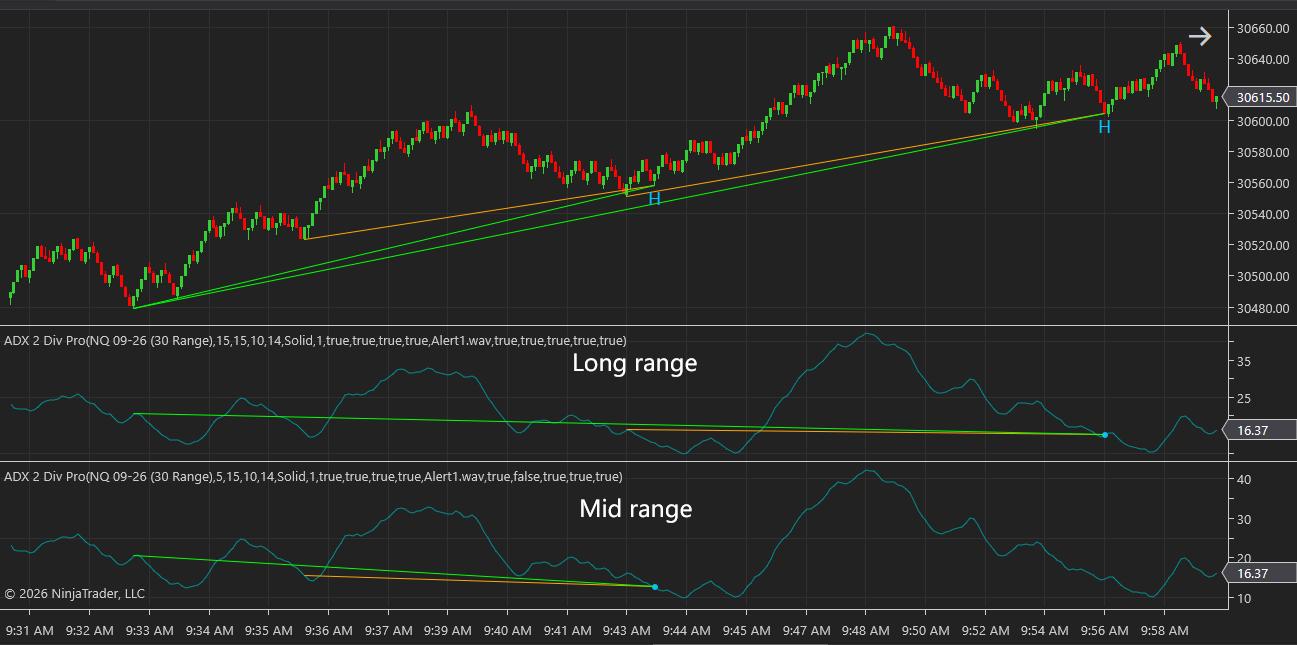
- Intuitive Visual Blueprint: Draws clean, color-coded trendlines directly on both your price panel and the ADX oscillator pane to connect the corresponding peaks and troughs automatically.
- Smart Signal Management: Includes an automated lookback filter ("Only Show Last Signal Within Bars") that cleans up the chart by removing older, redundant signals of the same type as new ones form.
- Customizable Alert System: Supports real-time audio (
.wav) notifications and visual alerts, ensuring you never miss a confirmed setup even when managing multiple charts. - Fully Adjustable Parameters: Tailor the tool to your trading style by tweaking the ADX smoothing periods, choosing between short, mid, or long-range swing lookbacks, or enabling a conservative "Wait 1 Bar" confirmation rule.
3. How to Use It / Trading Strategy
Incorporating the ADX Double Divergence indicator into your daily trading routine is straightforward, whether you are a scalper, day trader, or swing trader.
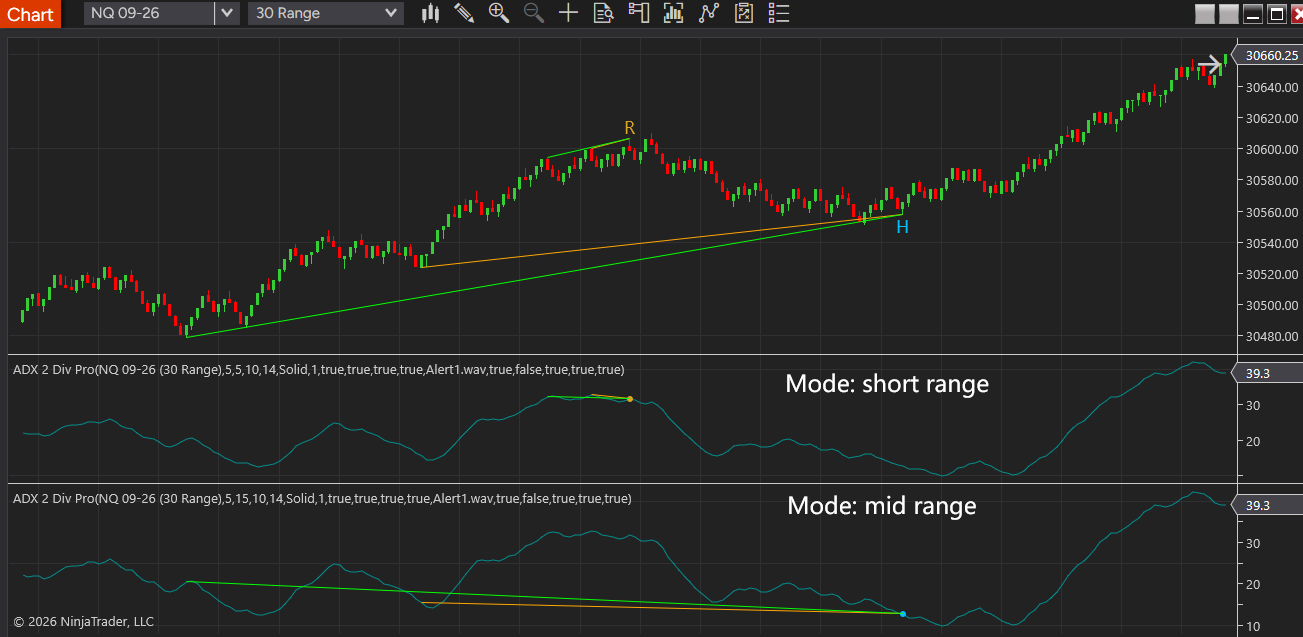
- Trading Reversals (Regular Divergence): When the indicator plots two consecutive regular bullish divergence lines, it indicates that while price is making lower lows, downside momentum is drying up. Look for a confirmed "R" character to print under the candle as your cue to anticipate a bullish reversal.
- Trading Continuations (Hidden Divergence): During an established uptrend, if the price pulls back to form a higher low, while the ADX line forms a double lower low (resetting the trend metrics), the indicator prints a hidden bullish signal ("H"). This confirms that momentum has reset lower while price held its structure, offering a low-risk entry to buy the dip.
- The "Wait 1 Bar" Confirmation: For a safer approach, enable the built-in candle confirmation feature. This ensures a bullish signal is only finalized if the trigger bar closes green (or a bearish signal closes red), adding an extra layer of price-action validation to your execution.
4. Why Choose This Tool
In trading, consistency is everything. The ADX Double Divergence indicator removes the emotional bias and manual guesswork of drawing trendlines, replacing it with rigid, automated mathematical precision. Built from the ground up to run natively with infinite lookback capabilities without lagging your charts, it upgrades your strategy from single-layer signals to sequential "double" confirmations. This effectively filters out the market fakeouts that trap retail traders—giving you a sharper, more objective edge every time you step up to the screens.
5. Technical Inputs Manual: ADX 2 Div Pro
This manual details the configurable control variables for the ADX 2 Div Pro institutional-grade multi-layered divergence indicator. By understanding how these parameters alter the underlying chart logic and execution dynamics, traders can systematically optimize the system for specific market regimes, asset classes, and timeframes.
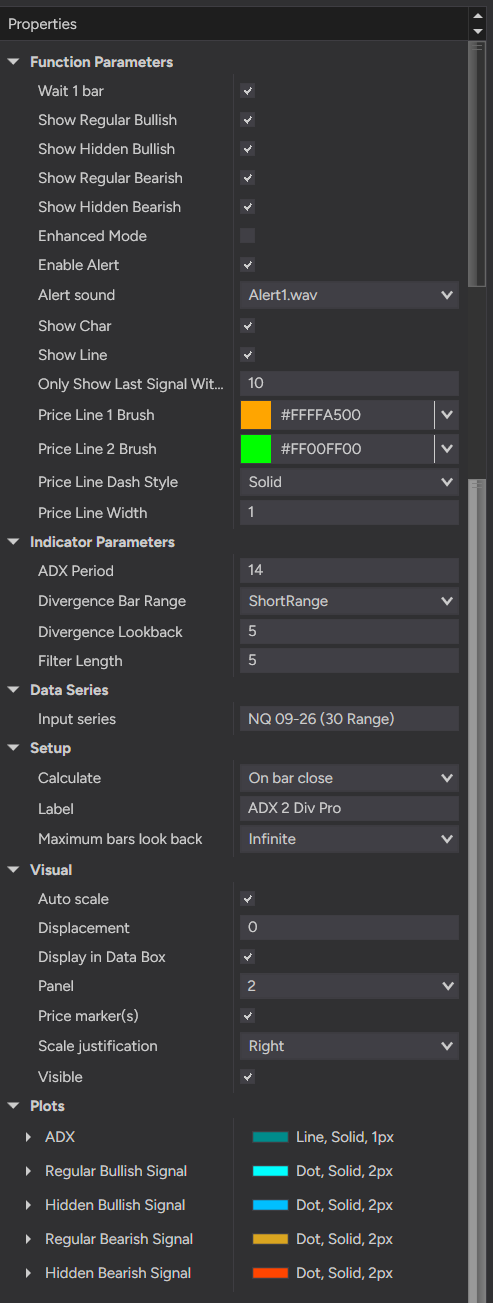
Wait 1 Bar
- Default Value: True
- Chart Logic: Controls the execution window and confirmation delay. When enabled (
True), a bullish signal is only finalized and plotted on the historical bar if the current execution bar closes with an upward bias (Close≥Open); conversely, a bearish signal requires a downward close (Close≤Open). When disabled (False), signals are registered instantly upon structural divergence fulfillment without candle directional validation. - Trading Strategy & Trade-offs: Enabling (
True) reduces execution slippage and protects against catching a "falling knife" during aggressive, one-directional momentum moves. It introduces a 1-bar lag but ensures that price action has begun to stabilize in the direction of the divergence before a trade is triggered. Highly reliable in volatile or trending environments. Disabling (False) minimizes entry lag, allowing aggressive mean-reversion traders to execute at the absolute extreme edges of a structural swing. However, it exposes the strategy to significant market noise, whipsaws, and false breakouts if the counter-trend momentum persists through the close of the bar. - Core Trading Recommendation: Keep enabled (
True) for day trading and swing trading on equities or crypto to filter out high-volatility stop-outs. Scalpers utilizing highly liquid, micro-timeframe charts (e.g., 1-minute or tick charts) may disable this feature to capture immediate alpha, provided they pair it with rigid manual risk management.
Show Regular Bullish / Show Regular Bearish
- Default Value: True
- Chart Logic: Toggles the calculation and visual presentation of regular structural divergence signals. Regular bullish divergence prints an automated marker when price registers a lower low while the underlying ADX lines form a higher low. Regular bearish divergence prints when price establishes a higher high but the trend intensity/ADX registers a lower high.
- Trading Strategy & Trade-offs: Activating (
True) arms the system to detect major macroeconomic or microstructural market reversals. Increasing focus on these inputs allows traders to capture major swing failure patterns (SFPs) and institutional liquidity sweeps at extreme structural boundaries. Deactivating (False) cleanses the chart of counter-trend signals. Deactivating regular divergence is ideal when a market is locked into a powerful macro-trend, where attempting to guess the absolute top or bottom results in compounding losses due to persistent trend extension. - Core Trading Recommendation: Keep active when trading ranging, mean-reverting, or cyclically rotating markets. If deploying this tool on an index or stock experiencing an unhedged trend expansion, deactivate regular signals and focus exclusively on continuation patterns.
Show Hidden Bullish / Show Hidden Bearish
- Default Value: True
- Chart Logic: Controls the visibility and computation of trend-continuation divergence signals. Hidden bullish divergence maps a higher structural price low against a lower ADX low, indicating a deep trend strength reset within an overarching uptrend. Hidden bearish divergence maps a lower price high against a higher ADX high, signaling a trend intensity reload within a broader downtrend.
- Trading Strategy & Trade-offs: Activating (
True) provides a continuous stream of low-risk, high-reward entries aligned with the dominant order flow. It excels at identifying the exact termination points of corrective pullbacks (buying the dip or selling the rip). Deactivating (False) limits the system exclusively to catching market tops and bottoms. Turning these off during a strong trend prevents the trader from participating in momentum pullbacks, drastically reducing trade frequency in highly liquid, trending environments. - Core Trading Recommendation: Essential for trend-following strategies and swing traders operating on higher timeframes (e.g., 4-Hour or Daily). Hidden divergence typically offers a significantly higher win rate than regular divergence because it executes in alignment with the institutional macro-path of least resistance.
Enhanced Mode
- Default Value: False
- Chart Logic: Applies a secondary, strict structural slope filter to the twin historical anchor peaks or troughs. When activated, it invalidates and suppresses regular or hidden signals if the internal geometry between the first and second historical swing points fails to maintain a specific directional trajectory.
- Trading Strategy & Trade-offs: Enabling (
True) drastically tightens the statistical filter, leading to a massive drop in overall signal frequency. The signals that do pass through exhibit an exceptionally high probability of success, making this mode ideal for high-conviction, large-size executions. It effectively eliminates marginal or "ugly" patterns. Disabling (False) operates on standard sequential divergence parameters, maximizing opportunity capture across all variations of double divergence structures. The trade-off is a heightened vulnerability to over-fitting, where minor structural micro-twists can generate false positives in choppy, sideways markets. - Core Trading Recommendation: Enable (
True) if you are managing automated trading systems or multi-asset prop-firm accounts where drawdowns must be kept at strict minimums. Keep disabled (False) for active discretionary manual trading where you can visually filter out poor market context yourself.
ADX Period
- Default Value: 14
- Chart Logic: Establishes the core lookback window used to calculate the directional movement and Average Directional Index lines. It acts as the foundational control variable for identifying overextended or compressing trend conditions.
- Trading Strategy & Trade-offs: Increasing this value (e.g., 20–30) heavily filters out market noise by smoothing the directional indicators. It smooths out the trend profile, significantly reducing the generation of false signals. The trade-off is substantial lagging, meaning you will miss early entries at turning points. Excellent for steady, trending macro-regimes. Decreasing this value (e.g., 7–10) hyper-sensitizes the trend engine to short-term velocity changes. This creates a much higher frequency of divergence signals at the absolute edges of swings, making it perfect for rapid scalping. The dangerous side effect is over-fitting, which leads to frequent whipsaws and false breakout signals during choppy, consolidative ranges.
- Core Trading Recommendation: Keep at the standard 14 for general daily operations. Swing traders focused on 4-Hour or Daily charts should consider widening this to 21 to capture institutional-grade shifts. Intraday scalpers can scale down to 9 to boost signal generation during active market sessions.
ADX Smoothing
- Default Value: 14 (Wilder's smoothing method)
- Chart Logic: Sets the moving average smoothing window applied directly to the raw DX line to generate the final ADX curve. This dampens erratic micro-ticks in trend strength before the double divergence logic scans for highs and lows.
- Trading Strategy & Trade-offs: Increasing this value produces an ultra-smooth trend curve, filtering out erratic spikes during high-volatility events like news releases. However, it delays when divergence is officially recognized, pushing entries further down the trend line and hurting your risk-to-reward ratio. Decreasing this value drastically reduces indicator lag, providing near-instant responses to momentum updates. The drawback is that it invites significant market noise, causing the indicator to flag minor, temporary momentum stalls as true double divergence structures.
- Core Trading Recommendation: Maintain a setting between 14 and 20. For highly liquid, orderly assets, a lower setting preserves optimal entry speed. For highly chaotic, news-driven assets (e.g., individual tech equities or crypto), consider increasing this to protect against premature entries.
Divergence Bar Range
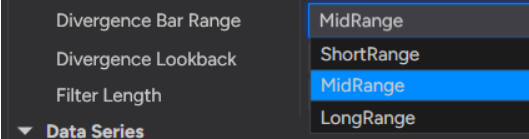
- Default Value: ShortRange
- Chart Logic: Defines the internal boundaries for the swing engine, dictating the minimum and maximum distance allowed between historical anchor points. It operates via three structural settings:
- ShortRange: Captures tight, immediate micro-swing structures to identify swift momentum shifts within localized price consolidations.
- MidRange: Filters for standard, intermediate swing structures to capture classic market swings and standard daily cycles.
- LongRange: Locks onto major macro-structural peaks and troughs, allowing the system to isolate foundational trend-reversal zones across extended time horizons.
- Trading Strategy & Trade-offs: Scaling Up (LongRange) tracks major institutional market turns and key swing failures across significant time horizons. Signal frequency drops substantially, but the macro reliability and risk-to-reward potential of each signal increase dramatically. Scaling Down (ShortRange) captures high-frequency micro-divergences within local consolidations. This provides rapid trade opportunities, but exposes the trader to sharp whipsaws when a market breaks out into a strong, sustained trend.
- Core Trading Recommendation: Match this parameter directly to your trading style: Use ShortRange for fast-paced intraday scalping, MidRange for standard intraday day trading, and LongRange for multi-day swing trading positions.
Divergence Lookback
- Default Value: 5
- Chart Logic: Controls the lookback window used by the local extreme calculation engine to identify valid swing peaks and troughs.
- Trading Strategy & Trade-offs: Increasing this value requires the market to sustain a swing high or low over a longer duration before it is accepted as a valid anchor point. This ensures that signals are only drawn from major, undeniable chart structures, drastically lowering false positives. The downside is increased signal lag. Decreasing this value allows the engine to lock onto quick, nimble pivot points. While this gives you early entries at potential turning points, it frequently misinterprets minor, noise-driven consolidations as significant double divergence structures.
- Core Trading Recommendation: Keep this perfectly balanced between 5 and 8. If you find yourself getting caught in multiple false breakouts during low-volatility market sessions, increase this setting to force the indicator to hunt for more significant structural anchors.
ADX Filter Threshold
- Default Value: 20 / 25
- Chart Logic: Sets the baseline threshold level for the ADX line. The indicator logic uses this baseline to confirm that a trend actually exists before a divergence signal is finalized. For instance, a bearish reversal double divergence might be blocked if the ADX is below 20, indicating there is no strong trend to reverse.
- Core Trading Recommendation: Keep at 20 or 25 to filter out choppy, trendless markets. If you are trading high-volatility breakout regimes, scale this up to 30 to guarantee you only take setups backed by serious institutional volume.
UI & Aesthetics Group
| Parameter | Default Value | Description |
|---|---|---|
| Enable Alert | True | Activates the real-time event listener and programmatic notification engine when a double divergence structure confirms. Always keep active in live production environments. |
| Alert Sound | Alert1.wav | Directs the program to pull a specific audio file upon signal generation, allowing the trader to assign unique auditory profiles to different assets or signal classes. |
| Show Char | True | Aligns the chart typography to print clear text abbreviations ("R" for Regular, "H" for Hidden) instead of basic geometric shapes, improving scannability across multi-screen setups. |
| Show Line | True | Governs the dynamic drawing engine that projects structural trendlines directly across the local price extremes and corresponding indicator values. |
| Only Show Last Signal Within Bars | 10 | Operates as an automated cleanup filter that dynamically manages chart clutter by erasing older drawings if a new signal fires within X bars. |
| Price Line 1 / 2 Brush | Orange / Lime | Controls the visual coloring of the structural trendlines connecting the current bar to the first swing point (Line 1) and from the first to the second swing point (Line 2). |
| Price Line Dash Style | Solid | Dictates the visual texture (Solid, Dash, Dot) of the lines connecting structural price extremes to help separate setups visually. |
| Price Line Width | 1 | Adjusts the thickness of the printed trendlines on the price panel, preventing structural lines from overwhelming the underlying candles. |
6. Universal Charting Adaptability
A core strength of the ADX Double Divergence indicator is its algorithmic flexibility. It is completely independent of standard time formatting, meaning its pattern-detection engine operates flawlessly across all major chart types supported by the platform. The tool seamlessly adapts to your specific analytical framework:
- Intraday & Momentum Charts: Capture lightning-fast institutional shifts on Tick, Volume, Range, and Second charts, filtering out pure time-based noise to focus on raw order flow velocity.
- Traditional Time-Based Intervals: Conduct classic technical analysis across standard macro horizons, including Minute, Day, Week, Month, and Year intervals.
- Advanced Price-Action Styles: Maximize trend-filtering capabilities by running the indicator on smoothed or structural chart geometries like Heiken Ashi, Kagi, and Renko.
Whether you are scalping micro-swings on high-frequency volume bars or tracking multi-month macro-structural shifts, the logic scales universally to ensure consistent, precision-drawn setups on any canvas you choose.
Write a review
Your Name:Your Review: Note: HTML is not translated!
Rating: Bad Good
Enter the code in the box below:
Latest
Welcome to Patternsmart
Converting your indicator from one platform to another.Custom Alert, Autotrader, Indicators, Scan, Screener, Strategy and Signals.
Copyright @ 2026 Patternsmart - All rights reserved
This website is for educational and informational
purposes only and should not be considered a solicitation to buy or sell a
futures contract or make any other type of investment decision. It's not recommended to use any single indicator as sole evaluation criteria. The companies
and services listed on this website are not to be considered a recommendation
and it is the reader's responsibility to evaluate any product, service, or
company. patternsmart is not responsible for the accuracy or content of any
product, service or company linked to on this website.
Futures trading
contains substantial risk and is not for every investor.Please read the following risk disclosure before considering the
trading of this product:
Futures Risk Disclosure. An investor could
potentially lose all or more than the initial investment. Risk capital is money
that can be lost without jeopardizing ones financial security or life style.
Only risk capital should be used for trading and only those with sufficient risk
capital should consider trading. Past performance is not necessarily indicative
of future results.
Trading stocks, options, futures and forex involves
speculation, and the risk of loss can be substantial.Investor must consider all
relevant risk factors, including their own personal financial situation, before
trading. Trading foreign exchange on margin carries a high level of risk, as
well as its own unique risk factors. Forex investments are subject to
counter-party risk, as there is no central clearing organization for these
transactions. Please read the following risk disclosure before considering the
trading of this product:
Forex Risk Disclosure. Spreads, Straddles, and other multiple-leg option
strategies can entail substantial transaction costs, including multiple
commissions, which may impact any potential return. Options are not suitable for
all investors as the special risks inherent to options trading may expose
investors to potentially rapid and substantial losses. Prior to trading options,
you should carefully read
Characteristics and Risks of Standardized Options.
patternsmart.com
will not be held liable for the loss of money or any damage caused from relying
on the information on this site. Any investment decision you make in your account is solely your responsibility.
TESTIMONIAL DISCLOSURE: TESTIMONIALS APPEARING ON OUR SITE MAY NOT BE REPRESENTATIVE OF THE EXPERIENCE OF OTHER CLIENTS OR CUSTOMERS AND IS NOT A GUARANTEE OF FUTURE PERFORMANCE OR SUCCESS.