
Your shopping cart is empty!
Shopping Cart
0 item(s) - FreeCustomization and Conversion for: Ctrader, MetaTrader(MT4, MT5), Thinkorswim, NinjaTrader, MultiCharts, Tradingview, Prorealtime, SierraChart, etc.
License renew price will be 20% off for the 2nd year and after.
Every Purchase Comes with a Coupon.
Share Your Experience. Help Other Traders Learn. Get Rewarded.
Share Your Experience. Help Other Traders Learn. Get Rewarded.
Featured




MoneyFlow Double Divergence Pro Indicator for cTrader

 (
(To navigate modern financial markets, intermediate and advanced traders must look beyond simple price tracking. While price represents the visible outcome of market activity, it does not reveal the volume-driven conviction behind the move.
The MoneyFlow Double Divergence Indicator for cTrader bridges this analytical gap. By integrating price action with underlying volume dynamics, this indicator helps you assess whether institutional accumulation or distribution is actively supporting price, helping you identify high-probability turning points and trend continuations.
The Capital Flow Perspective: Why Volume Dynamics Matter
Traditional momentum oscillators evaluate the speed of price movement but treat low-volume holiday drift and heavy institutional accumulation identically. This is a critical blind spot.
Money Flow analysis evaluates the relationship between price action and trading activity. It categorizes volume based on whether the period closed higher or lower than the previous session:
-
Accumulation (Buying Pressure): Heavy volume supporting rising price bars suggests strong institutional conviction.
-
Distribution (Selling Pressure): Expanding volume on declining bars suggests institutional liquidation.
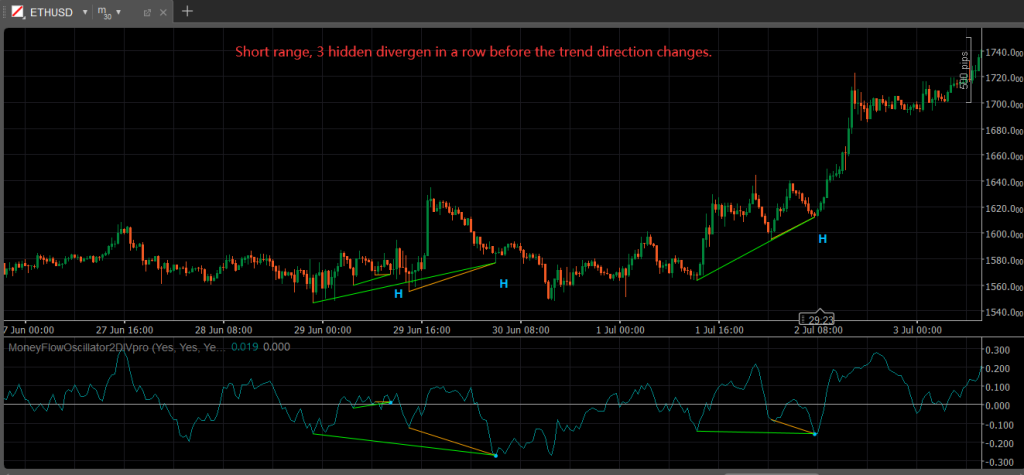
When these underlying volume dynamics diverge from price, it signals a mismatch between price direction and market participation.
The Double Divergence Methodology: A Confirmation-First Framework
In technical analysis, a single divergence can easily turn into market noise during strong trends. The PatternSmart Double Divergence methodology addresses this limitation by moving from a signal-first approach to a structured, confirmation-first analytical framework.
Rather than treating every divergence as an immediate trade signal, the methodology organizes technical observations to build cumulative evidence.
Price Action ➔ Indicator Behavior ➔ Double Divergence Check ➔ Technical Confirmation
By comparing price extremes with multiple structural confirmation points on the Money Flow index, this method filters out weak signals and highlights areas where buying or selling pressure has truly decoupled from price.
Understanding the Signal Classifications
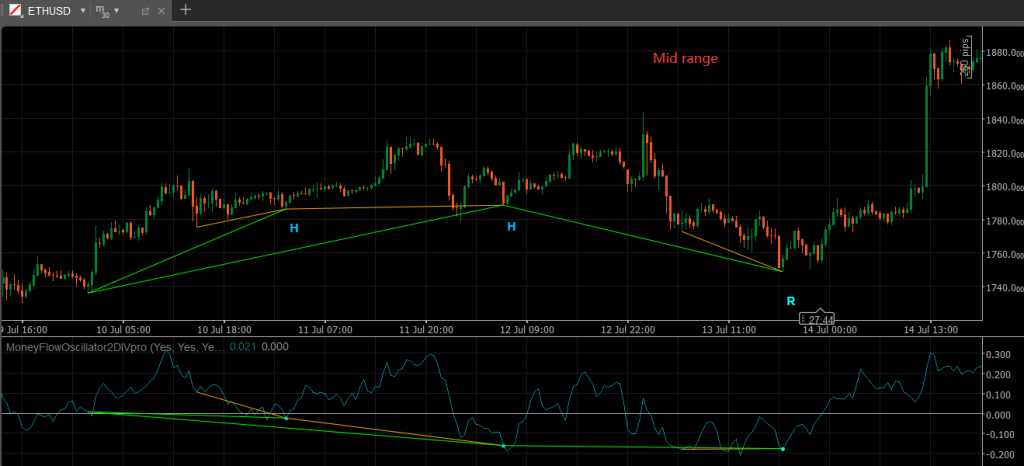
The MoneyFlow Double Divergence Indicator categorizes structural mismatches into four distinct, non-predictive observations:
1. Bullish Regular Divergence
-
Market Condition: Price forms a lower low, but the Money Flow indicator forms a higher low.
-
Analytical Meaning: Underlying selling pressure is drying up despite price printing a new low. This suggests a potential depletion of bearish conviction.
2. Bearish Regular Divergence
-
Market Condition: Price forms a higher high, but the Money Flow indicator forms a lower high.
-
Analytical Meaning: The upward price push lacks heavy capital participation, indicating a potential exhaustion of buying pressure.
3. Bullish Hidden Divergence
-
Market Condition: Price forms a higher low, but the Money Flow indicator prints a lower low.
-
Analytical Meaning: A temporary pullback has shaken out weak hands on deep volume, but the broader bullish trend structure remains intact.
4. Bearish Hidden Divergence
-
Market Condition: Price forms a lower high, but the Money Flow indicator prints a higher high.
-
Analytical Meaning: Temporary upward retracements are met with structural selling, indicating that bearish trend conviction remains dominant.
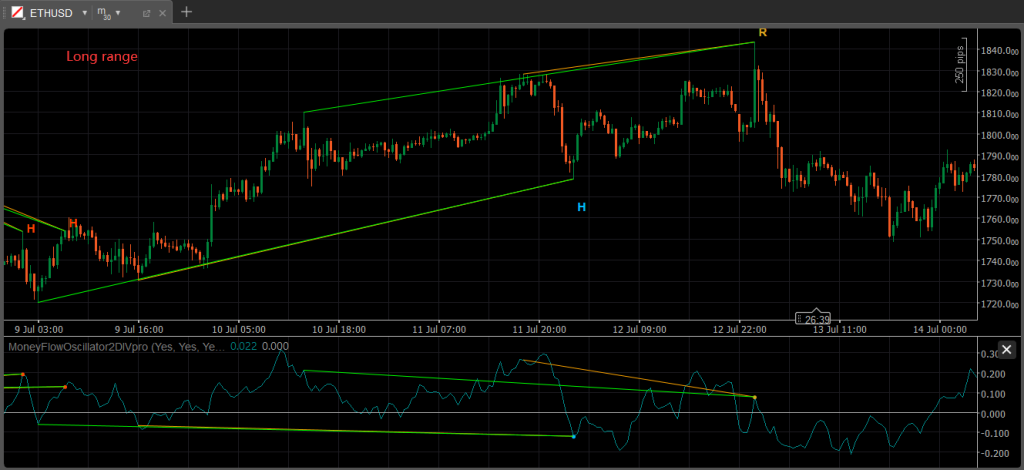
Engineered for cTrader: High-Performance Execution Meets Modern Analysis
The cTrader platform is widely recognized for its modern, execution-focused workflow and highly responsive C#-based charting engine.
The MoneyFlow Double Divergence Indicator is built specifically to leverage cTrader's asynchronous processing and clean user interface. It renders clear, real-time divergence lines directly onto your sub-charts without causing platform lag. Whether you are managing multiple workspaces or executing high-frequency swing trades, cTrader's native architecture ensures that volume-supported alerts are processed and displayed with absolute precision.
Advanced Tool Customization and Benefits
The indicator includes flexible parameters configured to fit your professional workflow:
-
Custom Alert Structures: Set up immediate visual or audio notifications when structural confirmation is met, allowing you to monitor multiple currency pairs or indexes simultaneously.
-
Divergence Customization: Fine-tune lookback periods and swing-point sensitivity to align the tool with your specific timeframe (e.g., intraday futures vs. daily equity analysis).
-
Improved Analytical Consistency: By organizing capital flow data into a clear visual hierarchy, the indicator reduces subjective charting errors and strengthens your technical confirmation process.
Adjustable Confirmation Controls
-
Inputs such as **Wait 1 Bar**, **Divergence Lookback**, **Divergence Bar Range** and **Filter Length** allow traders to balance signal responsiveness with confirmation quality according to their preferred analytical style.
- Fully Adjustable Parameters: Tailor the tool to your trading style by tweaking the periods, choosing between short, mid, or long-range swing lookbacks.
Analytical Best Practices
-
Context First: Always analyze the prevailing trend structure on a higher timeframe before interpreting a lower-timeframe divergence.
-
Combine Your Perspectives: Use MoneyFlow Double Divergence (Capital Flow) alongside tools like support/resistance levels or candlestick patterns to establish independent confirmation.
-
Accept Market Probability: Divergence is technical evidence, not a guarantee. Use disciplined risk management and position sizing on every trade.
Frequently Asked Questions
Q: How does Money Flow divergence differ from RSI divergence? A: RSI measures momentum based solely on price speed and magnitude. Money Flow incorporates volume to show the actual capital participation behind those price movements.
Q: Can I use this indicator on markets without centralized volume, like spot Forex? A: Yes. On spot Forex, cTrader uses tick volume (the frequency of price changes). Research shows tick volume is highly correlated with actual transactional volume, making the indicator highly effective for currency markets.
Q: Does this indicator generate automated buy and sell signals? A: No. It identifies structural mismatches between price and capital flow. It is an analytical tool designed to provide technical confirmation for your manual trading decisions.
Elevate Your Technical Confirmation
Are you ready to stop guessing where institutions are moving their capital? Add the MoneyFlow Double Divergence Indicator for cTrader to your toolkit today to bring structural volume confirmation to your technical analysis.
Looking for the complete mathematical breakdown, step-by-step optimization guides, and advanced trading strategies? Explore our comprehensive documentation:
-
Read the master guide on the Double Divergence Indicator Series.
-
Visit the Technical Inputs Manual: Double Divergence Pro for full parameter tuning.
Write a review
Your Name:Your Review: Note: HTML is not translated!
Rating: Bad Good
Enter the code in the box below:

Latest

Welcome to Patternsmart
Converting your indicator from one platform to another.Custom Alert, Autotrader, Indicators, Scan, Screener, Strategy and Signals.
Copyright @ 2026 Patternsmart - All rights reserved
This website is for educational and informational
purposes only and should not be considered a solicitation to buy or sell a
futures contract or make any other type of investment decision. It's not recommended to use any single indicator as sole evaluation criteria. The companies
and services listed on this website are not to be considered a recommendation
and it is the reader's responsibility to evaluate any product, service, or
company. patternsmart is not responsible for the accuracy or content of any
product, service or company linked to on this website.
Futures trading
contains substantial risk and is not for every investor.Please read the following risk disclosure before considering the
trading of this product:
Futures Risk Disclosure. An investor could
potentially lose all or more than the initial investment. Risk capital is money
that can be lost without jeopardizing ones financial security or life style.
Only risk capital should be used for trading and only those with sufficient risk
capital should consider trading. Past performance is not necessarily indicative
of future results.
Trading stocks, options, futures and forex involves
speculation, and the risk of loss can be substantial.Investor must consider all
relevant risk factors, including their own personal financial situation, before
trading. Trading foreign exchange on margin carries a high level of risk, as
well as its own unique risk factors. Forex investments are subject to
counter-party risk, as there is no central clearing organization for these
transactions. Please read the following risk disclosure before considering the
trading of this product:
Forex Risk Disclosure. Spreads, Straddles, and other multiple-leg option
strategies can entail substantial transaction costs, including multiple
commissions, which may impact any potential return. Options are not suitable for
all investors as the special risks inherent to options trading may expose
investors to potentially rapid and substantial losses. Prior to trading options,
you should carefully read
Characteristics and Risks of Standardized Options.
patternsmart.com
will not be held liable for the loss of money or any damage caused from relying
on the information on this site. Any investment decision you make in your account is solely your responsibility.
TESTIMONIAL DISCLOSURE: TESTIMONIALS APPEARING ON OUR SITE MAY NOT BE REPRESENTATIVE OF THE EXPERIENCE OF OTHER CLIENTS OR CUSTOMERS AND IS NOT A GUARANTEE OF FUTURE PERFORMANCE OR SUCCESS.