
Your shopping cart is empty!
Shopping Cart
0 item(s) - FreeCustomization and Conversion for: Ctrader, MetaTrader(MT4, MT5), Thinkorswim, NinjaTrader, MultiCharts, Tradingview, Prorealtime, SierraChart, etc.
License renew price will be 20% off for the 2nd year and after.
Every Purchase Comes with a Coupon.
Share Your Experience. Help Other Traders Learn. Get Rewarded.
Share Your Experience. Help Other Traders Learn. Get Rewarded.
Featured




WilliamsR Double Divergence Indicator for TradingView

 (
(Understand Market Extremes with Greater Confidence
One of the biggest challenges for new traders is deciding whether a market has moved too far in one direction. A strong rally can make it seem as though prices will continue rising forever, while a sharp decline can create unnecessary fear. In reality, markets often slow down or change direction before these shifts become obvious on the price chart.
This is where technical indicators can provide additional insight. The Williams %R Double Divergence Indicator for TradingView helps traders study the relationship between price movement and market momentum, making it easier to recognize situations that deserve closer attention. Rather than attempting to predict future prices, it supports a structured, confirmation-based approach to technical analysis.
What Is Williams %R?
Williams %R (Williams Percent Range) is a momentum indicator that measures where the current closing price sits within a recent trading range.
Think of it as answering a simple question:
"Is the current price near the top or the bottom of its recent range?"
When prices move close to the highest levels of the selected period, Williams %R moves toward its upper extreme. When prices fall toward the lowest levels, the indicator moves toward its lower extreme.
This helps traders recognize when a market may be becoming stretched or overextended. However, reaching an extreme does not automatically mean the market will reverse. Strong trends can remain near these levels for extended periods.
For this reason, experienced traders rarely rely on Williams %R alone. Instead, they look for additional evidence before drawing conclusions.
What Is Divergence?
Divergence occurs when price and an indicator stop moving in the same way.
For example:
-
Price reaches a new high, but Williams %R does not.
-
Price falls to a new low, but Williams %R does not.
This difference suggests that market momentum may be changing, even if price continues moving in the same direction.
Divergence should be viewed as an observation rather than a trading signal. It highlights situations that may deserve additional analysis instead of predicting what will happen next.
Understanding the Double Divergence Methodology
PatternSmart's Double Divergence methodology builds on traditional divergence by emphasizing confirmation rather than prediction.
Instead of encouraging traders to react immediately whenever divergence appears, the methodology promotes a simple analytical process:
-
Observe price movement.
-
Compare price with Williams %R.
-
Evaluate the divergence.
-
Look for additional confirmation.
-
Make a thoughtful trading decision.
This structured approach encourages patience and disciplined analysis instead of relying on isolated signals. The indicator is designed to provide additional analytical evidence, not guaranteed market forecasts.
Why Williams %R Works Well with Double Divergence
Williams %R focuses on market extremes, making it particularly useful when traders want to determine whether buying or selling pressure is beginning to lose strength.
When combined with the Double Divergence methodology, traders can more easily recognize situations where price continues moving while the underlying momentum no longer fully agrees.
For example:
-
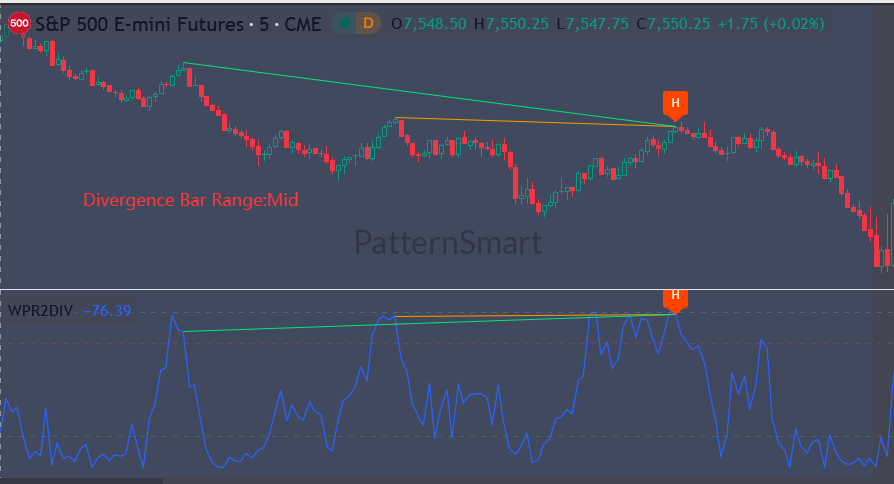
During an uptrend, price may continue making higher highs while Williams %R fails to confirm the move.
-
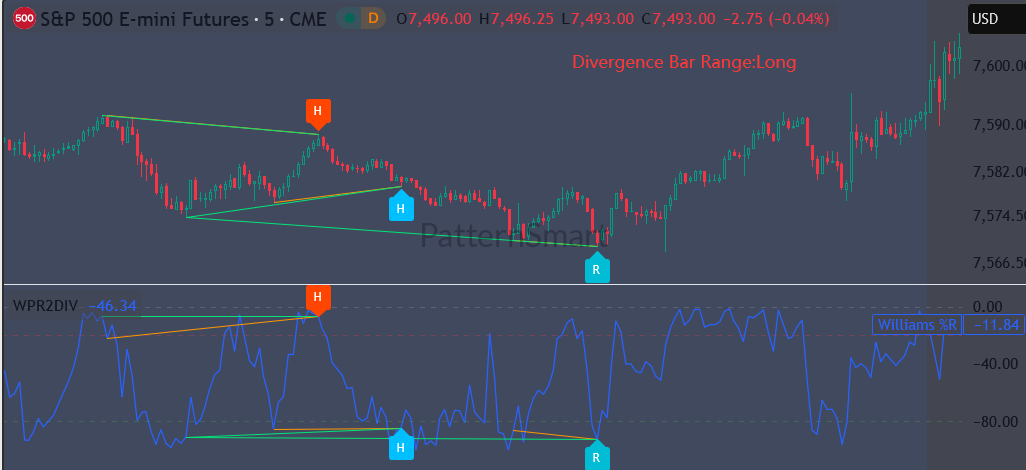
During a downtrend, price may continue making lower lows while Williams %R begins showing stronger momentum.
These situations do not guarantee a reversal, but they can encourage traders to examine market conditions more carefully before making decisions.
Designed for TradingView
TradingView is one of today's most popular charting platforms because it combines powerful analysis tools with an intuitive, cloud-based workflow.
Using the Williams %R Double Divergence Indicator within TradingView allows traders to:
-
Analyze charts from virtually any internet-connected device.
-
Monitor multiple financial markets from a single platform.
-
Customize chart layouts to match their preferred trading style.
-
Integrate divergence analysis naturally into their existing chart workflow.
The platform's clean interface makes it especially suitable for traders who want to learn technical analysis without unnecessary complexity.
Helpful Features
The Williams %R Double Divergence Indicator includes features that support both learning and practical chart analysis.
Automatic Divergence Detection
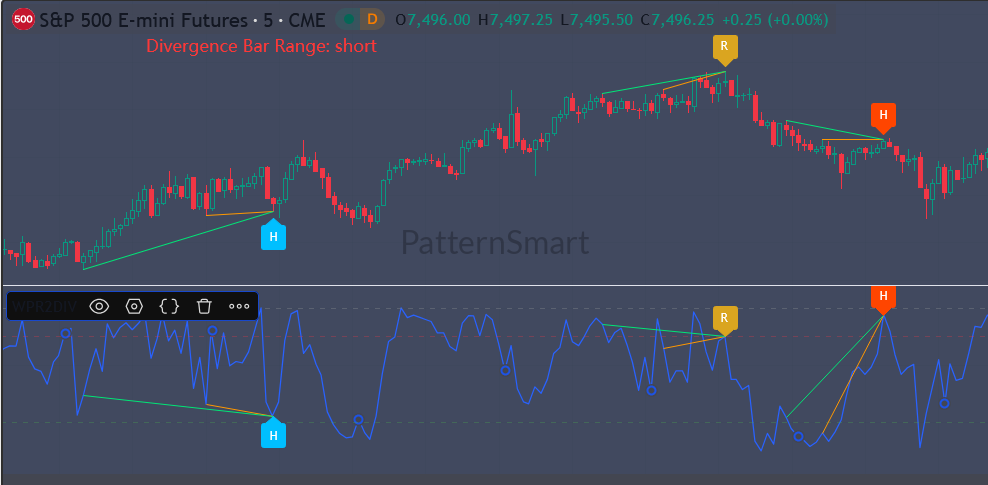
The indicator automatically identifies Regular and Hidden Divergence based on Williams %R, helping reduce the need for manual chart inspection.
Clear Chart Visualization
Divergence is displayed directly on the chart, making it easier to compare price action with indicator behavior and understand what the market is communicating.
Flexible Settings
Users can adjust the indicator to suit different markets, trading styles, and personal preferences without changing the underlying analytical methodology.
Alert Support
Alerts can notify traders when predefined divergence conditions appear, allowing them to monitor multiple charts more efficiently instead of constantly watching every market.
Read the master guide on the Double Divergence Indicator Series.
Visit the Technical Inputs Manual: Double Divergence Pro for full parameter tuning.
The WilliamsR Double Divergence Pro indicator is available in these platforms: Ctrader, MetaTrader(MT4, MT5), NinjaTrader 8, MultiCharts, MultiCharts x.NET, Tradingview(subchart only), Prorealtime(subchart only), SierraChart.
Access our full suite of technical analysis and research articles on the WilliansR Double Divergence Indicator here.
Practical Benefits
The Williams %R Double Divergence Indicator can help traders:
-
Better understand how momentum changes near market extremes.
-
Recognize divergence more consistently.
-
Build a more structured chart analysis routine.
-
Improve analytical discipline by seeking confirmation before acting.
-
Reduce manual effort when monitoring multiple markets.
Its goal is not to replace trader judgment but to support more organized technical analysis.
Frequently Asked Questions
Is this indicator suitable for beginners?
Yes. Although divergence is an advanced technical concept, the indicator presents it in a clear visual format that helps beginners understand how price and momentum interact.
Does divergence always mean the market will reverse?
No. Divergence simply indicates that price and Williams %R are behaving differently. Additional confirmation and market context remain important before making trading decisions.
What markets can I use it on?
TradingView supports a wide variety of markets, including stocks, futures, forex, cryptocurrencies, commodities, and indices. The methodology can be applied across all of them because it focuses on market behavior rather than a specific asset class.
Can I combine this indicator with other analysis methods?
Yes. Many traders combine divergence with support and resistance, trend analysis, price action, or higher-timeframe analysis to build a more complete view of market conditions.
Is the indicator a trading system?
No. The Williams %R Double Divergence Indicator is an analytical tool. It provides additional confirmation to support technical analysis but does not generate guaranteed buy or sell decisions.
Conclusion
Learning to recognize changing market conditions is an important step in becoming a more confident technical analyst. Williams %R offers valuable insight into market extremes, while the Double Divergence methodology provides a structured way to evaluate those observations within a broader analytical framework.
Rather than encouraging quick reactions, this approach emphasizes confirmation, context, and disciplined decision-making. Whether you are studying stocks, forex, futures, or cryptocurrencies, the Williams %R Double Divergence Indicator for TradingView can become a valuable addition to your technical analysis toolkit.
Explore the Williams %R Double Divergence Indicator
If you want to improve your understanding of divergence while using TradingView's modern charting environment, the PatternSmart Williams %R Double Divergence Indicator offers a practical, education-focused solution. Explore its features, apply the confirmation-first methodology to your own charts, and continue developing a disciplined approach to technical analysis.
Write a review
Your Name:Your Review: Note: HTML is not translated!
Rating: Bad Good
Enter the code in the box below:

Latest

Welcome to Patternsmart
Converting your indicator from one platform to another.Custom Alert, Autotrader, Indicators, Scan, Screener, Strategy and Signals.
Copyright @ 2026 Patternsmart - All rights reserved
This website is for educational and informational
purposes only and should not be considered a solicitation to buy or sell a
futures contract or make any other type of investment decision. It's not recommended to use any single indicator as sole evaluation criteria. The companies
and services listed on this website are not to be considered a recommendation
and it is the reader's responsibility to evaluate any product, service, or
company. patternsmart is not responsible for the accuracy or content of any
product, service or company linked to on this website.
Futures trading
contains substantial risk and is not for every investor.Please read the following risk disclosure before considering the
trading of this product:
Futures Risk Disclosure. An investor could
potentially lose all or more than the initial investment. Risk capital is money
that can be lost without jeopardizing ones financial security or life style.
Only risk capital should be used for trading and only those with sufficient risk
capital should consider trading. Past performance is not necessarily indicative
of future results.
Trading stocks, options, futures and forex involves
speculation, and the risk of loss can be substantial.Investor must consider all
relevant risk factors, including their own personal financial situation, before
trading. Trading foreign exchange on margin carries a high level of risk, as
well as its own unique risk factors. Forex investments are subject to
counter-party risk, as there is no central clearing organization for these
transactions. Please read the following risk disclosure before considering the
trading of this product:
Forex Risk Disclosure. Spreads, Straddles, and other multiple-leg option
strategies can entail substantial transaction costs, including multiple
commissions, which may impact any potential return. Options are not suitable for
all investors as the special risks inherent to options trading may expose
investors to potentially rapid and substantial losses. Prior to trading options,
you should carefully read
Characteristics and Risks of Standardized Options.
patternsmart.com
will not be held liable for the loss of money or any damage caused from relying
on the information on this site. Any investment decision you make in your account is solely your responsibility.
TESTIMONIAL DISCLOSURE: TESTIMONIALS APPEARING ON OUR SITE MAY NOT BE REPRESENTATIVE OF THE EXPERIENCE OF OTHER CLIENTS OR CUSTOMERS AND IS NOT A GUARANTEE OF FUTURE PERFORMANCE OR SUCCESS.