
Your shopping cart is empty!
Shopping Cart
0 item(s) - FreeCustomization and Conversion for: Ctrader, MetaTrader(MT4, MT5), Thinkorswim, NinjaTrader, MultiCharts, Tradingview, Prorealtime, SierraChart, etc.
License renew price will be 20% off for the 2nd year and after.
Every Purchase Comes with a Coupon.
Share Your Experience. Help Other Traders Learn. Get Rewarded.
Share Your Experience. Help Other Traders Learn. Get Rewarded.
Featured





RSI Double Divergence Pro Indicator for cTrader

 (
(RSI Double Divergence Pro for cTrader
Identify high-probability structural turnarounds and trend continuation patterns with automated dual-swing divergence detection.
Overview
RSI Double Divergence Pro is an advanced market structure and momentum indicator engineered for cTrader. Unlike traditional RSI divergence tools that analyze only single isolated peaks or troughs, RSI Double Divergence Pro utilizes a dual-swing reference framework.
By continuously evaluating current price and momentum behavior against two historical swing points, the indicator filters out weak market noise and highlights high-conviction setup locations across all timeframes and liquid asset classes.
Key Features
-
Dual-Swing Divergence DetectionScans up to 500 historical bars to identify structural swing points and validates momentum divergence using two prior pivot references rather than relying on a single swing.
-
Four Complete Signal Types
-
Regular Bullish Divergence: Detects potential trend reversals at market lows.
-
Regular Bearish Divergence: Identifies potential exhaustion points at market highs.
-
Hidden Bullish Divergence: Pinpoints trend-continuation opportunities during pullbacks.
-
Hidden Bearish Divergence: Highlights trend-continuation opportunities during corrective rallies.
-
-
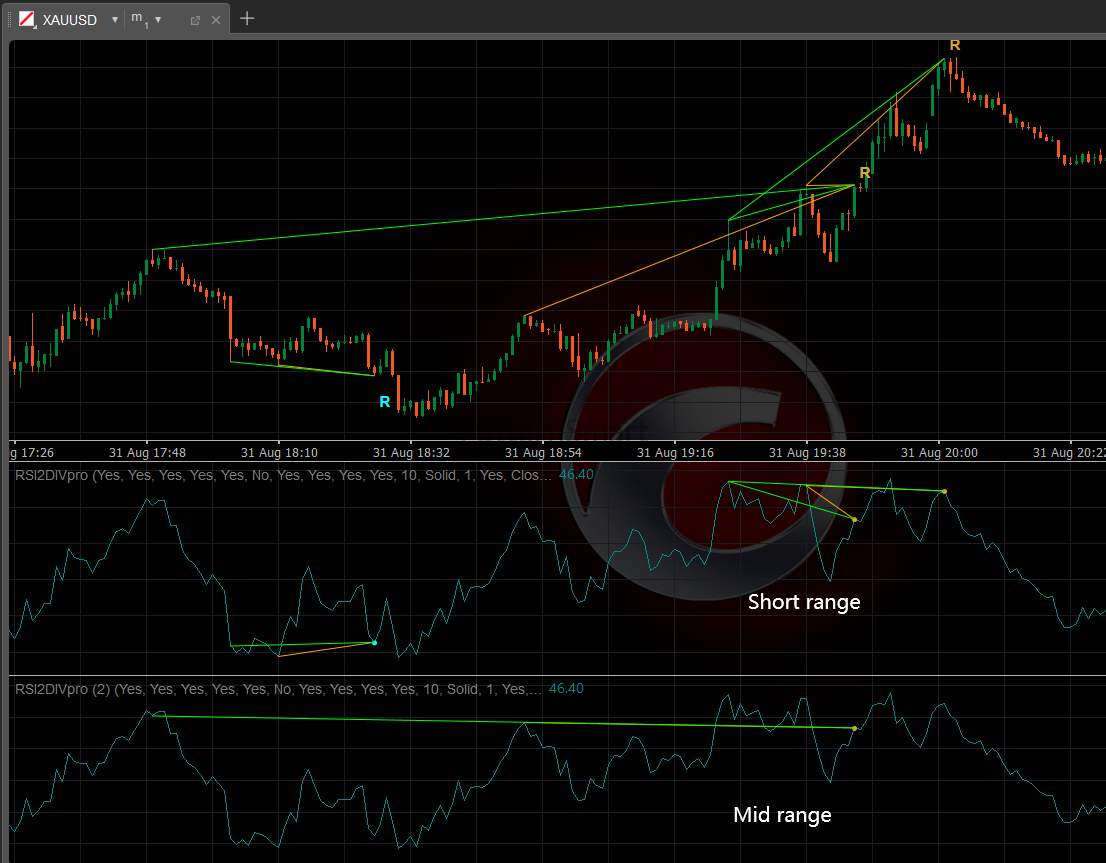
Multi-Range Swing ProfilingIncludes customizable lookback presets—Short Range, Mid Range, and Long Range—allowing you to adapt the sensitivity of swing point identification to match scalping, day trading, or swing trading strategies.
-
Enhanced Filtering EngineToggle the built-in Enhanced Mode to enforce structural hierarchy filters across swing points, helping eliminate secondary divergence signals that do not align with overall market geometry.
-
Bar Confirmation GuardAn optional Wait 1 Bar confirmation rule ensures that signals are validated only after bar closure, helping protect traders against false real-time painted entries.
-
Visual Chart & Indicator OverlayAutomatically draws trendlines on both the main price chart and the RSI indicator panel, connecting the relevant price pivots and momentum swings for quick context validation.
-
Customizable Alerts & NotificationsNever miss a trading opportunity with integrated cTrader pop-up message boxes and real-time alert triggers.
Visuals & Indicators Outputs
The indicator plots distinct visual outputs on both your price chart and the RSI sub-panel:
| Output Name | Description | Default Color / Style |
| RSI Line | Calculated RSI momentum oscillator line. | Dark Cyan Line |
| Regular Bullish Signal | Visual entry markers on confirmed regular bullish setups. | Aqua Dots / Character "R" |
| Hidden Bullish Signal | Entry markers for hidden bullish continuation setups. | Deep Sky Blue Dots / Character "H" |
| Regular Bearish Signal | Visual entry markers on confirmed regular bearish setups. | Goldenrod Dots / Character "R" |
| Hidden Bearish Signal | Entry markers for hidden bearish continuation setups. | Orange Red Dots / Character "H" |
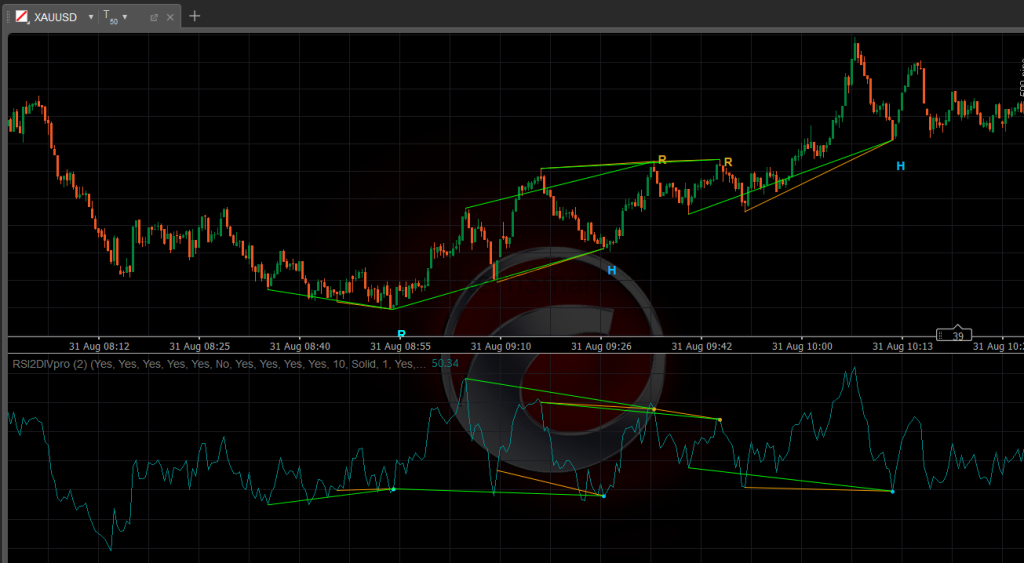
Indicator Parameters
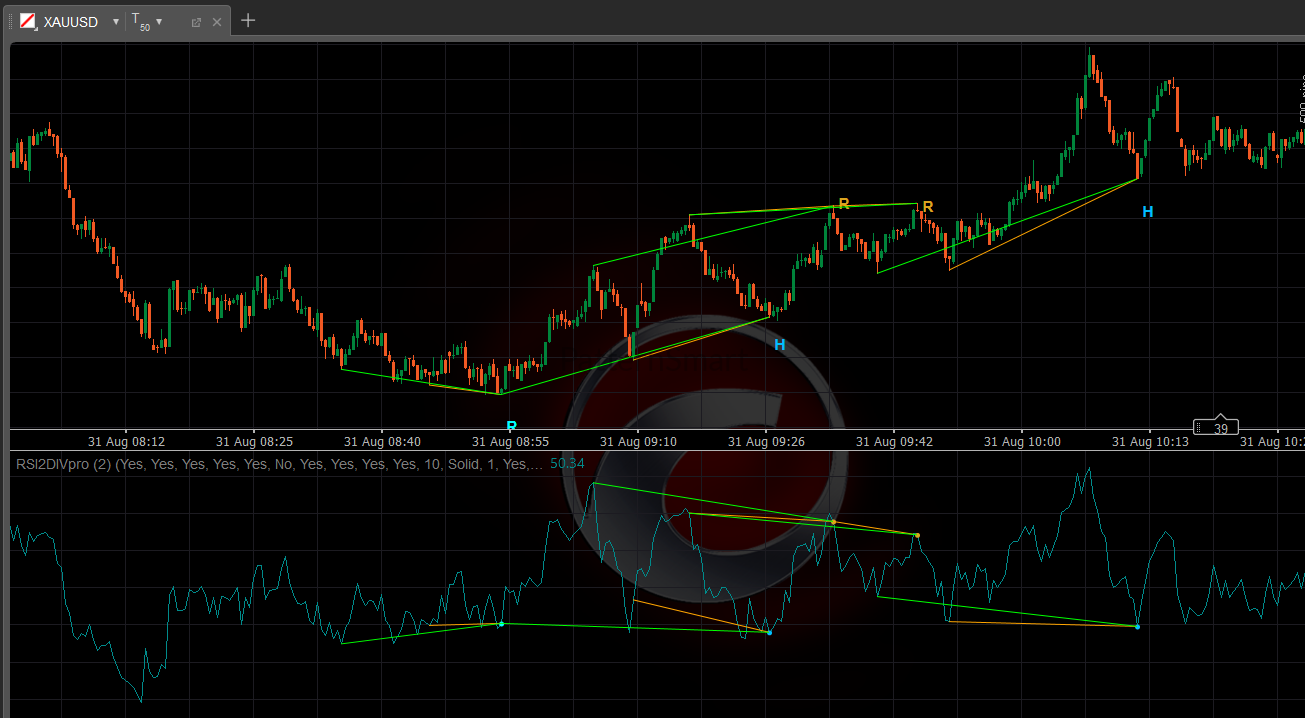
⚙️ Function Parameters
-
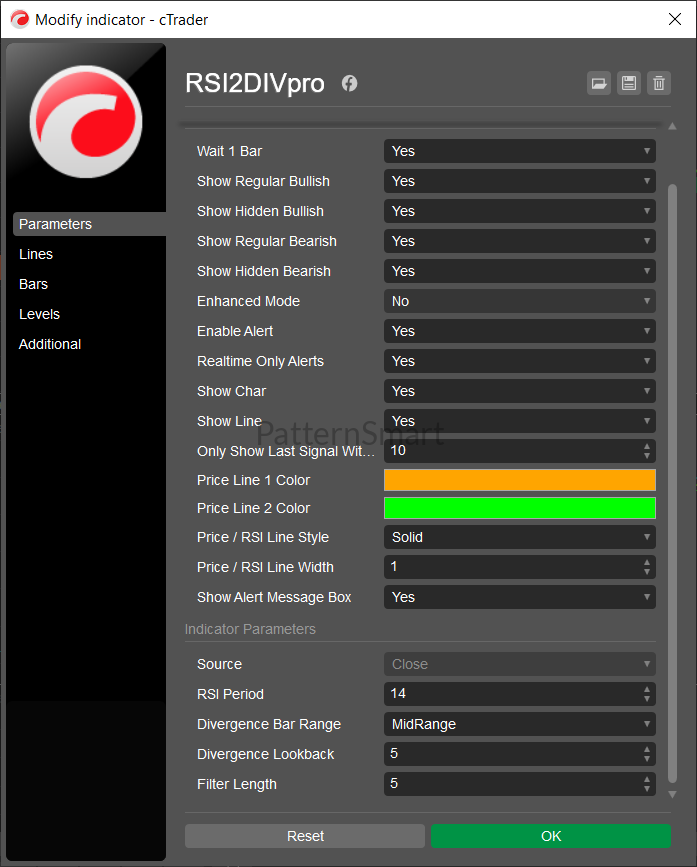
Wait 1 Bar (Default: True): Requires bar completion/confirmation before finalizing signal execution.
-
Show Regular Bullish (Default: True): Enables detection and visualization of regular bullish divergence setups.
-
Show Hidden Bullish (Default: False): Enables detection and visualization of hidden bullish divergence setups.
-
Show Regular Bearish (Default: True): Enables detection and visualization of regular bearish divergence setups.
-
Show Hidden Bearish (Default: False): Enables detection and visualization of hidden bearish divergence setups.
-
Enhanced Mode (Default: False): Enables strict structural alignment rules between the primary and secondary swing points.
-
Enable Alert (Default: True): Activates real-time audio and visual trading alerts.
-
Realtime Only Alerts (Default: True): Restricts alert triggers strictly to real-time incoming bars.
-
Show Char / Show Line (Default: True): Controls whether text tags (e.g., "R" or "H") and trendlines connecting swings are rendered on the chart.
-
Only Show Last Signal Within Bars (Default: 10): Restricts signal retention to maintain chart cleanliness.
-
Price Line Colors & Styles: Fully customizable line width, style (Solid, Dashed, etc.), and distinct colors for primary and secondary swing connections.
📊 Indicator Parameters
-
Source (Default: Close): The price series data used to calculate momentum.
-
RSI Period (Default: 14): The lookback period for calculating the core Relative Strength Index.
-
Divergence Bar Range (Default: ShortRange): Selects between ShortRange, MidRange, or LongRange swing evaluation zones.
-
Divergence Lookback (Default: 5): Sets the local evaluation window for price extreme comparison.
-
Filter Length (Default: 5): Configures the smoothing window used for momentum filtering.
Compatibility & Requirements
-
Markets: Forex, Indices, Commodities, Crypto, and Equities
-
Timeframes: Compatible with all timeframes (M1 through MN)
Looking for the complete mathematical breakdown, step-by-step optimization guides, and advanced trading strategies? Explore our comprehensive documentation:
-
Read the master guide on the Double Divergence Indicator Series.
-
Visit the Technical Inputs Manual: Double Div Pro for full parameter tuning.
Write a review
Your Name:Your Review: Note: HTML is not translated!
Rating: Bad Good
Enter the code in the box below:


Latest

Welcome to Patternsmart
Converting your indicator from one platform to another.Custom Alert, Autotrader, Indicators, Scan, Screener, Strategy and Signals.
Copyright @ 2026 Patternsmart - All rights reserved
This website is for educational and informational
purposes only and should not be considered a solicitation to buy or sell a
futures contract or make any other type of investment decision. It's not recommended to use any single indicator as sole evaluation criteria. The companies
and services listed on this website are not to be considered a recommendation
and it is the reader's responsibility to evaluate any product, service, or
company. patternsmart is not responsible for the accuracy or content of any
product, service or company linked to on this website.
Futures trading
contains substantial risk and is not for every investor.Please read the following risk disclosure before considering the
trading of this product:
Futures Risk Disclosure. An investor could
potentially lose all or more than the initial investment. Risk capital is money
that can be lost without jeopardizing ones financial security or life style.
Only risk capital should be used for trading and only those with sufficient risk
capital should consider trading. Past performance is not necessarily indicative
of future results.
Trading stocks, options, futures and forex involves
speculation, and the risk of loss can be substantial.Investor must consider all
relevant risk factors, including their own personal financial situation, before
trading. Trading foreign exchange on margin carries a high level of risk, as
well as its own unique risk factors. Forex investments are subject to
counter-party risk, as there is no central clearing organization for these
transactions. Please read the following risk disclosure before considering the
trading of this product:
Forex Risk Disclosure. Spreads, Straddles, and other multiple-leg option
strategies can entail substantial transaction costs, including multiple
commissions, which may impact any potential return. Options are not suitable for
all investors as the special risks inherent to options trading may expose
investors to potentially rapid and substantial losses. Prior to trading options,
you should carefully read
Characteristics and Risks of Standardized Options.
patternsmart.com
will not be held liable for the loss of money or any damage caused from relying
on the information on this site. Any investment decision you make in your account is solely your responsibility.
TESTIMONIAL DISCLOSURE: TESTIMONIALS APPEARING ON OUR SITE MAY NOT BE REPRESENTATIVE OF THE EXPERIENCE OF OTHER CLIENTS OR CUSTOMERS AND IS NOT A GUARANTEE OF FUTURE PERFORMANCE OR SUCCESS.