
Your shopping cart is empty!
Shopping Cart
0 item(s) - FreeCustomization and Conversion for: Ctrader, MetaTrader(MT4, MT5), Thinkorswim, NinjaTrader, MultiCharts, Tradingview, Prorealtime, SierraChart, etc.
License renew price will be 20% off for the 2nd year and after.
Every Purchase Comes with a Coupon.
Share Your Experience. Help Other Traders Learn. Get Rewarded.
Share Your Experience. Help Other Traders Learn. Get Rewarded.
Featured





CCI Double Divergence Pro for TradingView

 (
(Precision Momentum & Structural Reversal Detection Engine
CCI Double Divergence Pro is a high-performance technical analysis indicator engineered for TradingView. Designed for swing traders, day traders, and trend-following strategists, this tool automates the detection of multi-point momentum divergences across any asset class and timeframe.
Unlike standard single-swing oscillator overlays that generate excessive market noise, CCI Double Divergence Pro utilizes a dual-anchor scanning structure. By analyzing consecutive momentum swings against price action, it filters out low-probability setups and highlights high-conviction continuation and reversal points directly on both your price chart and subchart.
| Feature | Standard CCI Indicator | CCI Double Divergence Pro |
| Divergence Detection | Manual / Single Peak | Automated Dual-Swing Matrix |
| Chart Visualization | Subchart Line Only | Dual-Panel (Price Chart + Subchart) |
| Divergence Types | Basic Regular | Regular & Hidden (Bullish & Bearish) |
| False-Signal Filtering | None | Multi-Range & Structural Validation |
| Price Level Markers | None | ATR-Based Offset Markers ("R" / "H") |
| Real-Time Alerts | Basic Threshold Crosses | Fully Configurable Divergence Alerts |
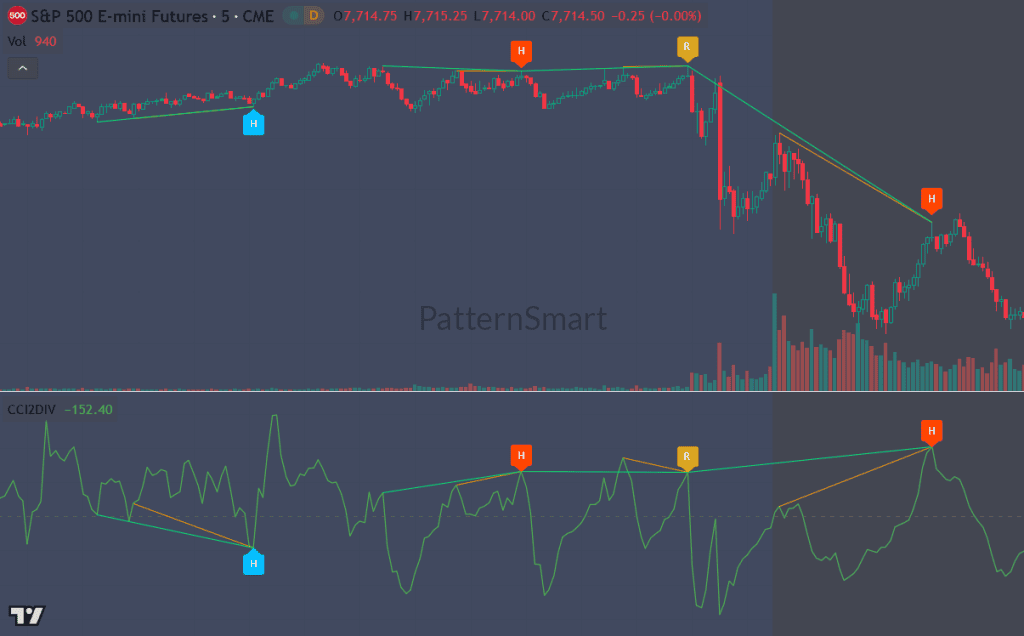
Key Trading Features & Capabilities
-
Dual-Anchor Swing Scanning: Identifies structural alignment between price peaks/troughs and momentum swings to deliver higher probability setup entries.
-
4-Way Divergence Classification: Spot Regular Bullish, Hidden Bullish, Regular Bearish, and Hidden Bearish divergences simultaneously.
-
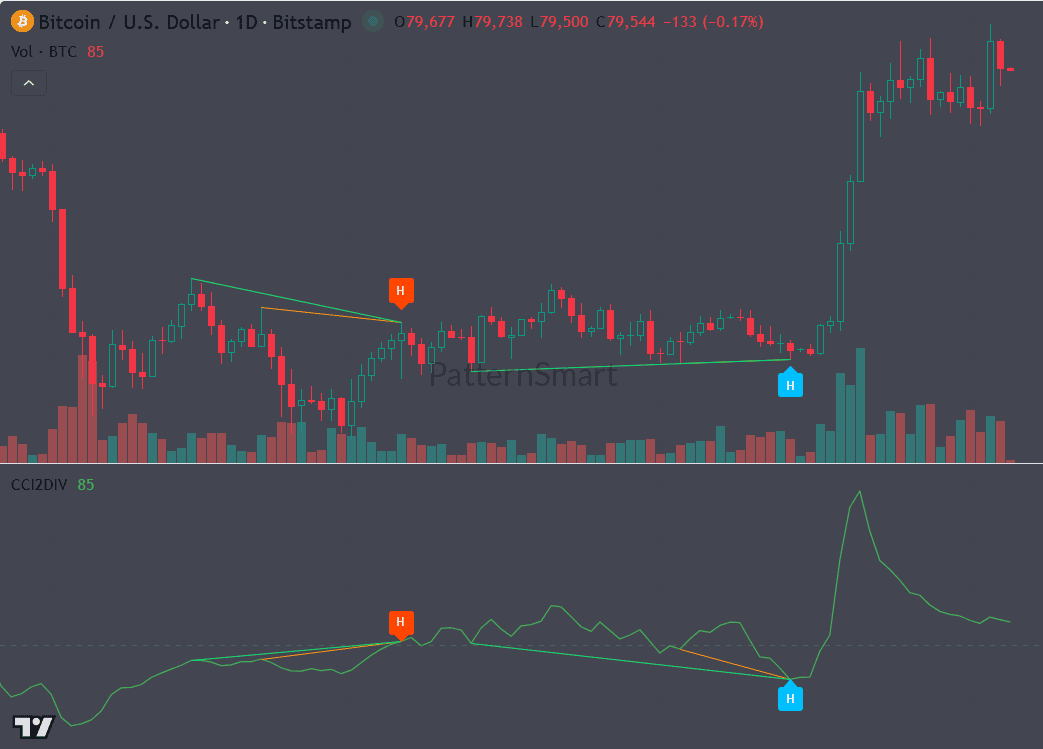
Dual-Panel Rendering System: Projects divergence trendlines and identification labels ("R" for Regular, "H" for Hidden) directly onto your main price candles as well as the CCI momentum pane.
-
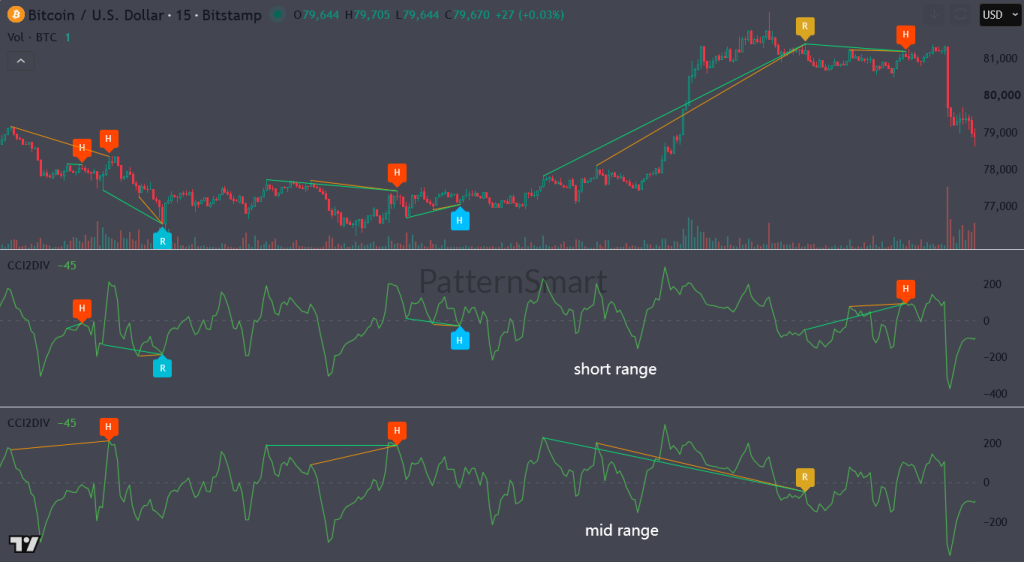
Multi-Range Profile Selection: Adapt to changing market volatility by switching between ShortRange, MidRange, and LongRange swing structures with a single click.
-
Enhanced Noise Suppression: Optional candle confirmation rules and structural validation algorithms prevent premature entries during aggressive market expansion.
-
Clutter Prevention Control: Limits duplicate signals within a user-defined bar distance, keeping your charts clean and focused on action items.
-
ATR-Adjusted Price Markers: Dynamically calculates Volatility Offsets via Average True Range (ATR) to ensure labels remain clearly visible above or below candle wicks.
-
Automated Alert Suite: Built-in alerts for instant webhook, email, or mobile notification triggers upon bar close confirmation.
Supported Divergence Signal Profiles
  REGULAR BULLISH (R)          HIDDEN BULLISH (H)          REGULAR BEARISH (R)          HIDDEN BEARISH (H)
Price: Lower Lows           Price: Higher Lows          Price: Higher Highs          Price: Lower Highs
CCI:   Higher Lows          CCI:   Lower Lows           CCI:   Lower Highs           CCI:   Higher Highs
[Reversal Signal]           [Continuation Signal]       [Reversal Signal]           [Continuation Signal]
1. Regular Divergence (Trend Reversals)
-
Regular Bullish ("R"): Price forms a lower low while momentum forms a higher low—signaling selling exhaustion and potential upward momentum.
-
Regular Bearish ("R"): Price forms a higher high while momentum forms a lower high—signaling buyer exhaustion and potential downward momentum.
2. Hidden Divergence (Trend Continuations)
-
Hidden Bullish ("H"): Price forms a higher low while momentum forms a lower low—indicating healthy pullbacks within a broader uptrend.
-
Hidden Bearish ("H"): Price forms a lower high while momentum forms a higher high—indicating short-term rallies inside a broader downtrend.
Fully Customizable Parameters
| Parameter Group | Option Name | Description / Recommended Purpose |
| Momentum | CCI Length |
Adjusts the lookback period for core momentum sensitivity (Default: 20). |
| Divergence Range | Divergence Bar Range |
Choose between ShortRange (scalping/intraday), MidRange (swing trading), or LongRange (macro trend analysis). |
Divergence Lookback |
Defines local swing window limits. | |
Filter Length |
Sets smoothing parameters to refine swing peak detection. | |
Swing Search Bars |
Maximum historical bar range scanned for setup alignment (Up to 1,000 bars). | |
| Filtering | Wait 1 Bar |
Requires candle close confirmation before printing signals, eliminating mid-bar repaint. |
Enhanced Mode |
Enables strict structural validation rules to eliminate weak micro-swings. | |
Only Show Last Same-Type |
Removes repetitive stacked markers within a set bar window (Default: 10 bars). | |
| Visuals & Style | Show Divergence Lines |
Toggles dynamic trendline connections on price and momentum panes. |
Show R/H Labels |
Displays clean text labels identifying Regular vs. Hidden setups. | |
Custom Colors |
Individual color management for all 4 divergence signal types and connector lines. |
Seamless Integration with TradingView Alerts
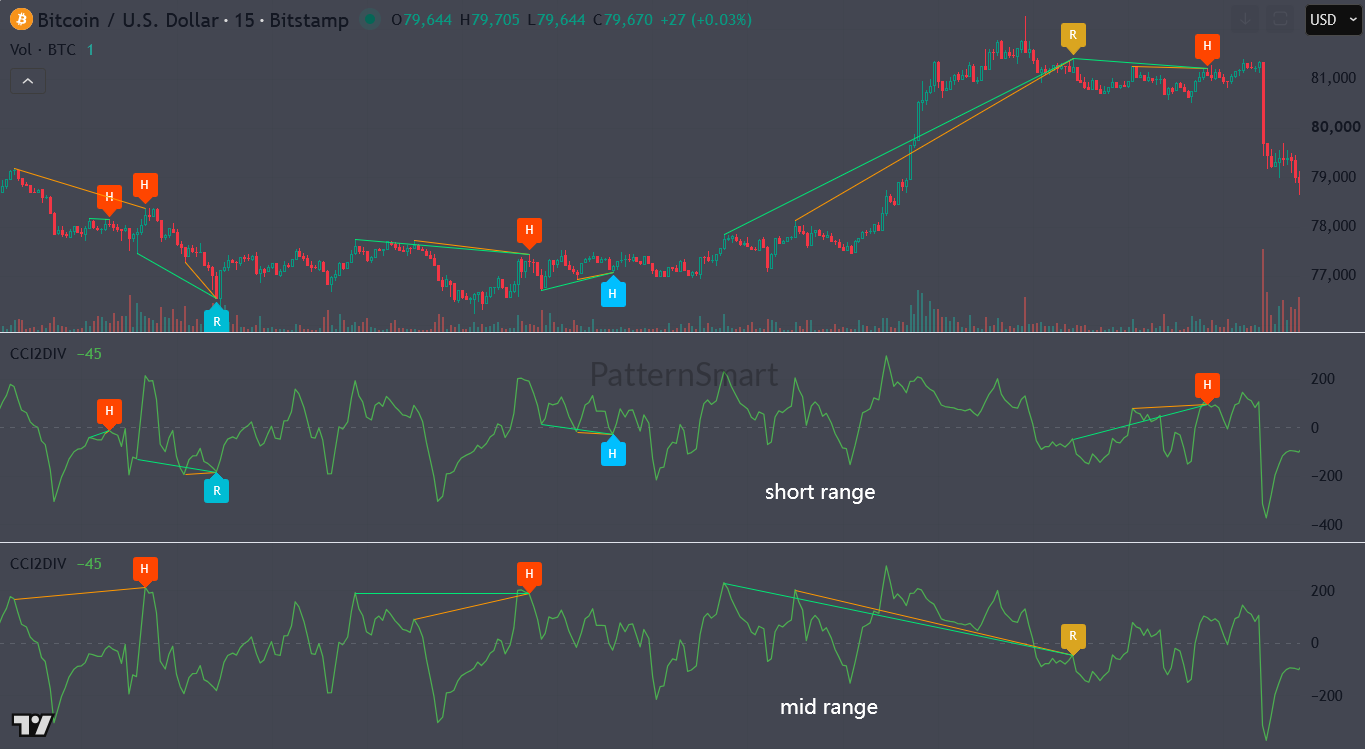
Stay informed without sitting in front of screens all day. CCI Double Divergence Pro includes native alerts built directly into the indicator interface:
-
Regular Bullish Alert: Triggers when a confirmed regular bullish divergence builds at potential price bottoms.
-
Hidden Bullish Alert: Triggers when trend continuation entries form during bullish pullbacks.
-
Regular Bearish Alert: Triggers when a confirmed regular bearish divergence forms at key price highs.
-
Hidden Bearish Alert: Triggers when trend continuation shorting opportunities appear during bearish retracements.
Frequently Asked Questions
Does CCI Double Divergence Pro repaint?
No. When the Wait 1 Bar option is enabled, all signals, labels, and trendlines are calculated and plotted on confirmed candle closes, guaranteeing zero repainting on historical or real-time charts.
Which asset classes work best with this indicator?
CCI Double Divergence Pro is asset-agnostic. It performs exceptionally across Forex, Crypto, Stocks, Indices, and Commodities.
What timeframes are recommended?
-
Scalping: 1-minute to 15-minute charts using ShortRange settings.
-
Day & Swing Trading: 1-hour to 4-hour charts using MidRange settings.
-
Position Trading: Daily and Weekly charts using LongRange settings.
Looking for the complete mathematical breakdown, step-by-step optimization guides, and advanced trading strategies? Explore our comprehensive documentation:
-
Read the master guide on the Double Divergence Indicator Series.
-
Visit the Technical Inputs Manual: Double Divergence Pro for full parameter tuning.
Access our full suite of technical analysis and research articles on the CCI Double Divergence Indicator here.

Write a review
Your Name:Your Review: Note: HTML is not translated!
Rating: Bad Good
Enter the code in the box below:

Latest

Welcome to Patternsmart
Converting your indicator from one platform to another.Custom Alert, Autotrader, Indicators, Scan, Screener, Strategy and Signals.
Copyright @ 2026 Patternsmart - All rights reserved
This website is for educational and informational
purposes only and should not be considered a solicitation to buy or sell a
futures contract or make any other type of investment decision. It's not recommended to use any single indicator as sole evaluation criteria. The companies
and services listed on this website are not to be considered a recommendation
and it is the reader's responsibility to evaluate any product, service, or
company. patternsmart is not responsible for the accuracy or content of any
product, service or company linked to on this website.
Futures trading
contains substantial risk and is not for every investor.Please read the following risk disclosure before considering the
trading of this product:
Futures Risk Disclosure. An investor could
potentially lose all or more than the initial investment. Risk capital is money
that can be lost without jeopardizing ones financial security or life style.
Only risk capital should be used for trading and only those with sufficient risk
capital should consider trading. Past performance is not necessarily indicative
of future results.
Trading stocks, options, futures and forex involves
speculation, and the risk of loss can be substantial.Investor must consider all
relevant risk factors, including their own personal financial situation, before
trading. Trading foreign exchange on margin carries a high level of risk, as
well as its own unique risk factors. Forex investments are subject to
counter-party risk, as there is no central clearing organization for these
transactions. Please read the following risk disclosure before considering the
trading of this product:
Forex Risk Disclosure. Spreads, Straddles, and other multiple-leg option
strategies can entail substantial transaction costs, including multiple
commissions, which may impact any potential return. Options are not suitable for
all investors as the special risks inherent to options trading may expose
investors to potentially rapid and substantial losses. Prior to trading options,
you should carefully read
Characteristics and Risks of Standardized Options.
patternsmart.com
will not be held liable for the loss of money or any damage caused from relying
on the information on this site. Any investment decision you make in your account is solely your responsibility.
TESTIMONIAL DISCLOSURE: TESTIMONIALS APPEARING ON OUR SITE MAY NOT BE REPRESENTATIVE OF THE EXPERIENCE OF OTHER CLIENTS OR CUSTOMERS AND IS NOT A GUARANTEE OF FUTURE PERFORMANCE OR SUCCESS.