
Your shopping cart is empty!
Shopping Cart
0 item(s) - FreeCustomization and Conversion for: Ctrader, MetaTrader(MT4, MT5), Thinkorswim, NinjaTrader, MultiCharts, Tradingview, Prorealtime, SierraChart, etc.
License renew price will be 20% off for the 2nd year and after.
Every Purchase Comes with a Coupon.
Share Your Experience. Help Other Traders Learn. Get Rewarded.
Share Your Experience. Help Other Traders Learn. Get Rewarded.
Featured



MoneyFlow Double Divergence Pro for Sierra Chart


 (
(Evaluating whether buying or selling pressure genuinely supports price action remains one of the most critical challenges in modern technical analysis.
Price movement alone illustrates where the market has been, but it does not always disclose the underlying conviction behind the move. When price advances on declining capital participation, or falls while buying pressure quietly builds, the market exhibits an internal disagreement.
The PatternSmart MoneyFlow Double Divergence Indicator for Sierra Chart bridges the gap between visible price action and underlying volume distribution. Built specifically for high-performance charting environments, this tool applies PatternSmart’s confirmation-first methodology to capital flow analysis, helping technical analysts observe institutional accumulation, market participation, and potential turning points with exceptional clarity.
Understanding Capital Flow: The Engine Behind Price Action
In professional trading, price is the visible outcome of an ongoing auction, while volume and capital flow represent the fuel driving that auction. Traditional momentum oscillators focus purely on the speed and magnitude of price changes. Capital flow analysis, by contrast, incorporates volume into price evaluation to determine whether capital is actively entering or exiting the market.
Under healthy market conditions, price action and money flow develop in harmony:
-
Sustained Bullish Trends: Higher prices are accompanied by steady or increasing money flow, reflecting active buying pressure and accumulation.
-
Sustained Bearish Trends: Lower prices align with declining money flow values, reflecting active selling pressure and distribution.
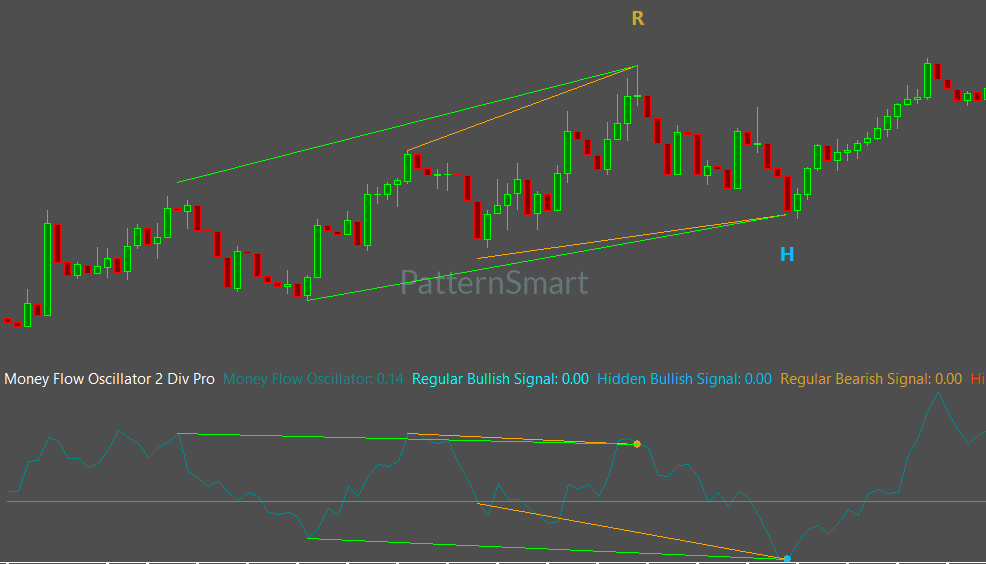
When price action and capital flow diverge, the market provides valuable analytical evidence. An advancing market accompanied by diminishing capital flow indicates that buying conviction may be deteriorating. Conversely, a declining market accompanied by rising money flow suggests that underlying accumulation may be occurring beneath the surface.
The Analytical Role of Money Flow Double Divergence
The Money Flow indicator evaluates the relationship between price and trading activity over a specified period. When integrated with PatternSmart’s Double Divergence methodology, it transitions from a simple secondary sub-chart into a structured confirmation engine.
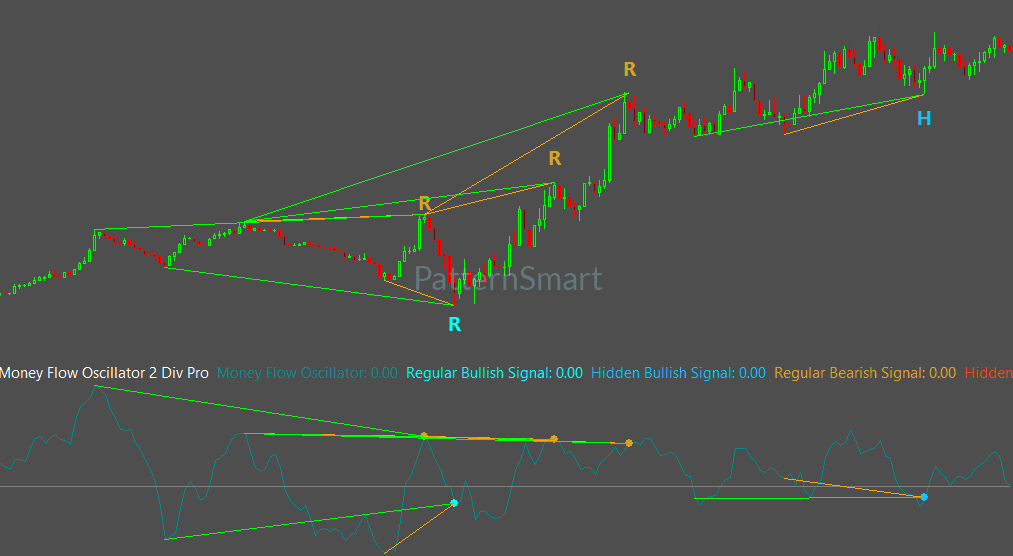
Divergence is fundamentally an analytical observation—it highlights a relationship where price and an indicator no longer agree. The Double Divergence methodology organizes these observations into a structured, confirmation-first framework. Rather than viewing every individual divergence as an immediate reversal signal, Double Divergence emphasizes comparing multiple historical structural points to evaluate signal quality and context.
 Price Action (New Extreme)
            │
            ├──► Disagreement ◄──┐
            │                   │
 Indicator Behavior (Fails Extreme)
            │
            ▼
 Double Divergence Detection
            │
            ▼
 Structural Confirmation (Wait 1 Bar / Enhanced Mode)
            │
            ▼
 High-Confidence Technical Evidence
Signal Classifications
The MoneyFlow Double Divergence Indicator identifies four distinct signal structures, each communicating unique information about market participation:
-
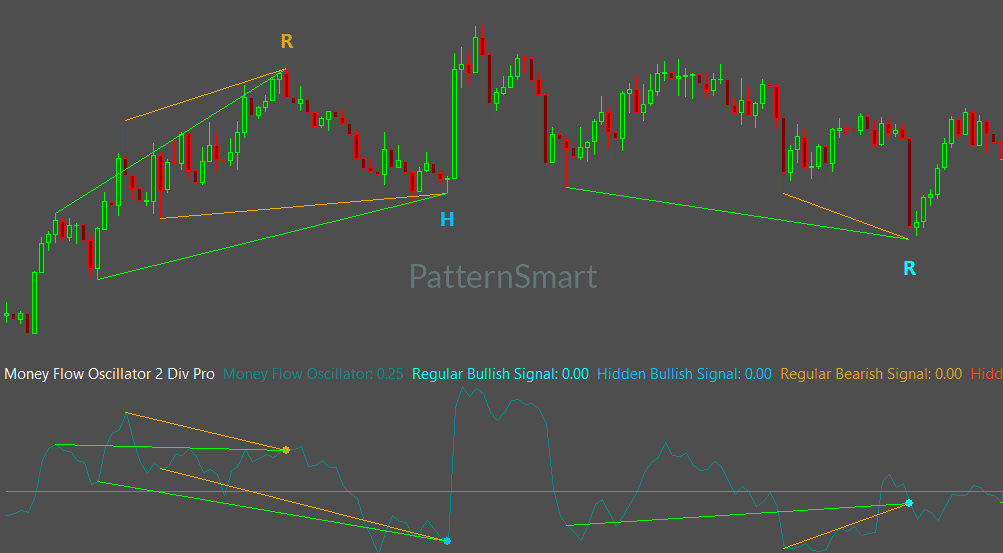
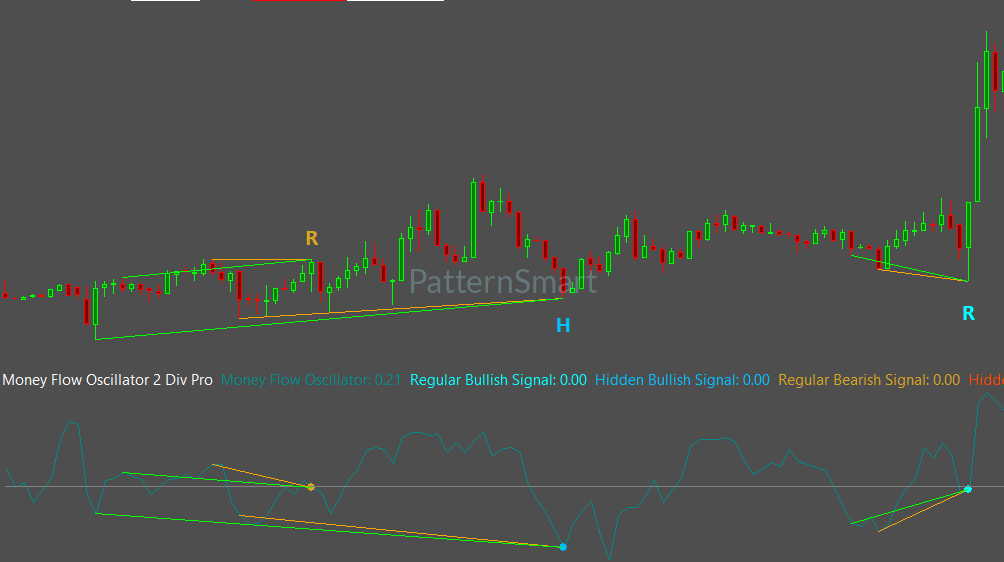
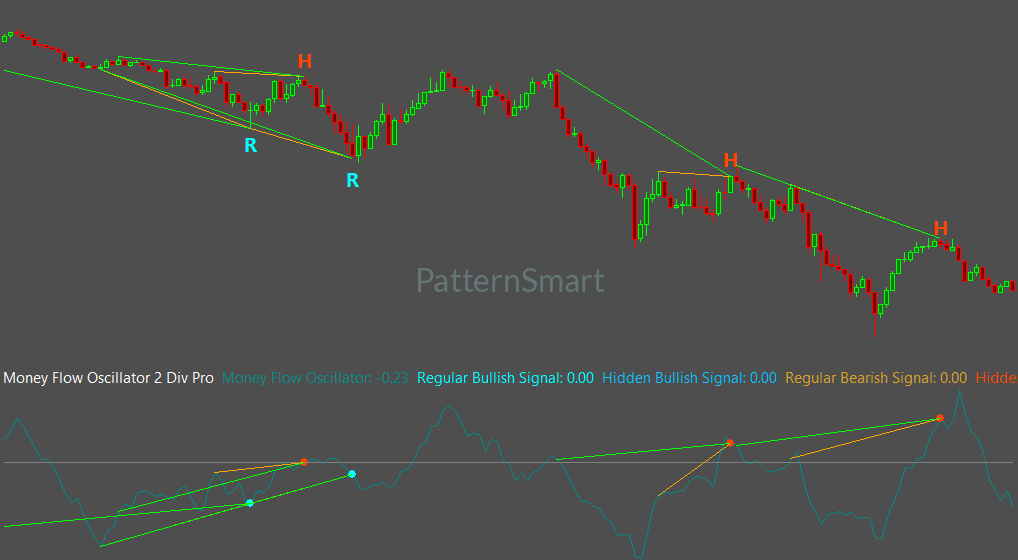
Bullish Regular Divergence: Price forms a lower low, but Money Flow forms a higher low. This indicates that despite lower prices, underlying selling pressure is diminishing and accumulation may be developing.
-
Bearish Regular Divergence: Price forms a higher high, but Money Flow forms a lower high. This suggests that despite higher prices, buying conviction is waning and distribution may be occurring.
-
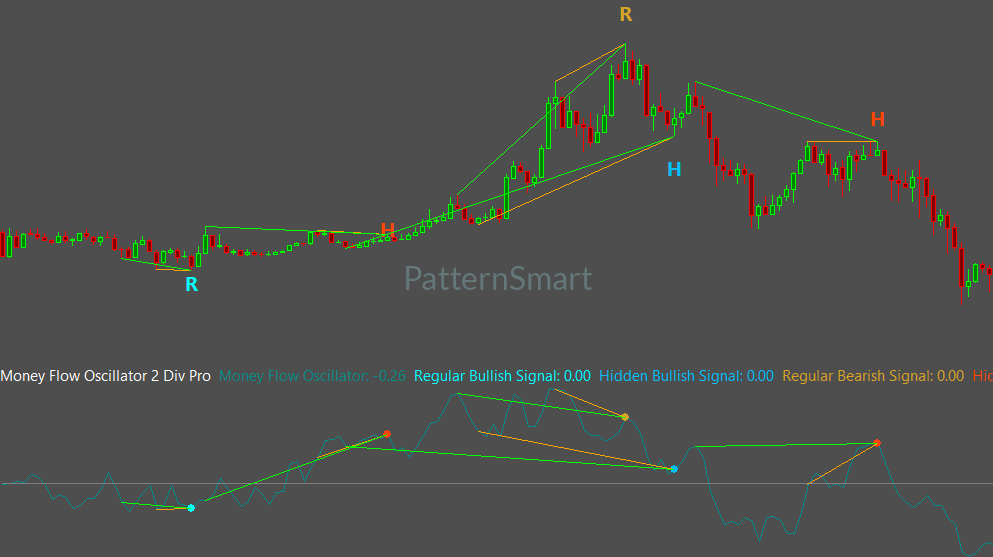
Bullish Hidden Divergence: Price forms a higher low, while Money Flow forms a lower low. This frequently occurs during temporary pullbacks within an established uptrend, signaling that underlying buying support remains intact.
-
Bearish Hidden Divergence: Price forms a lower high, while Money Flow forms a higher high. This often appears during temporary upward retracements within a broader downtrend, suggesting that overall selling pressure continues to dominate.
High-Performance Integration with Sierra Chart
Sierra Chart is widely recognized among professional futures traders and quantitative analysts for its processing speed, data handling efficiency, and advanced charting precision. The MoneyFlow Double Divergence Indicator is engineered specifically to match Sierra Chart’s high-performance architecture.
       [ Sierra Chart Data Engine ]
                    │
                    ▼
  [ High-Precision Volume & Price Data ]
                    │
                    ▼
 [ MoneyFlow Double Divergence Calculation ]
                    │
   ┌────────────────┴────────────────┐
   ▼                                 ▼
[ Native Chart Visualization ]   [ Real-Time Audio & Pop-up Alerts ]
Professional Workflow Benefits
-
Execution Speed & Stability: Runs natively inside Sierra Chart without taxing system resources, even during high-volatility sessions or multi-chart setups.
-
Intraday & Tick Precision: Volume-weighted money flow calculations rely on precise tick-by-tick and bar data, making the indicator highly responsive for active futures and index analysis.
-
Clean Chart Integration: Visual elements display seamlessly over Sierra Chart price panels and sub-charts, keeping workspace clutter to a minimum.
Key Software Features
The MoneyFlow Double Divergence Indicator for Sierra Chart includes a suite of configurable settings from the official Double Divergence Pro feature set, allowing users to tailor signal generation, filtering, and presentation to their workflow.
Core Configuration Inputs
-
Wait 1 Bar (
Default: True): Adds a mandatory one-bar confirmation requirement before finalizing a divergence signal. Waiting for the bar to close helps filter out transient intraday spikes and ensures that signals are calculated on completed structural data. -
Enhanced Mode (
Default: False): Applies a secondary layer of structural validation to detected divergence events. Enhanced Mode evaluates additional geometric relationships between historical anchor points, filtering out weaker setups and prioritizing higher-quality technical structures. -
Divergence Bar Range (
Default: ShortRange): Controls the structural search scope between historical swing points. Users can selectShortRange,MidRange, orLongRangeto focus on compact intraday setups or broader swing structures. -
Divergence Lookback (
Default: 5): Sets the historical bar evaluation window used to identify significant local swing highs and swing lows across price and volume data. -
Enable Alert (
Default: True): Triggers real-time notifications—including platform sound files (Alert Sound) and visual messages—the moment a valid signal satisfies all confirmation criteria.
Practical Analytical Benefits
Integrating MoneyFlow Double Divergence into a technical analysis framework offers several practical advantages:
-
Evaluates Market Conviction: Moves beyond simple price tracking by incorporating trading activity, helping analysts assess whether trend movements receive genuine capital support.
-
Filters False Breakouts: Identifies situations where price breaks to new highs or lows without volume confirmation, helping traders avoid low-conviction market traps.
-
Improves Signal Discipline: Emphasizes structural confirmation over aggressive anticipation, promoting objective decision-making rather than impulsive entries.
-
Streamlines Multi-Market Analysis: Provides a consistent, repeatable analytical process that can be applied across futures, equities, Forex, and ETF markets.
Frequently Asked Questions
What makes Money Flow different from standard volume indicators?
Standard volume indicators measure total trading activity during a given period regardless of direction. Money Flow combines volume with price movement to evaluate whether volume is occurring predominantly on up-bars or down-bars, providing a clearer picture of buying versus selling pressure.
Can MoneyFlow Double Divergence be used for intraday trading in Sierra Chart?
Yes. The indicator is optimized for high-performance intraday charting. Traders frequently use it on short-term tick, volume, or time-based charts to analyze market participation during active trading sessions.
Does the "Wait 1 Bar" setting delay signal detection?
"Wait 1 Bar" delays signal confirmation until the bar following the divergence has completely closed. While this produces a one-bar delay, it significantly improves signal stability by preventing signals from disappearing if price fluctuates before bar completion.
Is Money Flow effective in markets without central exchange volume?
Money Flow relies on reliable volume data. It is most effective in centralized markets such as futures, equities, and ETFs. In decentralized markets like spot Forex, tick volume can be used as a proxy, though exchange-based volume provides the highest analytical accuracy.
Looking for the complete mathematical breakdown, step-by-step optimization guides, and advanced trading strategies? Explore our comprehensive documentation:
Visit the Technical Inputs Manual: Double Divergence Pro for full parameter tuning.
Read the master guide on the Double Divergence Indicator Series.
Conclusion
Technical analysis is most effective when it combines complementary sources of market evidence. While price action shows direction, capital flow reveals participation. The PatternSmart MoneyFlow Double Divergence Indicator for Sierra Chart combines volume-weighted money flow analysis with a rigorous, confirmation-first divergence methodology, equipping traders with a clear, objective tool for evaluating market strength and structural conviction.
Write a review
Your Name:Your Review: Note: HTML is not translated!
Rating: Bad Good
Enter the code in the box below:


Latest

Welcome to Patternsmart
Converting your indicator from one platform to another.Custom Alert, Autotrader, Indicators, Scan, Screener, Strategy and Signals.
Copyright @ 2026 Patternsmart - All rights reserved
This website is for educational and informational
purposes only and should not be considered a solicitation to buy or sell a
futures contract or make any other type of investment decision. It's not recommended to use any single indicator as sole evaluation criteria. The companies
and services listed on this website are not to be considered a recommendation
and it is the reader's responsibility to evaluate any product, service, or
company. patternsmart is not responsible for the accuracy or content of any
product, service or company linked to on this website.
Futures trading
contains substantial risk and is not for every investor.Please read the following risk disclosure before considering the
trading of this product:
Futures Risk Disclosure. An investor could
potentially lose all or more than the initial investment. Risk capital is money
that can be lost without jeopardizing ones financial security or life style.
Only risk capital should be used for trading and only those with sufficient risk
capital should consider trading. Past performance is not necessarily indicative
of future results.
Trading stocks, options, futures and forex involves
speculation, and the risk of loss can be substantial.Investor must consider all
relevant risk factors, including their own personal financial situation, before
trading. Trading foreign exchange on margin carries a high level of risk, as
well as its own unique risk factors. Forex investments are subject to
counter-party risk, as there is no central clearing organization for these
transactions. Please read the following risk disclosure before considering the
trading of this product:
Forex Risk Disclosure. Spreads, Straddles, and other multiple-leg option
strategies can entail substantial transaction costs, including multiple
commissions, which may impact any potential return. Options are not suitable for
all investors as the special risks inherent to options trading may expose
investors to potentially rapid and substantial losses. Prior to trading options,
you should carefully read
Characteristics and Risks of Standardized Options.
patternsmart.com
will not be held liable for the loss of money or any damage caused from relying
on the information on this site. Any investment decision you make in your account is solely your responsibility.
TESTIMONIAL DISCLOSURE: TESTIMONIALS APPEARING ON OUR SITE MAY NOT BE REPRESENTATIVE OF THE EXPERIENCE OF OTHER CLIENTS OR CUSTOMERS AND IS NOT A GUARANTEE OF FUTURE PERFORMANCE OR SUCCESS.