
Your shopping cart is empty!
Shopping Cart
0 item(s) - FreeCustomization and Conversion for: Ctrader, MetaTrader(MT4, MT5), Thinkorswim, NinjaTrader, MultiCharts, Tradingview, Prorealtime, SierraChart, etc.
License renew price will be 20% off for the 2nd year and after.
Every Purchase Comes with a Coupon.
Share Your Experience. Help Other Traders Learn. Get Rewarded.
Share Your Experience. Help Other Traders Learn. Get Rewarded.
Featured




ADX Double Divergence Pro for MultiCharts x.NET


 (
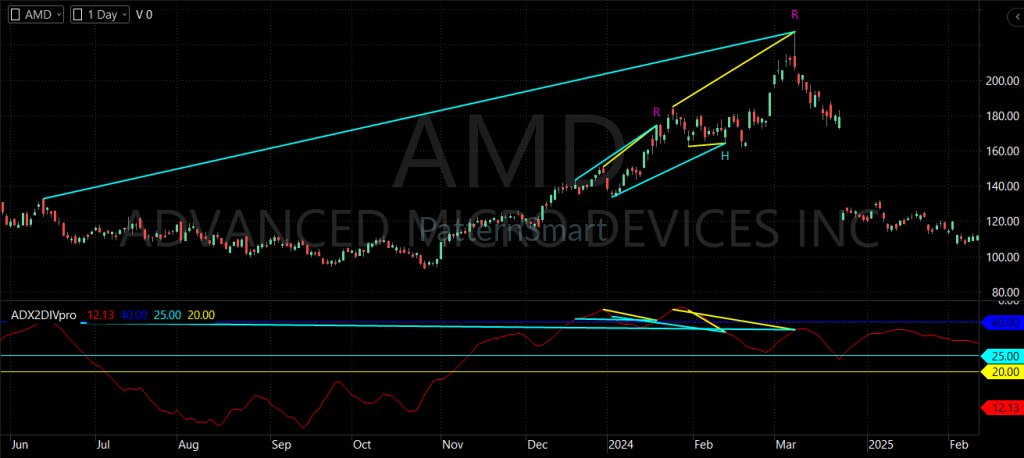
(In trend-following analysis, one of the most persistent technical challenges is distinguishing between a healthy, sustainable trend and a market movement that is losing underlying structural conviction. While price alone may continue to print new highs or lows, trend quality often deteriorates silently beneath the surface. The PatternSmart ADX Double Divergence Indicator for MultiCharts .NET addresses this exact challenge by combining classic Average Directional Index (ADX) mechanics with PatternSmart's proprietary confirmation-based Double Divergence methodology. Designed natively for the MultiCharts .NET development and charting ecosystem, this software equips quantitative developers, systematically-minded technical analysts, and active futures traders with objective, high-probability trend quality signals.
Understanding the Market Challenge: Trend Strength vs. Price Direction
A fundamental principle of market analysis is that price movement and trend conviction do not always move in tandem. Traded markets frequently establish new price extremes driven by momentum, even as underlying trend strength begins to erode.
+-----------------------------------------------------------------------+
|                       PRICE VS. TREND STRENGTH                        |
|                                                                       |
|  Price Action:        Higher High  --->  Higher High (New Extreme)    |
|  ADX Indicator:       Peak High    --->  Lower High  (Divergence)      |
|                                                                       |
|  Analytical Insight: Declining Trend Quality / Possible Exhaustion   |
+-----------------------------------------------------------------------+
Traditional trend-following systems often fail during these transition phases because they evaluate price direction without measuring directional conviction. When price advances while trend strength deteriorates, market participants face heightened risk of sudden pullbacks or trend reversals. Evaluating trend quality—rather than merely tracking price trajectory—is essential for objective market analysis.
The ADX Indicator and Trend Strength Analysis
The Average Directional Index (ADX) is widely recognized as a premier measurement of trend strength. Unlike momentum oscillators (such as RSI or Stochastics) that focus on speed and relative extremes, ADX measures the intensity and sustainability of a trend regardless of directional bias.
-
High ADX Values: Indicate strong, sustained directional movement (a healthy trend environment).
-
Low ADX Values: Indicate consolidation, choppy range-bound conditions, or a lack of directional conviction.
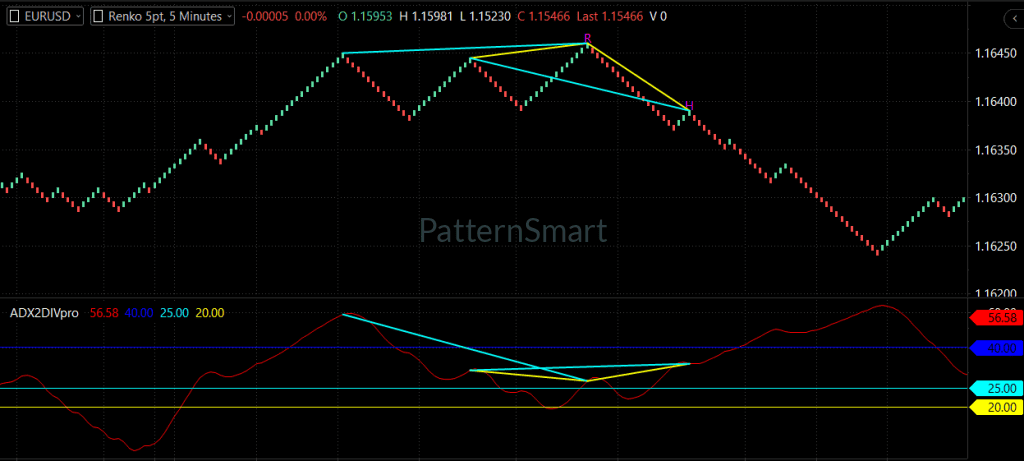
When ADX reaches a peak and begins declining while price continues in its current direction, it indicates that the current trend is losing underlying force. However, evaluating ADX behavior manually across fast-moving charts often leads to subjective interpretation and inconsistent analytical results.
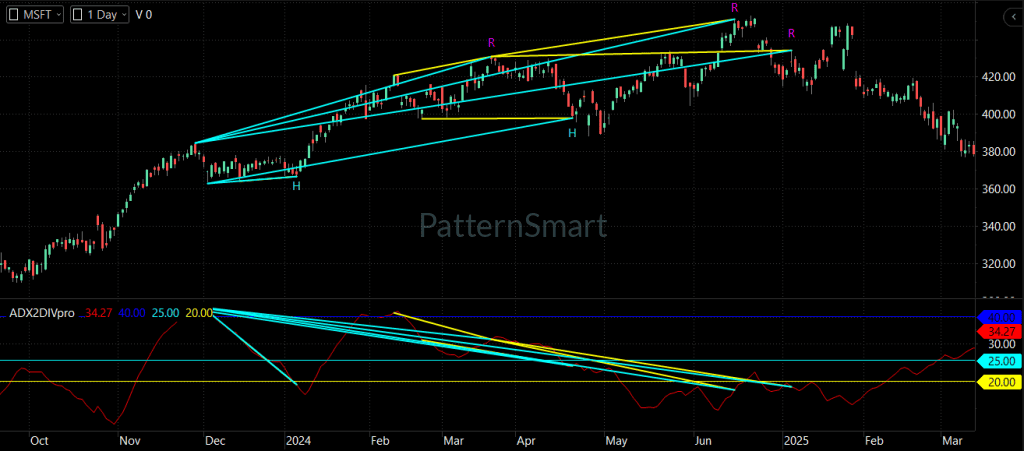
The Double Divergence Methodology: Confirmation Over Prediction
To overcome the ambiguity of traditional single-indicator observations, PatternSmart developed the Double Divergence methodology. This framework is built upon a fundamental analytical premise: divergence represents objective information regarding market conditions, not a guaranteed price prediction.
PatternSmart Double Divergence categorizes structural disagreement into two primary categories:
-
Bullish & Bearish Regular Divergence: Occurs when price forms a new extreme (a higher high or lower low) while the underlying ADX indicator fails to confirm that extreme. This signals a potential loss of trend quality and alerts traders to possible trend exhaustion.
-
Bullish & Bearish Hidden Divergence: Occurs when the indicator forms a new structural extreme while price does not, suggesting that the prevailing trend retains underlying structural support despite temporary pullbacks.
Rather than issuing immediate, unconfirmed signals, the PatternSmart methodology prioritizes multi-point confirmation. By systematically comparing price swings against indicator peaks over historical lookback windows, Double Divergence filters out minor market noise and isolates structurally valid setups.
Native Integration with MultiCharts .NET
MultiCharts .NET serves quantitative developers, strategy designers, and professional analysts who require high-performance charting and C# extensibility. Operating within an object-oriented, highly customizable framework, MultiCharts .NET demands indicators that offer computational efficiency and structural precision.
+-----------------------------------------------------------------------+
|                    MULTICHARTS .NET WORKFLOW MATRIX                   |
|                                                                       |
|  [Market Data Feed]  --->  [Double Divergence Engine]                 |
|                                   │                                   |
|                                   ▼                                   |
|               +-------------------+-------------------+               |
|               │                                       │               |
|               ▼                                       ▼               |
|   [Advanced Visual Render]              [Native Alerts / Signals]    |
|   - Custom Brush / Dash Styles          - Real-Time Audio / Popup     |
|   - Historical Signal Management        - Object-Oriented Integration |
+-----------------------------------------------------------------------+
The PatternSmart ADX Double Divergence Indicator integrates naturally into the MultiCharts .NET desktop workflow:
-
Object-Oriented Precision: Built natively to leverage the .NET framework, delivering fast calculation speeds during multi-timeframe and multi-asset charting sessions.
-
Structured Workspace Integration: Fits seamlessly into systematic analytical workflows, providing discretionary confirmation alongside rule-based trading models.
-
Visual Clarity: Renders explicit divergence lines and custom chart labels directly onto your workspace without lagging chart redraws.
Core Product Features
The PatternSmart ADX Double Divergence Indicator for MultiCharts .NET offers robust customization options. Every input parameter is categorized to provide full control over calculation behavior and display logic:
1. Signal Generation Features
-
Wait 1 Bar: When set to
True(default), the indicator requires one fully completed confirmation bar before finalizing a signal, significantly reducing premature confirmations during intra-bar volatility. -
Show Regular / Hidden Signals: Individual toggles (
Show Regular Bullish,Show Regular Bearish,Show Hidden Bullish,Show Hidden Bearish) allow analysts to isolate specific divergence categories aligned with their strategy.
2. Signal Filtering Features
-
Enhanced Mode: Applies an additional layer of geometric and structural validation to detected divergence anchor points, filtering out weaker, lower-quality technical setups.
3. Advanced Parameters
-
Divergence Bar Range: Sets the structural search scope (
ShortRange,MidRange,LongRange) to evaluate short-term momentum or broad historical trend structures. -
Divergence Lookback: Controls the historical bar count used to identify major swing points (default:
5). -
Filter Length: Controls internal smoothing periods during structural evaluation for consistent signal generation (default:
5).
4. Display & Visualization Features
-
Show Char & Show Line: Toggle visual text labels and direct peak-to-peak divergence trendlines on price charts.
-
Only Show Last Signal Within Bars: Controls chart clutter by automatically managing historical graphical objects within a specified bar radius (default:
10). -
Price Line Customization: Fully configurable
Price Line Brush,Price Line Dash Style, andPrice Line Widthto match custom MultiCharts .NET dark or light themes.
5. Alerts & Notifications
-
Enable Alert & Alert Sound: Trigger native audio notifications (
Alert1.wav) and visual popups the moment a signal satisfies all multi-bar confirmation requirements.
Practical Benefits for the Quantitative Trader
-
Eliminate Subjective Bias: Replace manual, eye-balled trendline drawing with systematic, multi-point mathematical detection.
-
Enhanced Risk Management: Identify deteriorating trend quality before a full price reversal breaks trailing stop levels.
-
Workflow Efficiency: Native alerts notify traders across multiple instruments, eliminating the need to monitor dozens of open charts manually.
-
Multi-Market Versatility: Apply the same consistent analytical methodology across Futures, Forex, Equities, and Crypto within MultiCharts .NET.
Looking for the complete mathematical breakdown, step-by-step optimization guides, and advanced trading strategies? Explore our comprehensive documentation:
Visit the Technical Inputs Manual: Double Divergence Pro for full parameter tuning.
Read the master guide on the Double Divergence Indicator Series.
Frequently Asked Questions
FAQ 1: Does the ADX Double Divergence indicator predict exact market reversal points?
No. In accordance with PatternSmart's methodology, divergence represents technical evidence of changing trend quality, not a deterministic price prediction. It indicates that trend conviction is weakening, which should be used alongside price action, support/resistance levels, and risk management rules.
FAQ 2: What is the difference between standard mode and Enhanced Mode?
Standard mode evaluates divergence using historical swing points and confirmation rules.
Enhanced Mode introduces a secondary layer of structural validation that evaluates geometric relationships between anchor points, filtering out lower-confidence signals and prioritizing higher-quality setups.FAQ 3: Can I run this indicator across multiple timeframes in MultiCharts .NET?
Yes. The indicator is fully compatible with intra-day, daily, and weekly chart intervals in MultiCharts .NET. Adjusting the
Divergence Bar Range and Divergence Lookback parameters allows you to align structural detection with your selected chart timeframe.Conclusion & Call to Action
Evaluating trend quality requires objective, confirmed technical data. By combining the trend-strength measurement of ADX with PatternSmart's multi-point Double Divergence framework, the PatternSmart ADX Double Divergence Indicator for MultiCharts .NET provides systematic and discretionary traders with a reliable tool for identifying trend exhaustion and structural shifts.
Write a review
Your Name:Your Review: Note: HTML is not translated!
Rating: Bad Good
Enter the code in the box below:


Latest

Welcome to Patternsmart
Converting your indicator from one platform to another.Custom Alert, Autotrader, Indicators, Scan, Screener, Strategy and Signals.
Copyright @ 2026 Patternsmart - All rights reserved
This website is for educational and informational
purposes only and should not be considered a solicitation to buy or sell a
futures contract or make any other type of investment decision. It's not recommended to use any single indicator as sole evaluation criteria. The companies
and services listed on this website are not to be considered a recommendation
and it is the reader's responsibility to evaluate any product, service, or
company. patternsmart is not responsible for the accuracy or content of any
product, service or company linked to on this website.
Futures trading
contains substantial risk and is not for every investor.Please read the following risk disclosure before considering the
trading of this product:
Futures Risk Disclosure. An investor could
potentially lose all or more than the initial investment. Risk capital is money
that can be lost without jeopardizing ones financial security or life style.
Only risk capital should be used for trading and only those with sufficient risk
capital should consider trading. Past performance is not necessarily indicative
of future results.
Trading stocks, options, futures and forex involves
speculation, and the risk of loss can be substantial.Investor must consider all
relevant risk factors, including their own personal financial situation, before
trading. Trading foreign exchange on margin carries a high level of risk, as
well as its own unique risk factors. Forex investments are subject to
counter-party risk, as there is no central clearing organization for these
transactions. Please read the following risk disclosure before considering the
trading of this product:
Forex Risk Disclosure. Spreads, Straddles, and other multiple-leg option
strategies can entail substantial transaction costs, including multiple
commissions, which may impact any potential return. Options are not suitable for
all investors as the special risks inherent to options trading may expose
investors to potentially rapid and substantial losses. Prior to trading options,
you should carefully read
Characteristics and Risks of Standardized Options.
patternsmart.com
will not be held liable for the loss of money or any damage caused from relying
on the information on this site. Any investment decision you make in your account is solely your responsibility.
TESTIMONIAL DISCLOSURE: TESTIMONIALS APPEARING ON OUR SITE MAY NOT BE REPRESENTATIVE OF THE EXPERIENCE OF OTHER CLIENTS OR CUSTOMERS AND IS NOT A GUARANTEE OF FUTURE PERFORMANCE OR SUCCESS.