
Your shopping cart is empty!
Shopping Cart
0 item(s) - FreeCustomization and Conversion for: Ctrader, MetaTrader(MT4, MT5), Thinkorswim, NinjaTrader, MultiCharts, Tradingview, Prorealtime, SierraChart, etc.
License renew price will be 20% off for the 2nd year and after.
Every Purchase Comes with a Coupon.
Share Your Experience. Help Other Traders Learn. Get Rewarded.
Share Your Experience. Help Other Traders Learn. Get Rewarded.
Featured





DMI Double Divergence Pro for MultiCharts x.NET


 (
(Understanding Trend Strength with the DMI Double Divergence Indicator for MultiCharts x.NET
Determining whether a market trend possesses true underlying strength or is beginning to lose momentum remains one of the most persistent challenges in technical analysis. While price action alone shows direction, it does not always reveal the quality or sustainability of that movement. Traders frequently observe prices reaching new highs or lows, only to find that directional conviction has already begun to deteriorate beneath the surface.
Evaluating directional movement requires tools that look beyond simple price tracking. By comparing market behavior with technical indicators designed to measure trend quality, technical analysts can gain clearer insight into market conviction. The DMI Double Divergence Indicator for MultiCharts x.NET provides a structured, confirmation-based approach to assessing trend strength, helping traders evaluate directional movement with greater analytical confidence.
The Analytical Role of the Directional Movement Index (DMI)
To understand how divergence analysis enhances market evaluation, it is essential first to understand what the Directional Movement Index (DMI) evaluates. Developed by J. Welles Wilder, the DMI system measures the presence and strength of directional movement by comparing the difference between consecutive highs and lows.
Unlike traditional momentum oscillators that primarily evaluate overbought or oversold conditions, DMI focuses explicitly on trend quality and directional conviction:
-
Directional Movement: Measures whether buying or selling pressure is dominating price expansion over a given period.
-
Trend Quality: Evaluates whether a trend is supported by consistent directional pressure or is merely drifting on lower participation.
-
Trend Confirmation: Helps filter out low-conviction price moves during sideways or choppy market conditions.
Because DMI evaluates directional pressure rather than pure price acceleration, it serves as an exceptional tool for trend-following strategies, breakout analysis, and structural market evaluation.
Why Double Divergence Matters in Trend Analysis
Under normal market conditions, price action and directional movement develop in alignment. When a market advances strongly, directional indicators typically rise to reflect robust buying pressure. Conversely, during sustained declines, directional pressure expands downward in agreement with falling prices.
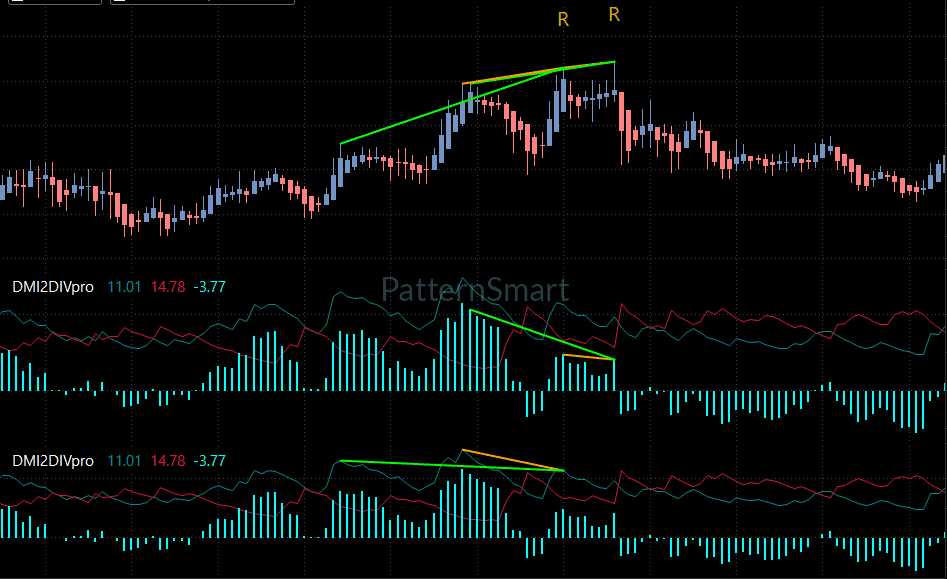
A divergence occurs when this expected relationship begins to break down—for instance, when price advances to a new extreme while the directional movement indicator fails to confirm that expansion.
Price Action:       [ Higher High ]  --->  Price continues advancing
                          vs
DMI Indicator:      [ Lower High  ]  --->  Directional pressure is weakening
Divergence represents an important analytical observation: underlying directional conviction is no longer fully supporting current price expansion.
Regular Divergence vs. Hidden Divergence
The PatternSmart Double Divergence methodology organizes divergence observations into two distinct structural categories:
-
Regular Divergence: Occurs when price forms a new extreme (a higher high or lower low) while the indicator fails to match that extreme. This observation suggests that directional strength may be deteriorating, signaling potential trend exhaustion or a developing transition phase.
-
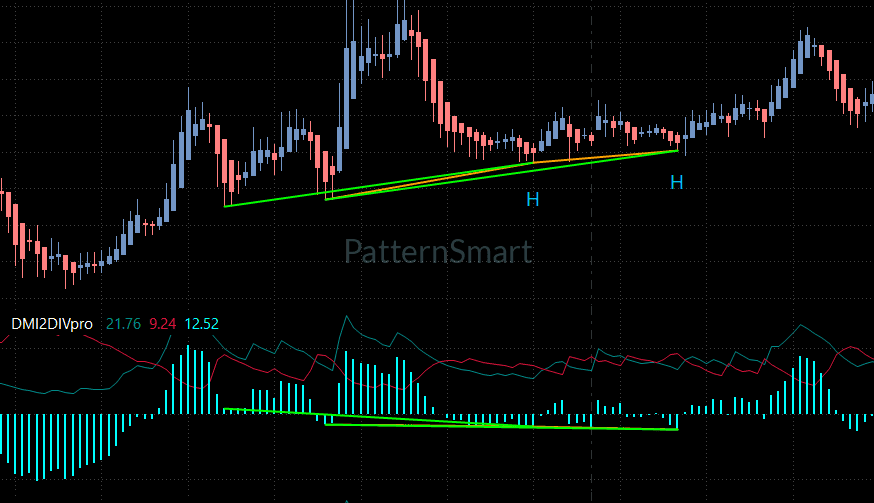
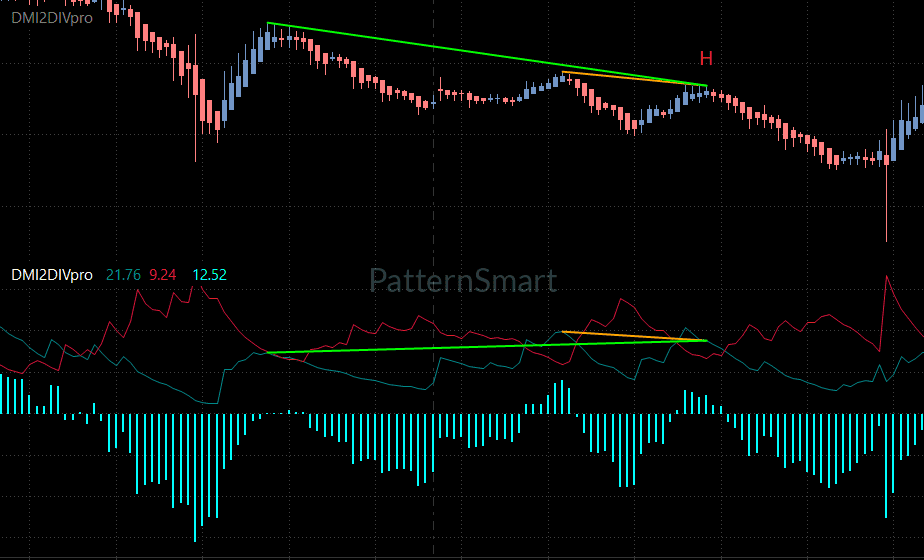
Hidden Divergence: Occurs when price forms a higher low during an uptrend (or a lower high during a downtrend) while the indicator establishes a lower extreme. This observation suggests that underlying trend structure remains intact despite a temporary price correction, providing valuable context for trend continuation analysis.
Rather than predicting guaranteed market reversals, Double Divergence treats these structural events as probabilistic evidence. By requiring structured confirmation across multiple historical anchor points, the methodology helps filter out ordinary market noise and strengthens analytical discipline.
Native Integration with MultiCharts x.NET
MultiCharts x.NET is a premier trading platform built for systematic analysis, strategy development, and high-performance charting. Designed for quantitative traders, C# developers, and professional analysts, MultiCharts x.NET provides a robust framework for multi-asset evaluation across futures, Forex, stocks, and commodities.
Applying the DMI Double Divergence methodology within MultiCharts x.NET brings several analytical workflow benefits:
-
Systematic Precision: Objectively identifies complex divergence structures without relying on manual visual line drawing.
-
Multi-Asset Versatility: Evaluates directional movement seamlessly across high-liquidity futures contracts, currency pairs, and equity indices.
-
Structured Charting: Displays clear, non-intrusive visual lines and markers directly on the chart, preserving a clean workspace for strategy execution.
The indicator integrates directly into the MultiCharts x.NET environment, delivering institutional-grade technical analysis while remaining fully accessible to traders building disciplined analytical workflows.
Essential Features for Signal Optimization
The DMI Double Divergence Indicator includes a suite of configurable features designed to refine signal confirmation and adapt to varying chart intervals.
Wait 1 Bar
The Wait 1 Bar feature adds a crucial confirmation stage to the signal generation process. When enabled (
True), the indicator waits for the current bar to close completely before finalizing a detected divergence signal. This simple rule prevents signal repaint during active bar formation, ensuring that technical observations are based strictly on completed market data.Enhanced Mode
Operating within the signal filtering layer, Enhanced Mode applies stricter geometric and structural validation criteria to historical anchor points. By filtering out weaker or less consistent divergence shapes, Enhanced Mode reduces lower-quality signals during noisy or range-bound market conditions, prioritizing structural precision.
Divergence Bar Range
The Divergence Bar Range parameter defines the historical search boundaries used when evaluating divergence anchor points. Options like
ShortRange, MidRange, and LongRange allow traders to adjust the structural distance between swing points, matching the calculation engine to short-term intraday swings or broader daily trends.Divergence Lookback & Filter Length
Working within the advanced calculation engine, Divergence Lookback controls the number of historical bars evaluated to identify local swing highs and lows, while Filter Length applies internal smoothing during structural evaluation. Together, these settings allow fine-tuning of indicator responsiveness relative to market volatility.
Practical Benefits for Disciplined Technical Analysis
Incorporating DMI Double Divergence into your technical analysis workflow provides several practical advantages:
-
Improved Trend Quality Assessment: Distinguishes between strong, conviction-led breakouts and weak price moves prone to failure.
-
Enhanced Confirmation: Strengthens trade planning by requiring price action and directional movement to satisfy structured divergence rules.
-
Streamlined Workflow: Reduces chart clutter and manual charting effort by automatically identifying valid regular and hidden divergence patterns.
-
Probability-Based Perspective: Replaces speculative predictions with objective observations, encouraging disciplined risk management and market evaluation.
Looking for the complete mathematical breakdown, step-by-step optimization guides, and advanced trading strategies? Explore our comprehensive documentation:
Visit the Technical Inputs Manual: Double Divergence Pro for full parameter tuning.
Read the master guide on the Double Divergence Indicator Series.
Frequently Asked Questions
Does DMI Double Divergence predict market reversals?
No. Technical indicators evaluate historical and present market data; they do not predict the future. DMI Double Divergence identifies structural disagreements between price action and directional movement, providing probabilistic evidence that trend quality may be changing.
What is the primary difference between DMI and RSI divergence?
RSI measures the speed and magnitude of price changes (momentum), making it popular for identifying overbought or oversold extremes. DMI measures directional movement and trend quality, making it ideal for trend-following, breakout evaluation, and assessing directional conviction.
Can I use this indicator on intraday futures charts in MultiCharts x.NET?
Yes. The indicator functions across all chart intervals supported by MultiCharts x.NET, including tick, volume, minute, daily, and weekly charts.
How does "Wait 1 Bar" improve analytical quality?
By waiting for the bar to close before confirming a signal, "Wait 1 Bar" eliminates real-time repainting caused by intra-bar price fluctuations, resulting in stable, reliable historical and real-time chart analysis.
Conclusion
Evaluating market trends requires more than monitoring price direction—it requires assessing the underlying conviction supporting that movement. The DMI Double Divergence Indicator for MultiCharts x.NET combines the directional insights of Wilder's DMI with PatternSmart’s confirmation-first methodology, offering technical analysts a structured, objective tool for evaluating trend health.
By focusing on probability, structural validation, and educational clarity, this indicator empowers traders to make more informed, disciplined market evaluations.
Write a review
Your Name:Your Review: Note: HTML is not translated!
Rating: Bad Good
Enter the code in the box below:


Latest

Welcome to Patternsmart
Converting your indicator from one platform to another.Custom Alert, Autotrader, Indicators, Scan, Screener, Strategy and Signals.
Copyright @ 2026 Patternsmart - All rights reserved
This website is for educational and informational
purposes only and should not be considered a solicitation to buy or sell a
futures contract or make any other type of investment decision. It's not recommended to use any single indicator as sole evaluation criteria. The companies
and services listed on this website are not to be considered a recommendation
and it is the reader's responsibility to evaluate any product, service, or
company. patternsmart is not responsible for the accuracy or content of any
product, service or company linked to on this website.
Futures trading
contains substantial risk and is not for every investor.Please read the following risk disclosure before considering the
trading of this product:
Futures Risk Disclosure. An investor could
potentially lose all or more than the initial investment. Risk capital is money
that can be lost without jeopardizing ones financial security or life style.
Only risk capital should be used for trading and only those with sufficient risk
capital should consider trading. Past performance is not necessarily indicative
of future results.
Trading stocks, options, futures and forex involves
speculation, and the risk of loss can be substantial.Investor must consider all
relevant risk factors, including their own personal financial situation, before
trading. Trading foreign exchange on margin carries a high level of risk, as
well as its own unique risk factors. Forex investments are subject to
counter-party risk, as there is no central clearing organization for these
transactions. Please read the following risk disclosure before considering the
trading of this product:
Forex Risk Disclosure. Spreads, Straddles, and other multiple-leg option
strategies can entail substantial transaction costs, including multiple
commissions, which may impact any potential return. Options are not suitable for
all investors as the special risks inherent to options trading may expose
investors to potentially rapid and substantial losses. Prior to trading options,
you should carefully read
Characteristics and Risks of Standardized Options.
patternsmart.com
will not be held liable for the loss of money or any damage caused from relying
on the information on this site. Any investment decision you make in your account is solely your responsibility.
TESTIMONIAL DISCLOSURE: TESTIMONIALS APPEARING ON OUR SITE MAY NOT BE REPRESENTATIVE OF THE EXPERIENCE OF OTHER CLIENTS OR CUSTOMERS AND IS NOT A GUARANTEE OF FUTURE PERFORMANCE OR SUCCESS.