
Your shopping cart is empty!
Shopping Cart
0 item(s) - FreeCustomization and Conversion for: Ctrader, MetaTrader(MT4, MT5), Thinkorswim, NinjaTrader, MultiCharts, Tradingview, Prorealtime, SierraChart, etc.
License renew price will be 20% off for the 2nd year and after.
Every Purchase Comes with a Coupon.
Share Your Experience. Help Other Traders Learn. Get Rewarded.
Share Your Experience. Help Other Traders Learn. Get Rewarded.
Featured




Rectangle Chart Pattern Indicator for MT4
 (
Automatically Discover Rectangle Consolidation and Breakout Opportunities on MetaTrader 4
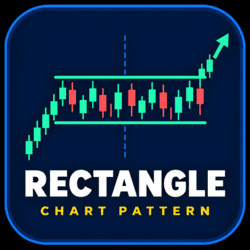
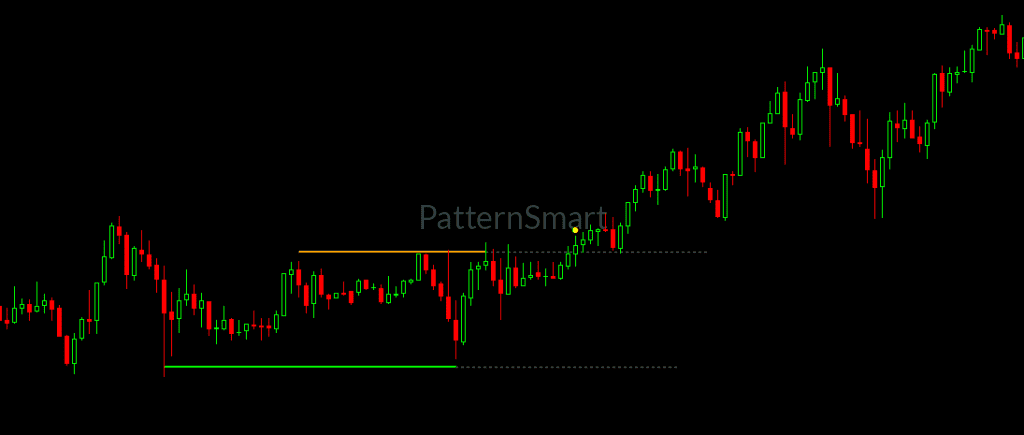
The Rectangle Chart Pattern Indicator for MT4 is a professional technical analysis tool that automatically identifies Rectangle chart formations and monitors potential breakout opportunities directly on MetaTrader 4 charts.
Rectangle patterns are among the most widely recognized market consolidation structures. They frequently develop when buyers and sellers temporarily reach equilibrium, causing price to trade within clearly defined support and resistance zones before eventually breaking out and establishing a new directional move.
Manually identifying rectangle formations across multiple charts and timeframes can be time-consuming and often subjective. This indicator streamlines the entire process by automatically detecting valid rectangle structures, drawing pattern boundaries, extending key levels, and monitoring potential bullish and bearish breakouts in real time.
Specifically developed for the MetaTrader 4 platform, this indicator provides MT4 traders with a powerful solution for identifying consolidation zones, preparing for breakout opportunities, and improving overall market analysis efficiency.
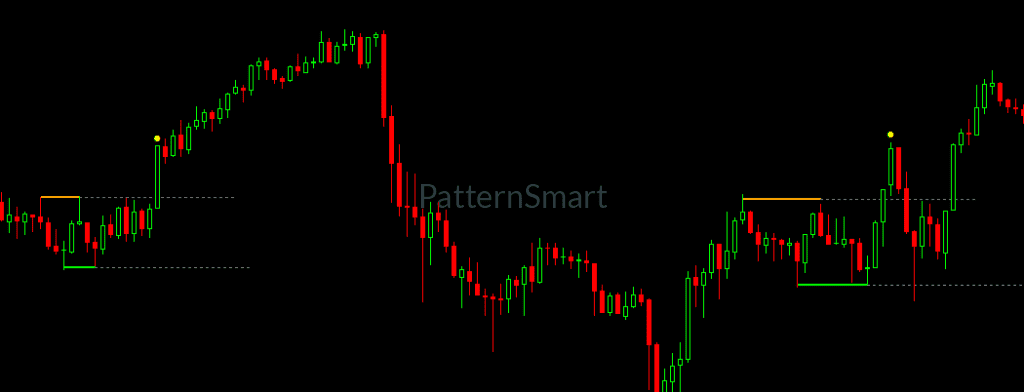
What Is a Rectangle Chart Pattern?
A Rectangle pattern forms when price repeatedly oscillates between horizontal support and resistance levels, creating a clearly defined trading range.
During this consolidation phase, neither bulls nor bears gain full control of the market. Price remains confined within the range until a breakout eventually occurs above resistance or below support.
Rectangle formations are commonly used by traders for:
- Breakout trading
- Range trading
- Trend continuation analysis
- Market consolidation identification
- Support and resistance analysis
- Volatility expansion preparation
The Rectangle Chart Pattern Indicator automatically locates these structures and displays them directly on your MT4 charts.
Key Features
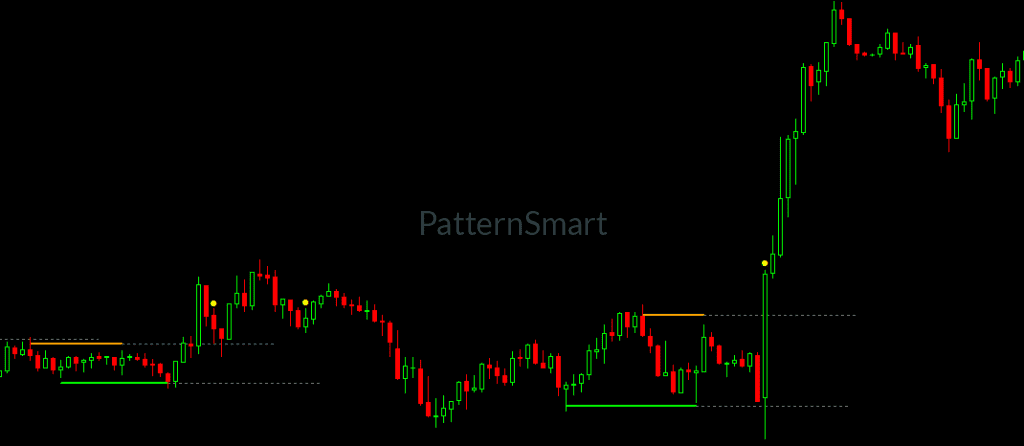
Automatic Rectangle Pattern Detection
The indicator continuously scans market data and identifies potential Rectangle formations without requiring manual chart analysis.
When a valid pattern is recognized, horizontal support and resistance boundaries are automatically plotted on the chart.
Benefits
- Faster analysis
- Reduced subjectivity
- Consistent pattern recognition
- Improved chart efficiency
- Enhanced trading workflow
Real-Time Pattern Monitoring
Markets are dynamic and constantly changing.
The indicator continuously evaluates price action as new bars form and updates pattern recognition accordingly.
This allows traders to remain informed about emerging opportunities without manually reviewing every chart.
Built-In Breakout Detection
One of the most valuable features of this MT4 implementation is its ability to monitor detected Rectangle formations for breakout activity.
Once a pattern is identified, the indicator continues tracking price behavior and notifies traders when price moves beyond important pattern boundaries.
Breakout Monitoring Includes
- Bullish breakout detection
- Bearish breakout detection
- Visual breakout markers
- Real-time breakout alerts
- Range expiration management
This helps traders react more quickly when consolidation periods transition into directional market moves.
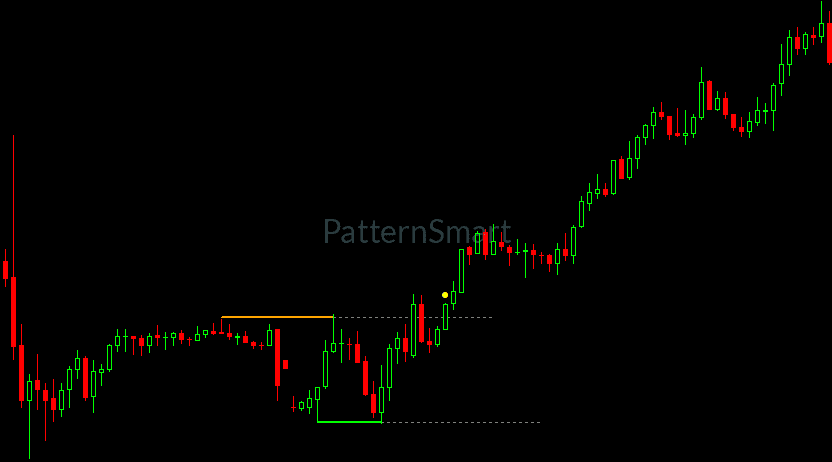
Multi-Size Rectangle Recognition
Not all consolidation structures appear in the same size.
To accommodate different trading styles, the indicator supports multiple pattern categories:
Small Rectangle Patterns
Ideal for:
- Scalpers
- Fast-moving markets
- Lower timeframe traders
Medium Rectangle Patterns
Suitable for:
- Day traders
- Intraday traders
- Intermediate price structures
Large Rectangle Patterns
Designed for:
- Swing traders
- Position traders
- Higher timeframe analysis
This flexibility allows traders to focus on the market structures most relevant to their strategies.
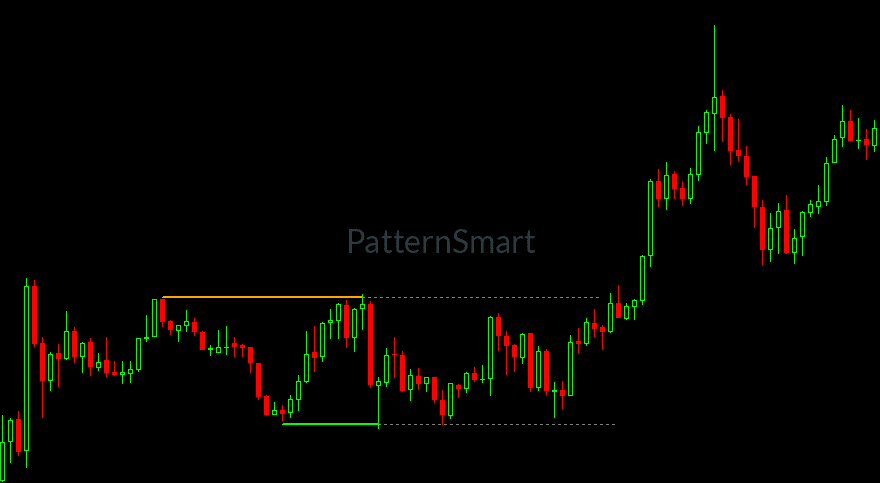
Automatic Pattern Drawing
Once a Rectangle pattern is detected, the indicator automatically draws professionally formatted support and resistance boundaries on the chart.
Features include:
- Horizontal resistance lines
- Horizontal support lines
- Extended projection zones
- Breakout tracking levels
- Dynamic chart visualization
This significantly reduces chart preparation time and makes pattern recognition much more efficient.
Extension Line Projections
The indicator can project pattern boundaries into future bars, allowing traders to visualize critical market levels beyond the completed formation.
Extension lines help traders:
- Monitor breakout zones
- Anticipate future price interaction
- Maintain awareness of significant support and resistance areas
- Improve trade planning
Real-Time Alert System
Market opportunities can develop at any moment.
The indicator includes a fully integrated alert system to notify traders when important events occur.
Pattern Formation Alerts
Receive notifications when a new Rectangle structure is identified.
Breakout Alerts
Receive immediate notifications when price breaks above resistance or below support.
Alert capabilities include:
- Sound notifications
- Chart updates
- Real-time monitoring
- Automated market scanning
This makes the indicator highly valuable for traders who monitor multiple markets simultaneously.
MT4-Specific Advantages
Built Exclusively for MetaTrader 4
This version is specifically designed for the MetaTrader 4 trading platform rather than being a generic adaptation from another environment.
The indicator integrates seamlessly with MT4's chart system and takes full advantage of native platform functionality.
Optimized for MT4 Performance
Many traders operate numerous charts simultaneously.
The Rectangle Chart Pattern Indicator is optimized for efficient operation while maintaining responsive platform performance.
Ideal for traders running:
- Multiple currency pairs
- Several indicators
- Multi-timeframe analysis
- Automated trading systems
- Large chart workspaces
Native MT4 Chart Object Rendering
All pattern structures are rendered directly onto MetaTrader 4 charts using native graphical objects.
Benefits include:
- Precise chart alignment
- Smooth zoom behavior
- Accurate scaling
- Professional appearance
- Consistent chart interaction
Fully Customizable Appearance
Every trader has unique chart preferences.
The indicator provides extensive customization options including:
Pattern Colors
- Upper resistance color
- Lower support color
- Extension line color
Display Controls
- Pattern size selection
- Extension length adjustment
- Alert management
- Last pattern display mode
Visual Configuration
- Line width customization
- Pattern projection settings
- Chart organization improvements
Last Pattern Only Mode
For traders who prefer uncluttered charts, the indicator includes a Last Pattern Only display mode.
This feature automatically removes older pattern drawings and displays only the most recent Rectangle formation.
Benefits include:
- Cleaner charts
- Improved focus
- Easier decision making
- Better visual organization
Compatible with All MT4 Timeframes
The Rectangle Chart Pattern Indicator can be used on any MetaTrader 4 timeframe including:
- M1
- M5
- M15
- M30
- H1
- H4
- Daily
- Weekly
- Monthly
This flexibility allows traders to apply rectangle analysis to virtually any trading methodology.
Works Across Multiple Markets
The indicator can be applied to nearly all instruments supported by MetaTrader 4 brokers.
Forex Markets
- Major currency pairs
- Minor currency pairs
- Exotic currencies
Commodities
- Gold
- Silver
- Crude Oil
- Natural Gas
Indices
- US indices
- European indices
- Global indices
Cryptocurrency CFDs
- Bitcoin
- Ethereum
- Other supported assets
Stock CFDs
- Individual equities offered through MT4 brokers
Trading Applications
The Rectangle Chart Pattern Indicator supports numerous trading approaches.
Breakout Trading
Identify established consolidation ranges and monitor potential breakout opportunities.
Range Trading
Use clearly defined support and resistance boundaries when trading inside consolidation zones.
Trend Continuation Analysis
Monitor rectangle formations that may act as continuation structures during larger trends.
Market Structure Analysis
Quickly identify periods of accumulation, consolidation, or distribution.
Multi-Timeframe Trading
Combine higher timeframe rectangle patterns with lower timeframe entry techniques.
Why Choose the Rectangle Chart Pattern Indicator for MT4?
Manual identification of Rectangle formations can be inconsistent, time-consuming, and prone to human error.
The Rectangle Chart Pattern Indicator helps eliminate those challenges by providing automated pattern recognition, visual pattern rendering, breakout monitoring, and real-time alerts directly within MetaTrader 4.
Key Advantages
✓ Automatic Rectangle pattern detection
✓ Real-time breakout monitoring
✓ Bullish breakout alerts
✓ Bearish breakout alerts
✓ Multi-size pattern recognition
✓ Visual support and resistance plotting
✓ Extension line projections
✓ Fully customizable appearance
✓ Compatible with all MT4 timeframes
✓ Suitable for Forex, commodities, indices, and cryptocurrencies
✓ Optimized MT4 performance
✓ Easy installation and operation
✓ No manual pattern drawing required
Who Is This Indicator For?
The Rectangle Chart Pattern Indicator is suitable for:
Forex Traders
Identify consolidation and breakout opportunities across major and minor currency pairs.
Day Traders
Monitor intraday ranges and prepare for breakout scenarios.
Swing Traders
Recognize larger consolidation structures that may lead to substantial directional moves.
Technical Analysts
Improve chart analysis efficiency with automated pattern identification.
Multi-Asset Traders
Apply the indicator across numerous markets from a single MT4 platform.
Delivery Information
What You Will Receive
Upon purchase, you will receive:
Included
- Compiled MT4 Indicator (.EX4)
- Automatic Rectangle Pattern Detection
- Built-In Breakout Monitoring
- Pattern Alert System
- Customizable Chart Settings
Not Included
- Source Code (.MQ4)
- Editable Development Files
- Programming Documentation
- Underlying Detection Logic
The product is delivered as a fully compiled .EX4 file for MetaTrader 4, allowing immediate installation and use while protecting proprietary intellectual property.
Professional Rectangle Pattern Detection for MT4 Traders
The Rectangle Chart Pattern Indicator for MT4 provides an efficient and reliable way to identify consolidation structures and potential breakout opportunities without manual chart analysis. Combining automated pattern recognition, breakout monitoring, extension projections, customizable alerts, and deep MetaTrader 4 integration, this indicator helps traders analyze markets faster, maintain chart clarity, and focus on high-quality trading opportunities with greater confidence.
Write a review
Your Name:Your Review: Note: HTML is not translated!
Rating: Bad Good
Enter the code in the box below:


-80x80.png)


Latest




Welcome to Patternsmart
Converting your indicator from one platform to another.Custom Alert, Autotrader, Indicators, Scan, Screener, Strategy and Signals.
Copyright @ 2026 Patternsmart - All rights reserved
This website is for educational and informational
purposes only and should not be considered a solicitation to buy or sell a
futures contract or make any other type of investment decision. It's not recommended to use any single indicator as sole evaluation criteria. The companies
and services listed on this website are not to be considered a recommendation
and it is the reader's responsibility to evaluate any product, service, or
company. patternsmart is not responsible for the accuracy or content of any
product, service or company linked to on this website.
Futures trading
contains substantial risk and is not for every investor.Please read the following risk disclosure before considering the
trading of this product:
Futures Risk Disclosure. An investor could
potentially lose all or more than the initial investment. Risk capital is money
that can be lost without jeopardizing ones financial security or life style.
Only risk capital should be used for trading and only those with sufficient risk
capital should consider trading. Past performance is not necessarily indicative
of future results.
Trading stocks, options, futures and forex involves
speculation, and the risk of loss can be substantial.Investor must consider all
relevant risk factors, including their own personal financial situation, before
trading. Trading foreign exchange on margin carries a high level of risk, as
well as its own unique risk factors. Forex investments are subject to
counter-party risk, as there is no central clearing organization for these
transactions. Please read the following risk disclosure before considering the
trading of this product:
Forex Risk Disclosure. Spreads, Straddles, and other multiple-leg option
strategies can entail substantial transaction costs, including multiple
commissions, which may impact any potential return. Options are not suitable for
all investors as the special risks inherent to options trading may expose
investors to potentially rapid and substantial losses. Prior to trading options,
you should carefully read
Characteristics and Risks of Standardized Options.
patternsmart.com
will not be held liable for the loss of money or any damage caused from relying
on the information on this site. Any investment decision you make in your account is solely your responsibility.
TESTIMONIAL DISCLOSURE: TESTIMONIALS APPEARING ON OUR SITE MAY NOT BE REPRESENTATIVE OF THE EXPERIENCE OF OTHER CLIENTS OR CUSTOMERS AND IS NOT A GUARANTEE OF FUTURE PERFORMANCE OR SUCCESS.