
Your shopping cart is empty!
Shopping Cart
0 item(s) - FreeCustomization and Conversion for: Ctrader, MetaTrader(MT4, MT5), Thinkorswim, NinjaTrader, MultiCharts, Tradingview, Prorealtime, SierraChart, etc.
License renew price will be 20% off for the 2nd year and after.
Every Purchase Comes with a Coupon.
Share Your Experience. Help Other Traders Learn. Get Rewarded.
Share Your Experience. Help Other Traders Learn. Get Rewarded.
Featured





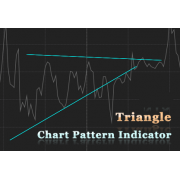
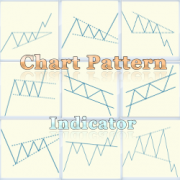
Triangle Chart Pattern Indicator for MT4

 (
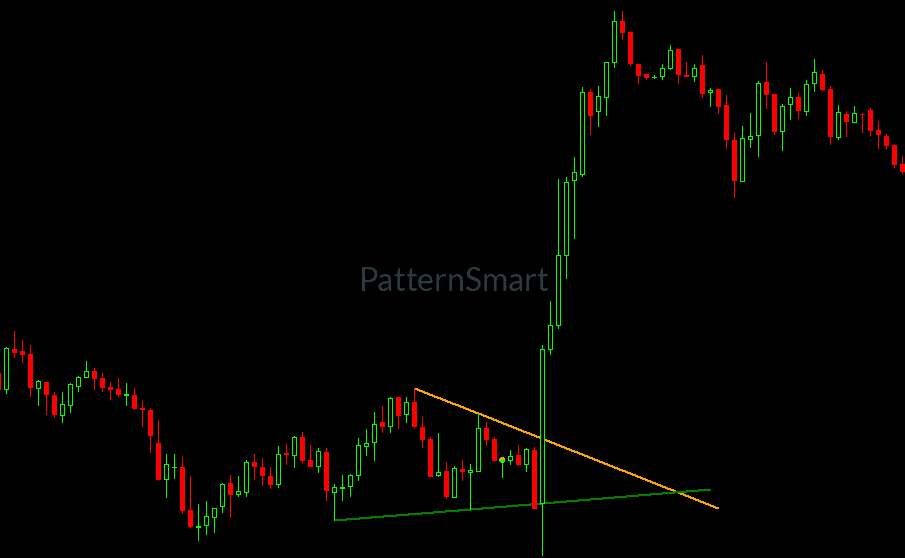
Automatically Identify Triangle Patterns on MetaTrader 4
Take the guesswork out of chart analysis with the Triangle Chart Pattern Indicator for MT4. Designed for traders who rely on technical analysis and price action, this powerful indicator automatically scans the market and highlights potential triangle formations directly on your charts.
Instead of manually searching through countless candles and timeframes, the indicator helps you quickly spot high-probability market structures, allowing you to focus on decision-making rather than pattern hunting.
Whether you are a day trader, swing trader, or long-term investor, the Triangle Chart Pattern Indicator for MT4 provides a clear visual representation of important consolidation zones that often precede significant market movements.
Supported Triangle Pattern Types
The indicator automatically detects multiple triangle formations commonly used by professional traders:
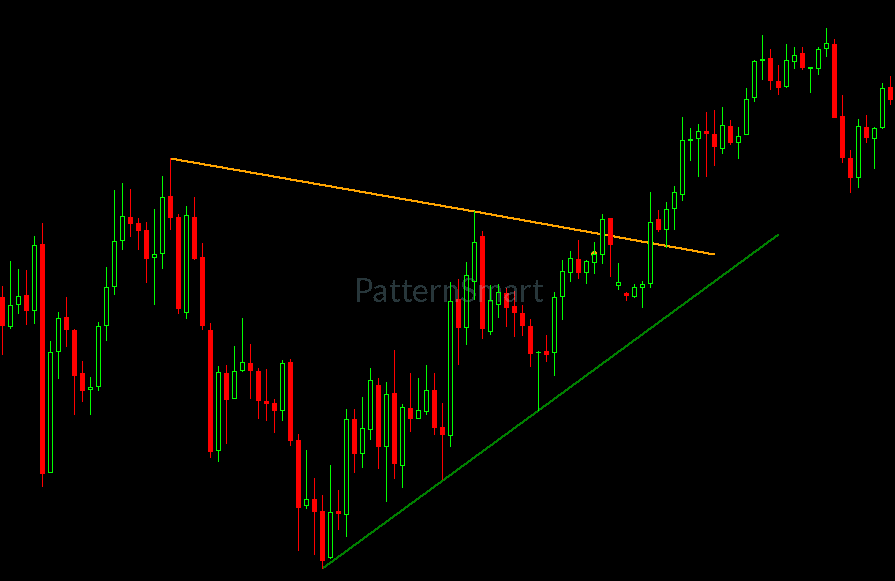
Ascending Triangle
An ascending triangle typically forms when buyers continue pushing price higher while resistance remains relatively stable. This pattern is widely monitored for potential bullish breakout opportunities.
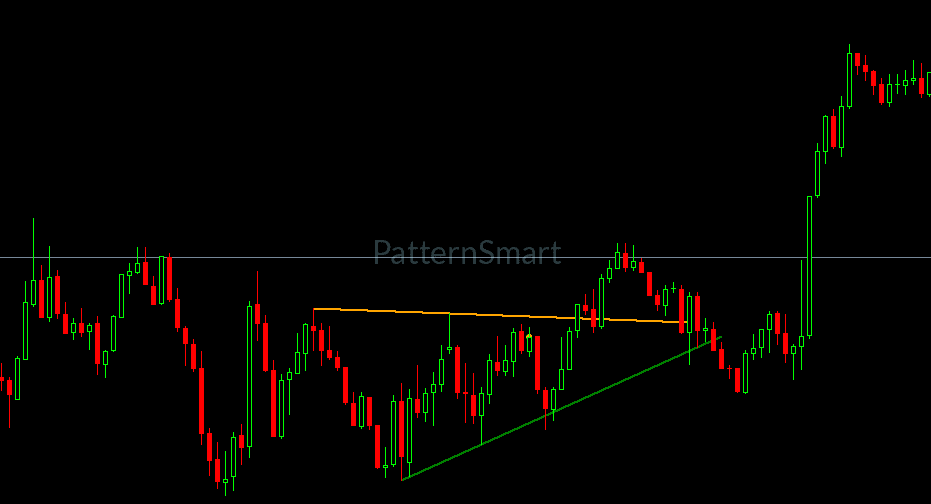
Descending Triangle
A descending triangle develops when sellers gain strength while support levels remain relatively unchanged. Many traders use this structure to monitor potential bearish continuation scenarios.
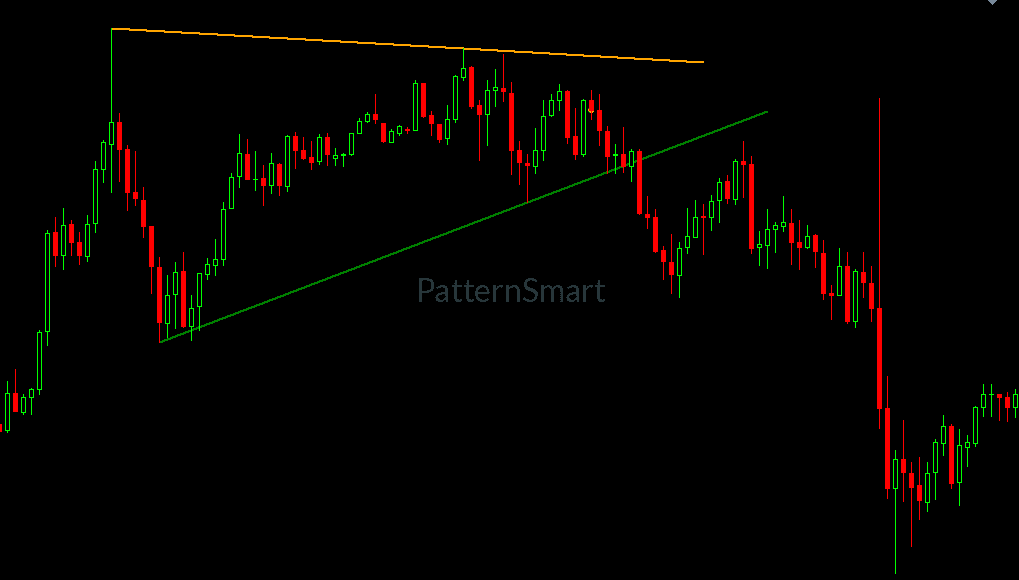
Symmetrical Triangle
A symmetrical triangle occurs when both buyers and sellers converge into a tighter trading range. This pattern may precede strong directional moves depending on breakout behavior.
With support for multiple triangle variations, traders can identify a broader range of market opportunities across different conditions and instruments.
Key Features
Fully Automated Detection
The indicator continuously scans the chart and identifies valid triangle formations automatically. No manual drawing or pattern analysis is required.
Real-Time Market Monitoring
Patterns are detected as new market data becomes available, helping traders stay informed about emerging market structures.
Multiple Pattern Sizes
Traders can choose to detect:
- Small triangle formations
- Medium triangle formations
- Large triangle formations
This flexibility allows the indicator to adapt to different trading styles and chart timeframes.
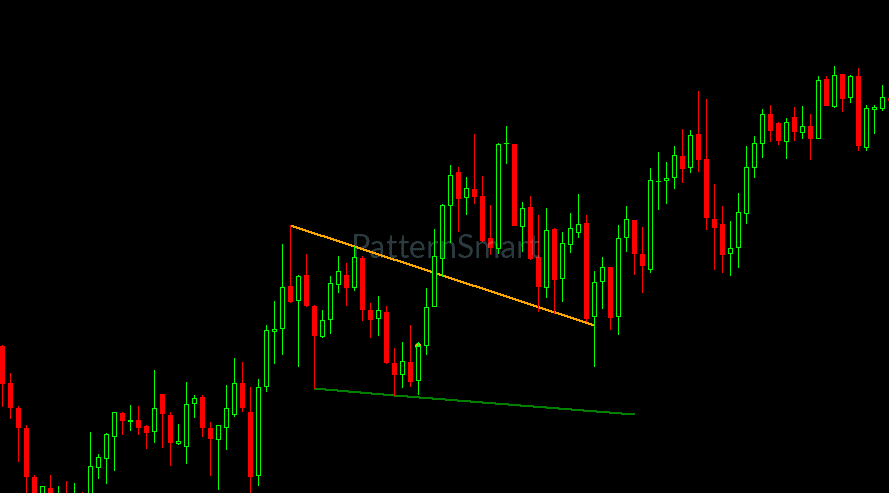
Visual Trendline Drawing
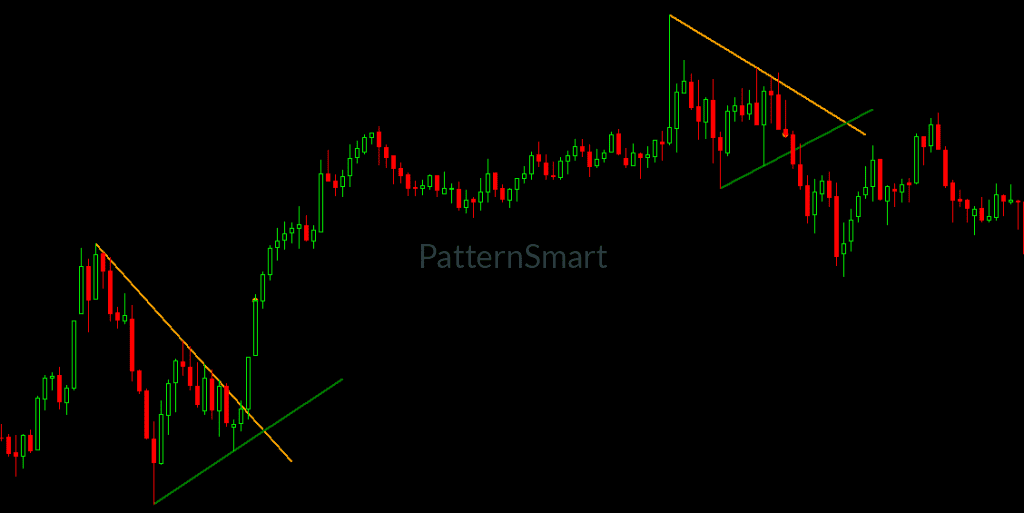
Once a valid triangle pattern is found, the indicator automatically draws upper and lower boundary lines directly on the chart, making pattern recognition simple and intuitive.
Pattern Extension Projection
Optional extension lines can project the triangle structure beyond the current market area, helping traders visualize potential breakout zones and future price interaction areas.
Instant Trading Alerts
Receive notifications whenever a new triangle pattern appears.
Alert options include:
- Platform alerts
- Sound notifications
- Real-time monitoring
This helps eliminate the need to continuously watch charts throughout the trading session.
Adjustable Display Settings
Customize the indicator to match your personal trading preferences.
Available customization options include:
- Triangle type selection
- Pattern size filters
- Line colors
- Line thickness
- Alert settings
- Extension length settings
Benefits of Using the Triangle Chart Pattern Indicator
Save Analysis Time
Manually identifying triangle formations can be time-consuming and subjective. Automated detection significantly reduces analysis workload.
Improve Chart Clarity
Clean visual markings help traders focus on important market structures without cluttering the chart.
Enhance Trading Efficiency
Quickly identify consolidation areas and monitor potential breakout opportunities across multiple instruments.
Eliminate Emotional Bias
Automated pattern recognition applies consistent detection rules across all charts and timeframes.
Suitable for All Experience Levels
Whether you are new to technical analysis or an experienced trader, the indicator simplifies the identification of one of the market's most respected chart patterns.
Compatible Trading Instruments
The Triangle Chart Pattern Indicator can be used on virtually any market available on MetaTrader 4, including:
- Forex pairs
- Stock CFDs
- Indices
- Commodities
- Metals
- Cryptocurrencies
- Futures CFDs
Compatible Timeframes
The indicator works on all MT4 timeframes, including:
- M1
- M5
- M15
- M30
- H1
- H4
- Daily
- Weekly
- Monthly
Traders can use the indicator for both short-term and long-term market analysis.
Ideal For
This indicator is suitable for:
- Forex traders
- Price action traders
- Swing traders
- Day traders
- Breakout traders
- Technical analysts
- Multi-timeframe traders
Why Choose This Triangle Pattern Indicator?
Many traders miss trading opportunities because manually recognizing patterns requires constant chart observation and experience. This indicator performs the scanning process automatically and highlights potential triangle formations as they develop.
The result is a more efficient workflow, faster market analysis, and improved consistency when evaluating chart structures.
By combining automated pattern recognition, customizable alerts, multiple triangle classifications, and professional chart visualization, the Triangle Chart Pattern Indicator for MT4 becomes a valuable addition to any technical trader's toolkit.
Product Delivery
Important: This product is delivered as a compiled .ex4 file only.
You will receive:
- Triangle Chart Pattern Indicator for MT4 (.ex4)
- Ready-to-install file
- No source code included
The MQ4 source code is not included with this purchase.
Installation
- Open MetaTrader 4.
- Navigate to File → Open Data Folder.
- Copy the provided .ex4 file into the Indicators folder.
- Restart MT4 or refresh the Navigator window.
- Attach the indicator to any chart.
- Configure settings as desired.
Write a review
Your Name:Your Review: Note: HTML is not translated!
Rating: Bad Good
Enter the code in the box below:


-80x80.png)


Latest

Welcome to Patternsmart
Converting your indicator from one platform to another.Custom Alert, Autotrader, Indicators, Scan, Screener, Strategy and Signals.
Copyright @ 2026 Patternsmart - All rights reserved
This website is for educational and informational
purposes only and should not be considered a solicitation to buy or sell a
futures contract or make any other type of investment decision. It's not recommended to use any single indicator as sole evaluation criteria. The companies
and services listed on this website are not to be considered a recommendation
and it is the reader's responsibility to evaluate any product, service, or
company. patternsmart is not responsible for the accuracy or content of any
product, service or company linked to on this website.
Futures trading
contains substantial risk and is not for every investor.Please read the following risk disclosure before considering the
trading of this product:
Futures Risk Disclosure. An investor could
potentially lose all or more than the initial investment. Risk capital is money
that can be lost without jeopardizing ones financial security or life style.
Only risk capital should be used for trading and only those with sufficient risk
capital should consider trading. Past performance is not necessarily indicative
of future results.
Trading stocks, options, futures and forex involves
speculation, and the risk of loss can be substantial.Investor must consider all
relevant risk factors, including their own personal financial situation, before
trading. Trading foreign exchange on margin carries a high level of risk, as
well as its own unique risk factors. Forex investments are subject to
counter-party risk, as there is no central clearing organization for these
transactions. Please read the following risk disclosure before considering the
trading of this product:
Forex Risk Disclosure. Spreads, Straddles, and other multiple-leg option
strategies can entail substantial transaction costs, including multiple
commissions, which may impact any potential return. Options are not suitable for
all investors as the special risks inherent to options trading may expose
investors to potentially rapid and substantial losses. Prior to trading options,
you should carefully read
Characteristics and Risks of Standardized Options.
patternsmart.com
will not be held liable for the loss of money or any damage caused from relying
on the information on this site. Any investment decision you make in your account is solely your responsibility.
TESTIMONIAL DISCLOSURE: TESTIMONIALS APPEARING ON OUR SITE MAY NOT BE REPRESENTATIVE OF THE EXPERIENCE OF OTHER CLIENTS OR CUSTOMERS AND IS NOT A GUARANTEE OF FUTURE PERFORMANCE OR SUCCESS.