
Your shopping cart is empty!
Shopping Cart
0 item(s) - FreeCustomization and Conversion for: Ctrader, MetaTrader(MT4, MT5), Thinkorswim, NinjaTrader, MultiCharts, Tradingview, Prorealtime, SierraChart, etc.
License renew price will be 20% off for the 2nd year and after.
Every Purchase Comes with a Coupon.
Share Your Experience. Help Other Traders Learn. Get Rewarded.
Share Your Experience. Help Other Traders Learn. Get Rewarded.
Featured
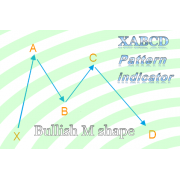
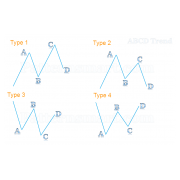
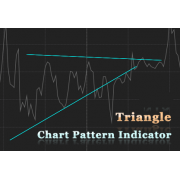



Double Bottom Chart Pattern Indicator for Sierra Chart

 (
Automatically Identify High-Probability Double Bottom Reversal Patterns in Sierra Chart
The Double Bottom Chart Pattern Indicator for Sierra Chart is a professional pattern recognition solution that automatically detects Double Bottom formations directly on Sierra Chart charts. Designed specifically for traders who rely on technical analysis and price action trading, this indicator helps identify potential bullish reversal opportunities without the need for manual chart scanning.
Double Bottom patterns are among the most widely recognized reversal formations in technical analysis. Finding these setups consistently across multiple instruments and timeframes can be time-consuming, especially for active traders monitoring numerous markets simultaneously. This indicator automates the entire pattern recognition process, allowing traders to focus on market analysis and trade execution rather than manually searching for chart patterns.
Built exclusively for Sierra Chart, the indicator integrates directly into the platform's professional charting environment, providing real-time pattern detection, customizable visual displays, and efficient chart analysis capabilities.
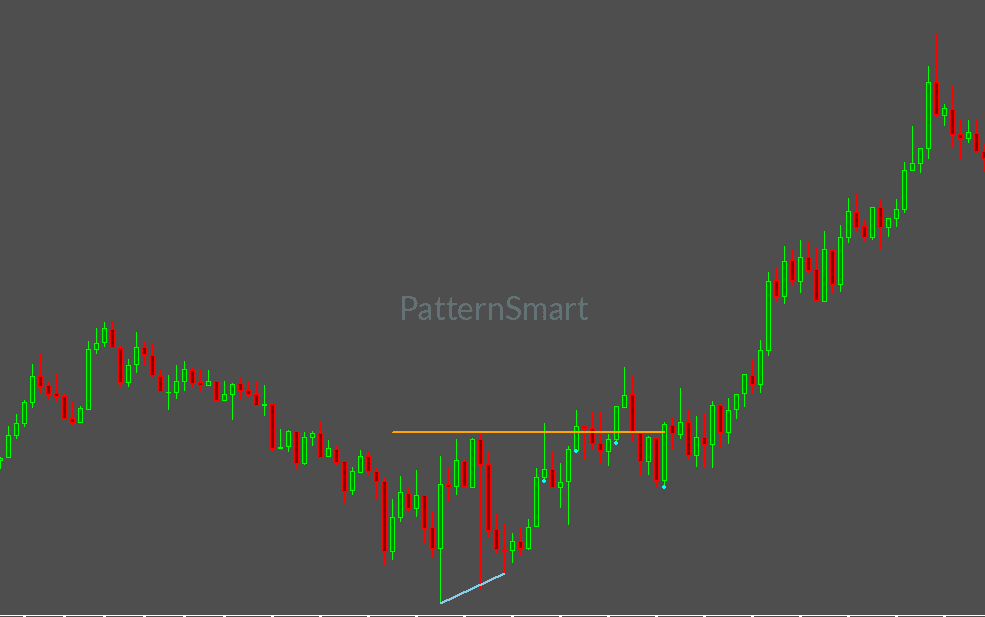
What Is a Double Bottom Pattern?
A Double Bottom is a bullish chart pattern that forms when price creates two distinct lows separated by an intermediate price retracement. The formation often reflects a market attempting to establish support after a prior decline.
Technical traders frequently monitor Double Bottom structures because they can indicate:
- Potential trend reversals
- Strengthening buying pressure
- Important support zones
- Changes in market sentiment
- Potential breakout opportunities
Because every market contains countless price swings, manually identifying quality Double Bottom formations can be subjective and inconsistent. The Double Bottom Pattern Indicator simplifies this process by automatically detecting qualifying structures and displaying them directly on the chart.
Built Specifically for Sierra Chart
Designed for Professional Traders
Sierra Chart is widely recognized for its powerful charting infrastructure, advanced customization capabilities, efficient data handling, and low-latency performance.
This Double Bottom Indicator has been developed specifically for the Sierra Chart environment, allowing traders to benefit from:
- Native chart integration
- Fast chart rendering
- Efficient real-time analysis
- Professional visual presentation
- Seamless compatibility with other studies
- Reliable operation during volatile market conditions
Rather than functioning as a generic scanner adapted from another platform, this version is designed to complement the workflow and expectations of Sierra Chart users.
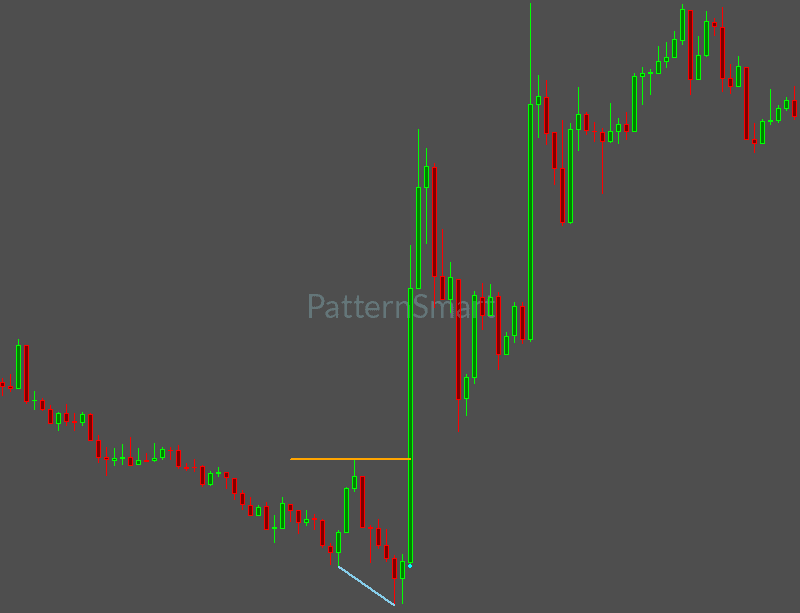
Native Sierra Chart Experience
All detected Double Bottom patterns are displayed directly within the charting workspace.
This provides traders with:
- Immediate visual confirmation
- Faster market evaluation
- Improved workflow efficiency
- Better chart organization
- Enhanced pattern visibility
The indicator becomes a natural extension of Sierra Chart's charting capabilities, reducing the need for external scanning tools or manual trend analysis.
Key Features
Automatic Double Bottom Detection
The indicator continuously analyzes chart data and automatically locates qualifying Double Bottom formations as they develop.
Instead of manually drawing support zones or reviewing historical price action bar by bar, traders can rely on automated pattern identification to bring potential trading opportunities to their attention.
Benefits include:
- Reduced chart analysis time
- Improved pattern discovery
- Consistent identification criteria
- Increased scanning efficiency
- Greater market coverage
Real-Time Market Scanning
Markets are constantly changing, and new opportunities can emerge quickly.
The Double Bottom Indicator scans incoming market data in real time, helping traders identify developing reversal structures as soon as they become available.
Advantages include:
- Continuous pattern monitoring
- Faster opportunity recognition
- Improved situational awareness
- Enhanced decision-making support
Multiple Timeframe Analysis
The indicator can be applied to a wide variety of chart intervals, making it suitable for traders with different styles and objectives.
Common applications include:
Scalping
Identify short-term reversal opportunities on lower timeframes.
Day Trading
Track intraday market structure and emerging bullish reversals.
Swing Trading
Locate larger Double Bottom formations with greater strategic significance.
Position Trading
Monitor major long-term support formations across higher timeframe charts.
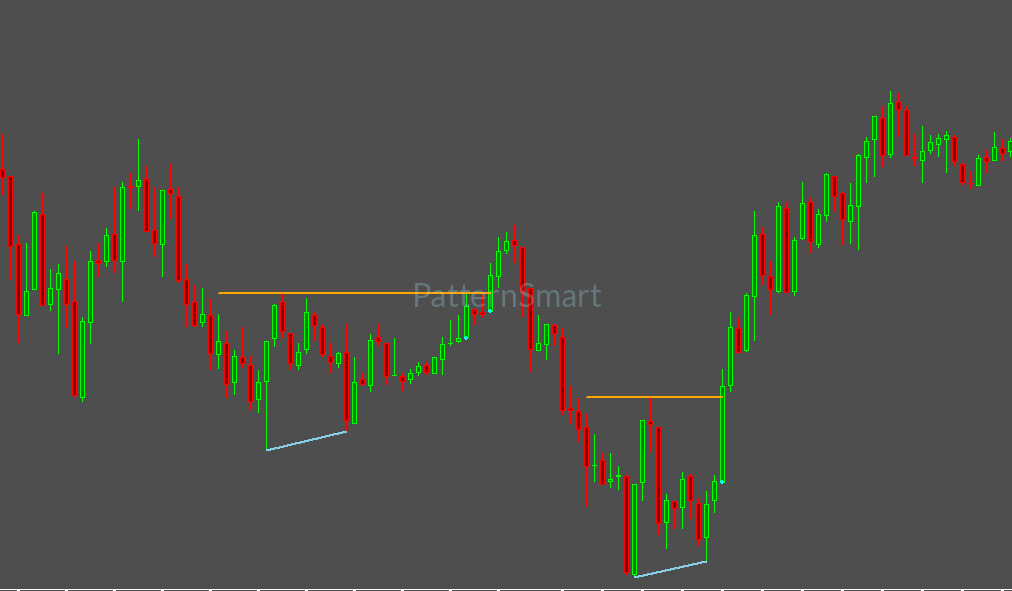
Visual Pattern Projection
The indicator extends detected pattern structures into future chart space, helping traders maintain visibility of important technical levels after a pattern has formed.
This feature supports:
- Future price interaction analysis
- Chart planning
- Technical structure tracking
- Visual reference management
By keeping pattern boundaries visible as the market advances, traders can continue monitoring how price behaves around key technical areas.
Customizable Pattern Visualization
Every trader has unique chart preferences and workspace requirements.
The indicator provides configurable visual settings that allow users to integrate pattern detection seamlessly into their existing Sierra Chart layouts.
Customization options include:
- Pattern line colors
- Extension line colors
- Line thickness settings
- Display preferences
- Historical pattern visibility
- Alert configurations
This flexibility helps ensure that pattern displays remain clear without disrupting existing chart configurations.
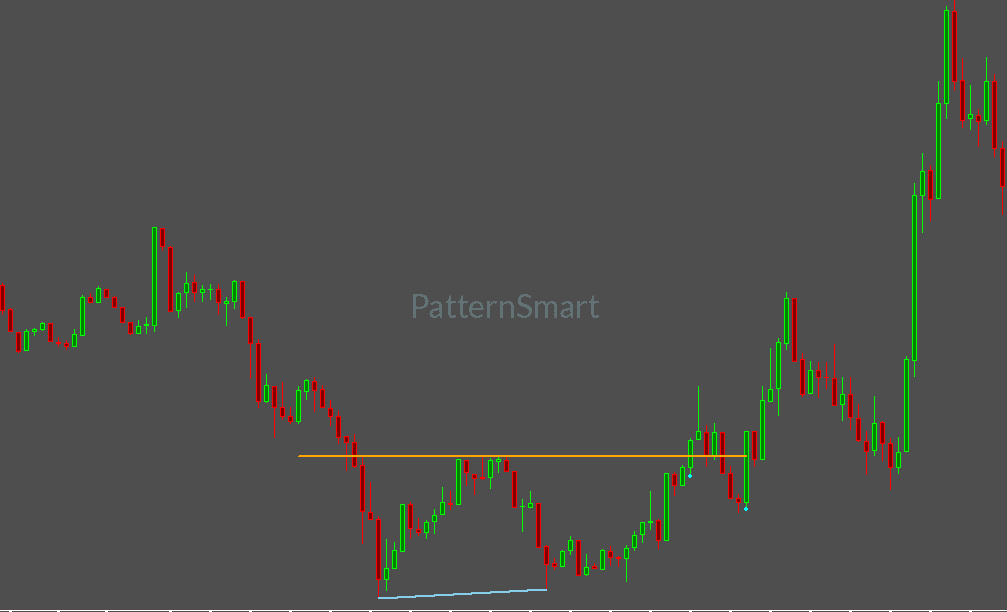
Historical Pattern Analysis
Successful traders often study historical market behavior to better understand pattern performance.
The indicator displays detected Double Bottom formations on historical charts, allowing traders to:
- Review past market activity
- Study pattern characteristics
- Analyze historical reversals
- Refine trading methodologies
- Improve technical analysis skills
Historical pattern visibility transforms the indicator into both a trading and educational tool.
Multiple Pattern Display
Rather than limiting analysis to only the latest formation, the indicator can display multiple historical and active patterns simultaneously.
Benefits include:
- Greater market context
- Pattern comparison
- Enhanced chart structure analysis
- Improved support and resistance evaluation
Traders can efficiently review previous pattern development while monitoring newly detected opportunities.
Alert Functionality
The integrated alert system helps traders stay informed when new Double Bottom patterns are identified.
Alerts can assist with:
- Monitoring multiple markets
- Tracking numerous timeframes
- Reducing screen time
- Improving trading efficiency
- Reacting faster to developing setups
This feature is especially valuable for active traders who scan several instruments throughout the trading session.
Compatible with Multiple Markets
The Double Bottom Chart Pattern Indicator can be used across virtually any market supported by Sierra Chart.
Supported asset classes include:
- Futures
- Stocks
- Forex
- Cryptocurrencies
- Indices
- Commodities
- CFDs
- ETFs
This flexibility allows traders to apply a consistent pattern recognition methodology across a broad range of financial instruments.
Why Use Automated Double Bottom Recognition?
Manual pattern spotting can often lead to inconsistency due to differing interpretations of market structure.
Automated recognition offers several advantages:
- Objective pattern identification
- Consistent analysis criteria
- Faster chart review
- Reduced emotional bias
- Improved productivity
- More efficient market scanning
By automating pattern discovery, traders can spend more time evaluating opportunities and less time searching for them.
Sierra Chart Performance Advantages
Sierra Chart is trusted by serious traders for its speed and reliability.
The Double Bottom Chart Pattern Indicator is designed to operate efficiently within this environment, making it suitable for traders who:
- Run multiple chartbooks
- Analyze numerous symbols
- Use multiple technical studies
- Work with extensive historical data
- Require responsive chart performance
The indicator integrates smoothly into professional trading workspaces without compromising chart usability.
User-Friendly Workflow
The indicator has been developed with simplicity and practical trading applications in mind.
Features include:
- Straightforward installation
- Easy-to-understand settings
- Clean chart presentation
- Professional appearance
- Efficient workflow integration
Whether you are new to chart pattern trading or an experienced technical analyst, the indicator is designed to be immediately useful.
What You Receive
Your purchase includes:
- Double Bottom Chart Pattern Indicator for Sierra Chart
- Compiled installation package
- User documentation
- Configuration guidance
- Product updates according to licensing policy
Source Code Not Included
The product is delivered as a compiled trading indicator.
Customers receive the complete operational indicator for chart analysis and trading support. Access to the source code, development files, or proprietary implementation details is not included.
Why Choose the Double Bottom Chart Pattern Indicator for Sierra Chart?
The Double Bottom Chart Pattern Indicator combines professional-grade pattern recognition with the speed and reliability of Sierra Chart.
By automating one of the most recognized bullish reversal patterns in technical analysis, traders gain a powerful tool for identifying opportunities, improving chart analysis efficiency, and enhancing market awareness.
Whether trading futures, forex, stocks, commodities, or cryptocurrencies, this indicator provides a practical solution for detecting Double Bottom formations directly within the Sierra Chart environment.
Write a review
Your Name:Your Review: Note: HTML is not translated!
Rating: Bad Good
Enter the code in the box below:
Latest





Welcome to Patternsmart
Converting your indicator from one platform to another.Custom Alert, Autotrader, Indicators, Scan, Screener, Strategy and Signals.
Copyright @ 2026 Patternsmart - All rights reserved
This website is for educational and informational
purposes only and should not be considered a solicitation to buy or sell a
futures contract or make any other type of investment decision. It's not recommended to use any single indicator as sole evaluation criteria. The companies
and services listed on this website are not to be considered a recommendation
and it is the reader's responsibility to evaluate any product, service, or
company. patternsmart is not responsible for the accuracy or content of any
product, service or company linked to on this website.
Futures trading
contains substantial risk and is not for every investor.Please read the following risk disclosure before considering the
trading of this product:
Futures Risk Disclosure. An investor could
potentially lose all or more than the initial investment. Risk capital is money
that can be lost without jeopardizing ones financial security or life style.
Only risk capital should be used for trading and only those with sufficient risk
capital should consider trading. Past performance is not necessarily indicative
of future results.
Trading stocks, options, futures and forex involves
speculation, and the risk of loss can be substantial.Investor must consider all
relevant risk factors, including their own personal financial situation, before
trading. Trading foreign exchange on margin carries a high level of risk, as
well as its own unique risk factors. Forex investments are subject to
counter-party risk, as there is no central clearing organization for these
transactions. Please read the following risk disclosure before considering the
trading of this product:
Forex Risk Disclosure. Spreads, Straddles, and other multiple-leg option
strategies can entail substantial transaction costs, including multiple
commissions, which may impact any potential return. Options are not suitable for
all investors as the special risks inherent to options trading may expose
investors to potentially rapid and substantial losses. Prior to trading options,
you should carefully read
Characteristics and Risks of Standardized Options.
patternsmart.com
will not be held liable for the loss of money or any damage caused from relying
on the information on this site. Any investment decision you make in your account is solely your responsibility.
TESTIMONIAL DISCLOSURE: TESTIMONIALS APPEARING ON OUR SITE MAY NOT BE REPRESENTATIVE OF THE EXPERIENCE OF OTHER CLIENTS OR CUSTOMERS AND IS NOT A GUARANTEE OF FUTURE PERFORMANCE OR SUCCESS.