Your shopping cart is empty!
Shopping Cart
0 item(s) - FreeCustomization and Conversion for: MetaTrader(MT4, MT5), Thinkorswim, NinjaTrader, MultiCharts, Tradingview, Prorealtime, SierraChart, etc.
License renew price will be 20% off for the 2nd year and after.
Featured

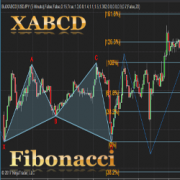
Auto Fibonacci Retracement level indicator for Tradingview

") (
(
This is a Permanent access license, please provide your Tradingview ID along with your payment.
The Fibonacci retracement is also called the golden mean or golden section.
It has been used to analyze the proportions of natural objects as well as man-made systems such as financial markets.
The mathematics of the golden ratio and of the Fibonacci sequence is intimately interconnected. The Fibonacci sequence is:
1, 1, 2, 3, 5, 8, 13, 21, 34, 55, 89, 144, 233, 377, 610, 987, ....
The golden ratio is the limit of the ratios of successive terms of the Fibonacci sequence (or any Fibonacci-like sequence).
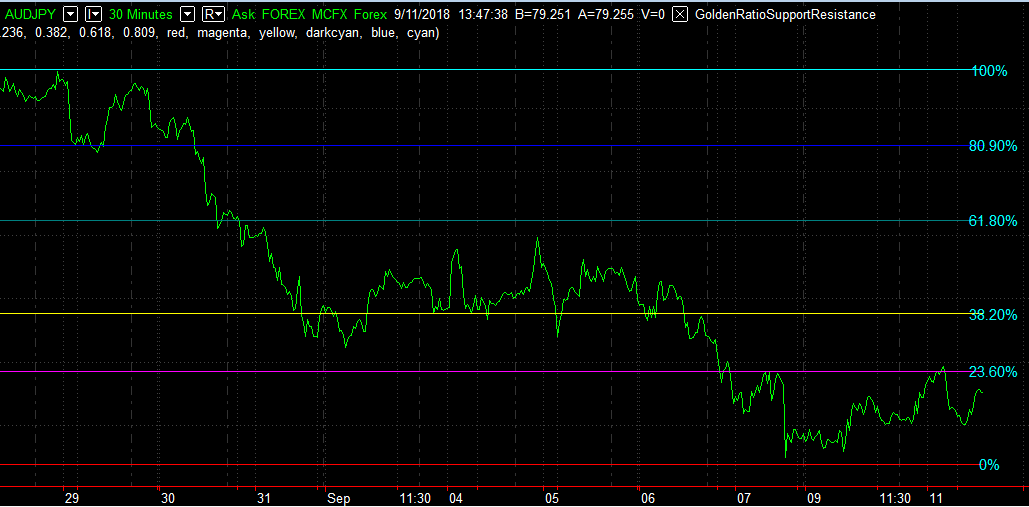
This Fibonacci retracement level indicator automatically plots 7 support and resistance levels on the chart based on a selected number of bars.
How it works?
It shows the Fibonacci retracement support and resistance levels for a given range and display the corresponding ratio on the right side of the levels. The price range and levels are adjustable by user, you can easily identify the major and minor support/resistance levels from the chart with your desired inputs.
.png)
Features and inputs:
- Show Level Label, enable to display the level on chart.
- Range, it's the number of bars used to detect the highest and lowest price. The default value is 300 it means the indicator will plot the Fibonacci retracement based on the price range of last 300 bars.
- If you want to use different ratios other than the default ones, you can change them from input Level1 to Level5.
- You can change the color of each level line from the following available colors: silver, gray, white, maroon, red, purple, fuchsia, green, lime, olive, yellow, navy, blue, teal, aqua, orange.
- The highest and lowest level are auto-detected and can't be changed.
- Line style: you can choose from: Solid, Dotted and Dashed.
1 is Solid like this: ______________________
2 is Dashed - - - - - - - - - - - - - - - - - - -
3 is dotted ............................................
.png)
.png)
.png)
It works on all timeframes and Renko, Heikin Ashi, Bars, Candle and Line chart types.
.png)
.png)
There are also 10 pre-set alert conditions for you to choose.
For example, if you chose "Cross over Level 1", an alert will be triggered when close price cross above level 1.
.png)
Write a review
Your Name:Your Review: Note: HTML is not translated!
Rating: Bad Good
Enter the code in the box below:


Latest


Welcome to Patternsmart
Converting your indicator from one platform to another.Custom Alert, Autotrader, Indicators, Scan, Screener, Strategy and Signals.
Copyright @ 2023 Patternsmart - All rights reserved
This website is for educational and informational
purposes only and should not be considered a solicitation to buy or sell a
futures contract or make any other type of investment decision. It's not recommended to use any single indicator as sole evaluation criteria. The companies
and services listed on this website are not to be considered a recommendation
and it is the reader's responsibility to evaluate any product, service, or
company. patternsmart is not responsible for the accuracy or content of any
product, service or company linked to on this website.
Futures trading
contains substantial risk and is not for every investor.Please read the following risk disclosure before considering the
trading of this product:
Futures Risk Disclosure. An investor could
potentially lose all or more than the initial investment. Risk capital is money
that can be lost without jeopardizing ones financial security or life style.
Only risk capital should be used for trading and only those with sufficient risk
capital should consider trading. Past performance is not necessarily indicative
of future results.
Trading stocks, options, futures and forex involves
speculation, and the risk of loss can be substantial.Investor must consider all
relevant risk factors, including their own personal financial situation, before
trading. Trading foreign exchange on margin carries a high level of risk, as
well as its own unique risk factors. Forex investments are subject to
counter-party risk, as there is no central clearing organization for these
transactions. Please read the following risk disclosure before considering the
trading of this product:
Forex Risk Disclosure. Spreads, Straddles, and other multiple-leg option
strategies can entail substantial transaction costs, including multiple
commissions, which may impact any potential return. Options are not suitable for
all investors as the special risks inherent to options trading may expose
investors to potentially rapid and substantial losses. Prior to trading options,
you should carefully read
Characteristics and Risks of Standardized Options.
patternsmart.com
will not be held liable for the loss of money or any damage caused from relying
on the information on this site. Any investment decision you make in your account is solely your responsibility.
TESTIMONIAL DISCLOSURE: TESTIMONIALS APPEARING ON OUR SITE MAY NOT BE REPRESENTATIVE OF THE EXPERIENCE OF OTHER CLIENTS OR CUSTOMERS AND IS NOT A GUARANTEE OF FUTURE PERFORMANCE OR SUCCESS.