Your shopping cart is empty!
Shopping Cart
0 item(s) - FreeCustomization and Conversion for: MetaTrader(MT4, MT5), Thinkorswim, NinjaTrader, MultiCharts, Tradingview, Prorealtime, SierraChart, etc.
License renew price will be 20% off for the 2nd year and after.
Featured

ABCD uptrend chart pattern indicator with alert for tradingview
.png "ABCD uptrend chart pattern indicator with alert for tradingview")
") (
(Please note that this purchase is a 1-Year license. About License renew.
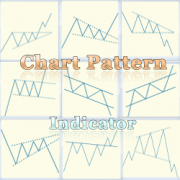
ABCD 4-point chart pattern is a very popular and well known pattern in chart technical analysis, it consists of 4 points and 3 legs.
It exhibits three continued lines in a specific trend. The concept is to compare the retracement level between legs. For example, when leg BC makes a 0.382 or 38.2% Fibonacci retracement of the BA leg or AB, it means that the price difference from point C to B is equal to 38.2% of the price difference from point B to A.
Please note that this indicator is only for ABCD 4-point chart pattern in uptrend, in particular, it must be an uptrend from point A to point B as shown in picture below.
.png)
There are many ways to define its formation, our unique algorithm is based on the following definition:
-
The point A, B and C are swing points and D does not have to be a swing point, but it must reach a given ratio of AB:CD.
-
The ratio of AB:CD is determined by comparing the price difference between C to D and A to B.
Here is the formula to calculate it: |Price of C - Price of D| / |Price of A - Price of B|.
Also, the price difference between B to C and A to B must reach a given ratio, BC:AB calculation is the same as AB:CD.
Point B must be higher than point A in a given percentage.
How it works?
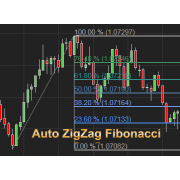
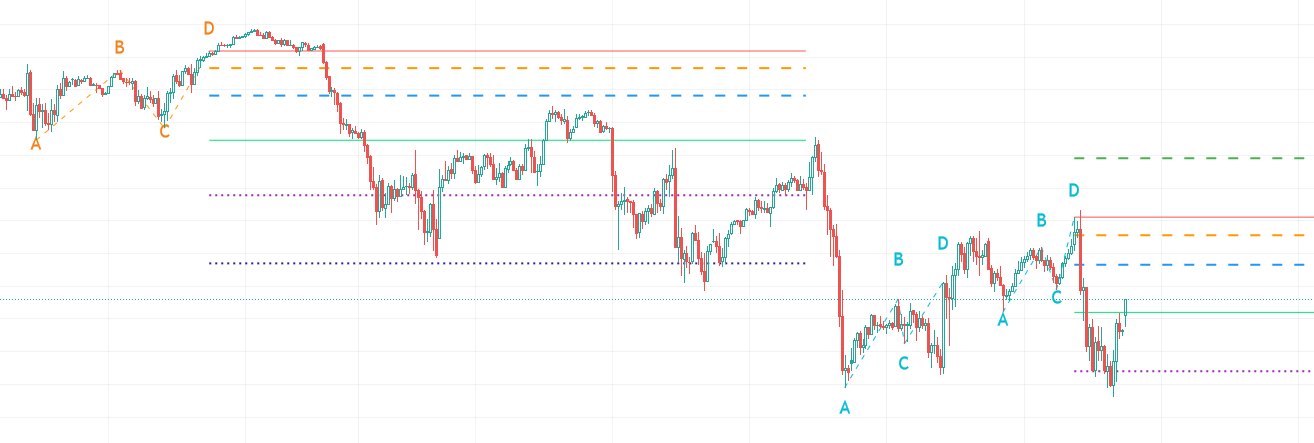
The indicator will automatically detect the ABCD 4-point chart pattern based on the input values we use. It will draw three lines to connect point A, B, C and D once all four points satisfy the condition. It will also display the letter of A, B, C and D above or below in each corresponding bar. The indicator draws seven extension lines from point D as the support and resistance levels. The default levels are based on the Golden Ratio. You can change the ratios from input. The indicator will start to plot the lines as soon as the pattern is confirmed, the trend may continue to go up after the event.
It shows the Fibonacci retracement support and resistance levels for a given range and displays the corresponding ratio on the right side of the levels. The price range and levels are adjustable by user, you can easily identify the major and minor support/resistance levels from the chart with your desired inputs.
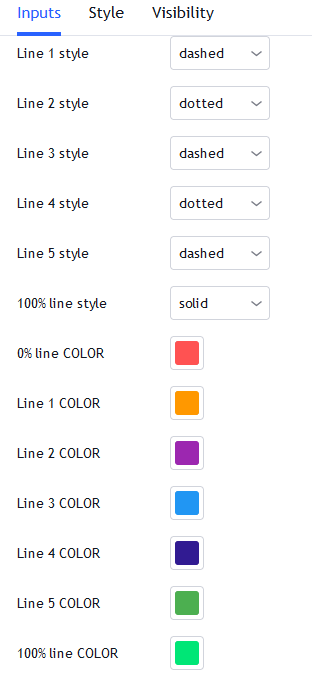
Features and Inputs:
No repaint, all drawing objects show up immediately right after the point D is detected.
Able to show patterns found in history data.
There is a Built-in alert function to easily set up an alert.
Works on all timeframes, including second, minute, hour, day, week, month.
Works on Renko, Heikin Ashi, Range, bar, candle chart types.
- Strength, this input is used to define the minimum number of bars to the left and right side of the swing point. For more details about this input, please check: https://goo.gl/sWBH7k
- B:A Ratio Min in %, this is the minimum price difference in percentage between point B and point A. If we enter 0.3 for this input, the indicator will check if B(swing high) was 0.3% higher than A(swing low).
- B:A Ratio Max in %, this is the maximum price difference in percentage between point B and point A. If we enter 2.5 for this input, the indicator will check if the price difference between point B and point A was less than 2.5%.
- BC:AB Ratio Min in %, this is the minimum ratio in percentage between section BC and AB. Here is the formula to calculate it: |Price of C - Price of B| / |Price of A - Price of B|.
- BC:AB Ratio Max in %, this is the maximum ratio in percentage between section BC and AB. Here is the formula to calculate it: |Price of C - Price of B| / |Price of A - Price of B|.
- CD:AB Ratio Min in %, this is the minimum ratio in percentage between section CD and AB. Here is the formula to calculate it: |Price of C - Price of D| / |Price of A - Price of B|.
- CD:AB Ratio Max in %, this is the maximum ratio in percentage between section CD and AB. Here is the formula to calculate it: |Price of C - Price of D| / |Price of A - Price of B|.
- Extension Range, this is the number of bars extend to the right side of the support and resistance lines, set it to 0 if you want to disable it.
- ABCD letter COLOR, the color of the letter for point A, B, C and D. It's very useful when we use more than one instance of this indicator on the same chart with different input sets. We can easily distinguish them by different letter color.
- ABCD Line COLOR, the color of the lines that connect point A, B, C and D. Similar functionality as the letter color.
- Show Fibo Level labels, enable this input will show up the "0%" and "100%" as label on corresponding Fibonacci levels.
- Level 1 to 5, are the support and resistance levels in percentage, please use negative value if you need a level below 0%, such as -61.8 means 61.8% below level 0%. The level 0% is the price level at Point A, and the level 100% is the price level at Point D, these two levels are fixed once the pattern formed.
- You can change the color of each level line from the following colors: silver, gray, white, maroon, red, purple, fuchsia, green, lime, olive, yellow, navy, blue, teal, aqua and orange.
- Line style: you can choose from: Solid, Dotted and Dashed.
1 is Solid like this: ______________________
2 is Dashed - - - - - - - - - - - - - - - - - - -
3 is dotted ............................................

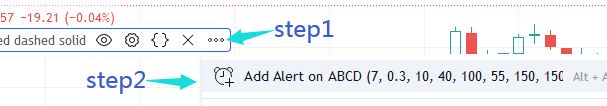
How to set up alert:
It's very easy to set up an alert, just follow the 2 steps below.
- Move your mouse pointer to the right end of the indicator name. Then click the three dots, as "step1" in the picture below.
- Click the only option as "step2" in the picture below.
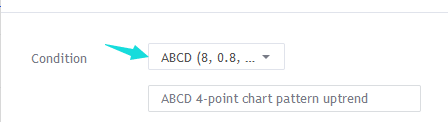
You can also add the alert from top menu strip. Make sure you select the Condition as shown in pic below:
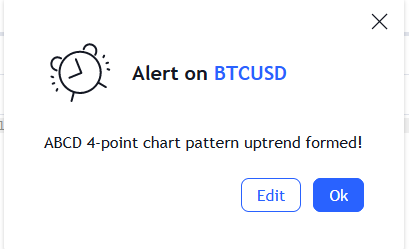
You will get an alert message popup on the chart when there is an ABCD trend chart pattern detected.
Sometimes, we may need to focus on a particular pattern, which may require strict ratio parameters.
If we only want to detect an ABCD pattern, which qualify the following rules:
- There must be at least 10 bars on both left and right sides of point A, B and C.
- The price must raise around 0.8% from point A to point B
- The ratio BC:AB must be around 70%
- CD must have similar price difference of AB, in other words, price difference between point C and D should be similar to price difference between point A and B.
Then we can use the following inputs to detect such a pattern:
We need to enter 10 for the strength input value.
The price must raise around 0.8% from point A. We can use 0.75 for the min ratio of B:A and 0.85 for the max ratio of B:A, since 0.8 is between of 0.75 and 0.85. The value is in percentage, so 0.05 is only 0.05%, which is a very small amount of price change.
We should not simply use 100% for CD:AB ratio. The best way is to give a range from the min to the max percentage, since in real life we can hardly find any pattern has exact 100% as the CD:AB ratio.
Most of the time, the CD:AB ratio could be near 100%, such as 96%, 99% or 102%, so using 95% to 105% is a relatively reasonable range.
The picture below shows the indicator with the inputs we mentioned above, and the detected ABCD pattern.

Please note that, only the latest found pattern will show the Fibonacci levels. The patterns found in history will only show the lines that connect the A, B, C and D points and the letters, as shown in the pic below.
.png)
.png)
.png)
.png)
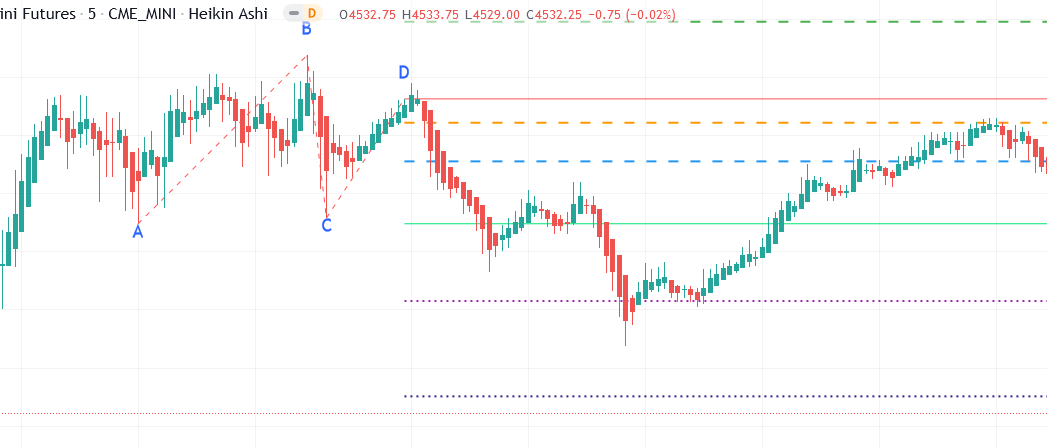
Example of using the indicator on Heikin Ashi chart.
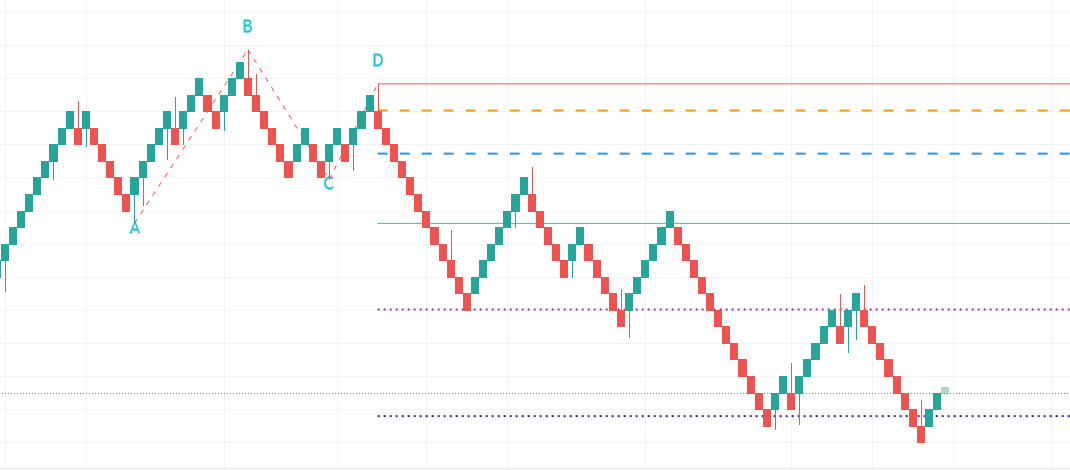
Example of using the indicator on Renko chart.
Write a review
Your Name:Your Review: Note: HTML is not translated!
Rating: Bad Good
Enter the code in the box below:


Latest


Welcome to Patternsmart
Converting your indicator from one platform to another.Custom Alert, Autotrader, Indicators, Scan, Screener, Strategy and Signals.
Copyright @ 2023 Patternsmart - All rights reserved
This website is for educational and informational
purposes only and should not be considered a solicitation to buy or sell a
futures contract or make any other type of investment decision. It's not recommended to use any single indicator as sole evaluation criteria. The companies
and services listed on this website are not to be considered a recommendation
and it is the reader's responsibility to evaluate any product, service, or
company. patternsmart is not responsible for the accuracy or content of any
product, service or company linked to on this website.
Futures trading
contains substantial risk and is not for every investor.Please read the following risk disclosure before considering the
trading of this product:
Futures Risk Disclosure. An investor could
potentially lose all or more than the initial investment. Risk capital is money
that can be lost without jeopardizing ones financial security or life style.
Only risk capital should be used for trading and only those with sufficient risk
capital should consider trading. Past performance is not necessarily indicative
of future results.
Trading stocks, options, futures and forex involves
speculation, and the risk of loss can be substantial.Investor must consider all
relevant risk factors, including their own personal financial situation, before
trading. Trading foreign exchange on margin carries a high level of risk, as
well as its own unique risk factors. Forex investments are subject to
counter-party risk, as there is no central clearing organization for these
transactions. Please read the following risk disclosure before considering the
trading of this product:
Forex Risk Disclosure. Spreads, Straddles, and other multiple-leg option
strategies can entail substantial transaction costs, including multiple
commissions, which may impact any potential return. Options are not suitable for
all investors as the special risks inherent to options trading may expose
investors to potentially rapid and substantial losses. Prior to trading options,
you should carefully read
Characteristics and Risks of Standardized Options.
patternsmart.com
will not be held liable for the loss of money or any damage caused from relying
on the information on this site. Any investment decision you make in your account is solely your responsibility.
TESTIMONIAL DISCLOSURE: TESTIMONIALS APPEARING ON OUR SITE MAY NOT BE REPRESENTATIVE OF THE EXPERIENCE OF OTHER CLIENTS OR CUSTOMERS AND IS NOT A GUARANTEE OF FUTURE PERFORMANCE OR SUCCESS.