Popular tags: Support, Resistance, Trend, Range, Fibonacci, Wave, Divergence, Multi time frames(MTF), Swing, Volume, Overbought, Oversold
Customization and Conversion for: MetaTrader(MT4, MT5), Thinkorswim, NinjaTrader, MultiCharts, Tradingview, Prorealtime, SierraChart, etc.
License renew price will be 20% off for the 2nd year and after.


Swing high low extension indicator for SierraChart 1 Year license.

Swing high low extension indicator for SierraChart 1 Year license.
Availability: In Stock
Price: $90.00USD $50.00USD

Available Options


* Platform's ID:

Qty:     - OR -   Add to Wish List
Add to Compare
0 (0/5)  0 reviews  |  Write a review

This purchase is a 1-Year license. About License renew.
 

The Swing High/Swing Low Extension indicator is a powerful and advanced tool that moves beyond simple pattern recognition to provide quantified price targets and dynamic support/resistance levels. Its usefulness lies in its ability to project where price is likely to go after a swing is confirmed, making it invaluable for profit-taking and risk management.

Here's a detailed breakdown of why it's so useful for traders.

1. It Provides Measured, Objective Price Targets

This is the core function of the tool. While patterns like flags or heads and shoulders give a one-time static target, swing extensions can project multiple targets and are dynamic.

  • What it does: The indicator automatically identifies significant Swing Highs (peaks) and Swing Lows (troughs). 

  • Why it's useful: It removes the guesswork from setting profit targets. Instead of wondering "how far this could go," you have pre-defined, mathematically derived levels where price is likely to react.

2. It Identifies High-Probability Reversal Zones (Potential Resistance/Support)

Swing extension levels act as powerful potential support in an uptrend and resistance in a downtrend.

  • What it does: After a pullback (a new swing low in an uptrend), the tool will project extension levels from the initial swing up. 

  • Why it's useful: It allows you to anticipate where the next battle between buyers and sellers might occur. You can look for bearish reversal candlestick patterns (like a bearish engulfing or doji) at a extension to exit long positions or even consider short entries.

3. It Helps in Strategic Trade Management

This tool provides a framework for managing every aspect of a trade.

  • Entry: While not typically an entry tool itself, it can help. For example, entering a long position on a pullback with a target at the extension of the previous swing up.

  • Profit-Taking: As mentioned, it provides clear, tiered targets.

  • Stop-Loss Placement: The most logical stop-loss for a trade targeting a swing extension is often just beyond the most recent swing low (for a long trade). This defines your risk precisely.

  • Why it's useful: It creates a complete "if-then" plan. *"IF price reaches the extension, THEN I will sell half my position and move my stop-loss to break-even."* This eliminates emotional decision-making.

4. It Works on Any Timeframe and Any Market

The principles of swing points and Fibonacci ratios are universal.

  • What it does: Whether you're a day trader on a 5-minute chart or a long-term investor on a weekly chart, the indicator identifies the same structural points.

  • Why it's useful: The methodology is consistent and scalable. A swing trade on a daily chart is managed the same way as a scalp on a 1-minute chart, making it a versatile core strategy for all trading styles.


Practical Trading Example (Bullish Scenario)

Let's walk through a long trade using swing extensions.

  1. Identify the Swing:

    • Stock XYZ rallies from a Swing Low (A) at $100 to a Swing High (B) at $120.

    • It then pulls back to a new Swing Low (C) at $110.

  2. Set the Extension Tool:

    • You apply the indicator from Point A ($100) to Point B ($120), and it projects targets based on that $20 move.

    • The tool automatically draws key levels:

      • 100% Extension: $120 + $20 = $140

      • 127.2% Extension: $120 + ($20 * 1.272) = $145.44

      • 161.8% Extension: $120 + ($20 * 1.618) = $152.36

  3. Execute the Trade:

    • Entry: You go long at $110 (the pullback to point C).

    • Stop-Loss: You place your stop at $109, just below Swing Low C. Risk = $1 per share.

    • Profit Targets:

      • Target 1: Sell ½ position at $140. Profit = $30 per share on that portion.

      • Target 2: Sell remaining ½ at $145.44. Profit = $35.44 per share.

    • Move Stop: After reaching $140, you move your stop-loss to breakeven ($110), guaranteeing a profit on the remainder.

  4. Risk-to-Reward Analysis:

    • Your initial risk was $1.

    • Your average profit was ($30 + $35.44)/2 = $32.72 per share.

    • This is an exceptional 32:1 risk-to-reward ratio on the initial risk, managed correctly.

Crucial Limitations and Tips for Use

  • Not a Standalone Signal: The extension tool is not an entry indicator. It is a projection and management tool. You must use it in conjunction with other confirming signals for entry (e.g., trend, momentum divergences, candlestick patterns).

  • Which Swing to Use?: The biggest challenge is selecting the correct Swing High and Swing Low to measure from. Using the most recent major swing is typically the best practice. The indicator can sometimes become "cluttered" with many levels; focus on the most relevant ones.

  • It's a Zone, Not a Pinpoint: The extension levels are areas of probability, not exact prices. Price may reverse slightly before or after hitting the exact level.

  • Fibonacci is Key: The most common and reliable extensions are derived from Fibonacci ratios (127.2%, 161.8%). The 100% extension is also a strong psychological target.

Summary: Why the Swing High/Low Extension Indicator is Useful

In essence, this tool is useful because it:

  1. Quantifies Moves: Turns price swings into measurable projections.

  2. Identifies Turning Points: Pinpoints high-probability areas for trend pauses or reversals.

  3. Enforces Discipline: Provides a structured plan for profit-taking and stop-loss management, removing emotion.

  4. Is Universally Applicable: Works on all timeframes and markets, from forex to stocks to cryptocurrencies.

It is the ultimate tool for traders who have moved beyond simple entry signals and want to master the more nuanced art of trade management and strategic exit planning.


This swing high low extension indicator works the same way as my Swing High Low extension indicator on other platforms such as TOS and Tradingview.


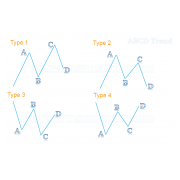
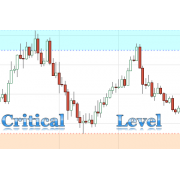
The Swing high low extension indicator will plot lines that represent the swing high low points based on the swing strength input(number of bars to the left and right of the swing point).


Swing highs and lows can be used by traders to identify possible areas of support and resistance, which can then be used to determine optimal positions for stop-loss or profit target orders. If an indicator fails to create a new swing high while the price of the security does reach a new high, there is a divergence between price and indicator, which could be a signal that the trend is reversing.


Swing highs and swing lows are earlier market turning points. Hence, they are natural choices for projecting support and resistance levels. Every swing point is a potential support or resistance level. However, for effective trading, focus on major swing highs and lows.


Features and inputs:

  • Using different value for swing high strength and swing low strength.
    Strength is the minimum number of bars to the left and right side of the swing point.


Write a review

Your Name:


Your Review: Note: HTML is not translated!

Rating: Bad           Good

Enter the code in the box below:


Tags: swing
Welcome to Patternsmart
Converting your indicator from one platform to another.

Custom Alert, Autotrader, Indicators, Scan, Screener, Strategy and Signals.


Copyright @ 2025 Patternsmart - All rights reserved


This website is for educational and informational purposes only and should not be considered a solicitation to buy or sell a futures contract or make any other type of investment decision. It's not recommended to use any single indicator as sole evaluation criteria. The companies and services listed on this website are not to be considered a recommendation and it is the reader's responsibility to evaluate any product, service, or company. patternsmart is not responsible for the accuracy or content of any product, service or company linked to on this website.

Futures trading contains substantial risk and is not for every investor.Please read the following risk disclosure before considering the trading of this product: Futures Risk Disclosure. An investor could potentially lose all or more than the initial investment. Risk capital is money that can be lost without jeopardizing ones financial security or life style. Only risk capital should be used for trading and only those with sufficient risk capital should consider trading. Past performance is not necessarily indicative of future results.

Trading stocks, options, futures and forex involves speculation, and the risk of loss can be substantial.Investor must consider all relevant risk factors, including their own personal financial situation, before trading. Trading foreign exchange on margin carries a high level of risk, as well as its own unique risk factors. Forex investments are subject to counter-party risk, as there is no central clearing organization for these transactions. Please read the following risk disclosure before considering the trading of this product: Forex Risk Disclosure. Spreads, Straddles, and other multiple-leg option strategies can entail substantial transaction costs, including multiple commissions, which may impact any potential return. Options are not suitable for all investors as the special risks inherent to options trading may expose investors to potentially rapid and substantial losses. Prior to trading options, you should carefully read Characteristics and Risks of Standardized Options.

patternsmart.com will not be held liable for the loss of money or any damage caused from relying on the information on this site. Any investment decision you make in your account is solely your responsibility.
TESTIMONIAL DISCLOSURE: TESTIMONIALS APPEARING ON OUR SITE MAY NOT BE REPRESENTATIVE OF THE EXPERIENCE OF OTHER CLIENTS OR CUSTOMERS AND IS NOT A GUARANTEE OF FUTURE PERFORMANCE OR SUCCESS.