Your shopping cart is empty!
Shopping Cart
0 item(s) - FreeCustomization and Conversion for: MetaTrader(MT4, MT5), Thinkorswim, NinjaTrader, MultiCharts, Tradingview, Prorealtime, SierraChart, etc.
License renew price will be 20% off for the 2nd year and after.
Featured
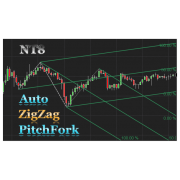
ZigZag Session High Low Indicator for NinjaTrader 7 1 year license


") (
(VIP price: $59 1 year license.
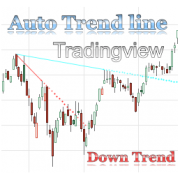
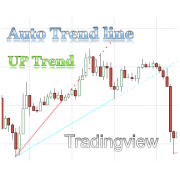
Note that the last segment of the plot can change its direction drastically, as a considerable future market move might occur.
Please make sure you understand the mechanism of zigzag before purchasing this indicator.
This indicator is a perfect tool to highlight important chart patterns and confirm possible trend reversals.
It is easy to understand and apply. It will give signals when price change exceeds a pre-defined percentage.
This indicator looks like the 3 Level ZZ Semafor in MT4, but more powerful. Not only, you can set as many levels as you need,
you can also define the level symbol to any chars you want.
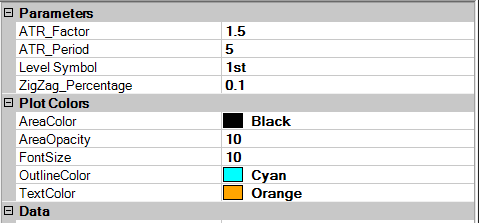
Features and Parameters:
- ZigZag_Percentage: ZigZag Percentage factor, if sets to 0, it will only use ATR.
- ATR_Period: # of bars ATR in a pre-defined time period.
- ATR_Factor: ATR factor, if sets to 0, it will only use percentage.
- Level Symbol: ZigZag Level symbol text, can be '1' or '2' or '1st' or '2nd' or any other chars
- FontSize: font Size of the zigzag percentage.
- TextColor: Color of the zigzag percentage.
- OutlineColor: Text box outline color of the zigzag percentage.
- AreaColor: Text box fill color of the zigzag percentage.
- AreaOpacity: Level of transparency for the fill color. Valid between 0 - 10. (0 = completely transparent, 10 = no opacity)
How to use:
- Load this indicator on chart.
- If you want to set price change less than 0.2% as level 1, then set ZigZag_Percentage to 0.2 and set 'Level Symbol' to '1' or any other chars. The indicator will highlight all swing points which greater than 0.2%.
- If you need more than 1 level of ZigZag Session High Low, then load this indicator 1 more time.
If you want to set price change less than 0.4% as level 2, then set ZigZag_Percentage to 0.4 and set 'Level Symbol' to '2' or any other chars(such as '2nd'). The indicator will highlight all swing points which greater than 0.4%.
The calculation is based on the ZigZag algorithm. A zigZag plot connects swing points if the difference between their prices exceeds a specified value which is equal to the pre-defined percentage of price change plus Average True Range (ATR) multiplied by a factor. Note that the last segment of the plot can change its direction drastically, as a considerable future market move might occur. (source: Thinkorswim)
If you want to add any feature to this indicator, please send us a Customization request.
Write a review
Your Name:Your Review: Note: HTML is not translated!
Rating: Bad Good
Enter the code in the box below:


Latest


Welcome to Patternsmart
Converting your indicator from one platform to another.Custom Alert, Autotrader, Indicators, Scan, Screener, Strategy and Signals.
Copyright @ 2023 Patternsmart - All rights reserved
This website is for educational and informational
purposes only and should not be considered a solicitation to buy or sell a
futures contract or make any other type of investment decision. It's not recommended to use any single indicator as sole evaluation criteria. The companies
and services listed on this website are not to be considered a recommendation
and it is the reader's responsibility to evaluate any product, service, or
company. patternsmart is not responsible for the accuracy or content of any
product, service or company linked to on this website.
Futures trading
contains substantial risk and is not for every investor.Please read the following risk disclosure before considering the
trading of this product:
Futures Risk Disclosure. An investor could
potentially lose all or more than the initial investment. Risk capital is money
that can be lost without jeopardizing ones financial security or life style.
Only risk capital should be used for trading and only those with sufficient risk
capital should consider trading. Past performance is not necessarily indicative
of future results.
Trading stocks, options, futures and forex involves
speculation, and the risk of loss can be substantial.Investor must consider all
relevant risk factors, including their own personal financial situation, before
trading. Trading foreign exchange on margin carries a high level of risk, as
well as its own unique risk factors. Forex investments are subject to
counter-party risk, as there is no central clearing organization for these
transactions. Please read the following risk disclosure before considering the
trading of this product:
Forex Risk Disclosure. Spreads, Straddles, and other multiple-leg option
strategies can entail substantial transaction costs, including multiple
commissions, which may impact any potential return. Options are not suitable for
all investors as the special risks inherent to options trading may expose
investors to potentially rapid and substantial losses. Prior to trading options,
you should carefully read
Characteristics and Risks of Standardized Options.
patternsmart.com
will not be held liable for the loss of money or any damage caused from relying
on the information on this site. Any investment decision you make in your account is solely your responsibility.
TESTIMONIAL DISCLOSURE: TESTIMONIALS APPEARING ON OUR SITE MAY NOT BE REPRESENTATIVE OF THE EXPERIENCE OF OTHER CLIENTS OR CUSTOMERS AND IS NOT A GUARANTEE OF FUTURE PERFORMANCE OR SUCCESS.