Your shopping cart is empty!
Shopping Cart
0 item(s) - FreeCustomization and Conversion for: MetaTrader(MT4, MT5), Thinkorswim, NinjaTrader, MultiCharts, Tradingview, Prorealtime, SierraChart, etc.
License renew price will be 20% off for the 2nd year and after.
Featured
Multi time frame(MTF) Parabolic SAR indicator for thinkorswim TOS.
 Parabolic SAR indicator for thinkorswim TOS.")
 Parabolic SAR indicator for thinkorswim TOS.")
 Parabolic SAR indicator for thinkorswim TOS.")
 Parabolic SAR indicator for thinkorswim TOS.")
 Parabolic SAR indicator for thinkorswim TOS.")
 Parabolic SAR indicator for thinkorswim TOS.")
 Parabolic SAR indicator for thinkorswim TOS.")
 Parabolic SAR indicator for thinkorswim TOS.")
 Parabolic SAR indicator for thinkorswim TOS.")
 Parabolic SAR indicator for thinkorswim TOS.")
") (
(Free for VIP member only.
Please note that it does not work on Tick and Range type chart, it only works on Time based chart.
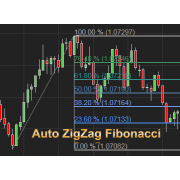
The Parabolic SAR (Stop And Reverse) technical indicator is a study for analyzing trending markets.
Acceleration limit: The maximum value of the acceleration factor.
Please note that it does not work on Tick and Range type chart, it only works on Time based chart.
The Parabolic SAR (Stop And Reverse) technical indicator is a study for analyzing trending markets.
When the price is in an uptrend, the SAR appears below the price and converges upwards towards it. Similarly, on a downtrend, the SAR appears above the price and converges downwards.
If the price crosses Parabolic SAR lines, the indicator switches so that its further values are located on the other side of the price. When such an indicator switch occurs, the maximum or the minimum price for the previous period would serve as the starting point. When the indicator switches, it indicates the trend end (correction stage or flattening) or the trend reversal.
With this MTF version Parabolic SAR, you can apply any time frame of Parabolic SAR to your current chart.
As long as the selected time frame is greater than the current time frame.
You can have 30 minutes or 60 minutes Parabolic SAR on a 5 minutes chart, or having weekly Parabolic SAR on Daily chart.
Input Parameters
acceleration factor: The initial value of the acceleration factor.Acceleration limit: The maximum value of the acceleration factor.
All time frames:
- MIN
- TWO_MIN
- THREE_MIN
- FOUR_MIN
- FIVE_MIN
- TEN_MIN
- FIFTEEN_MIN
- TWENTY_MIN
- THIRTY_MIN
- HOUR
- TWO_HOURS
- FOUR_HOURS
- DAY
- TWO_DAYS
- THREE_DAYS
- FOUR_DAYS
- WEEK
- MONTH
- OPT_EXP
Write a review
Your Name:Your Review: Note: HTML is not translated!
Rating: Bad Good
Enter the code in the box below:


Latest


Welcome to Patternsmart
Converting your indicator from one platform to another.Custom Alert, Autotrader, Indicators, Scan, Screener, Strategy and Signals.
Copyright @ 2023 Patternsmart - All rights reserved
This website is for educational and informational
purposes only and should not be considered a solicitation to buy or sell a
futures contract or make any other type of investment decision. It's not recommended to use any single indicator as sole evaluation criteria. The companies
and services listed on this website are not to be considered a recommendation
and it is the reader's responsibility to evaluate any product, service, or
company. patternsmart is not responsible for the accuracy or content of any
product, service or company linked to on this website.
Futures trading
contains substantial risk and is not for every investor.Please read the following risk disclosure before considering the
trading of this product:
Futures Risk Disclosure. An investor could
potentially lose all or more than the initial investment. Risk capital is money
that can be lost without jeopardizing ones financial security or life style.
Only risk capital should be used for trading and only those with sufficient risk
capital should consider trading. Past performance is not necessarily indicative
of future results.
Trading stocks, options, futures and forex involves
speculation, and the risk of loss can be substantial.Investor must consider all
relevant risk factors, including their own personal financial situation, before
trading. Trading foreign exchange on margin carries a high level of risk, as
well as its own unique risk factors. Forex investments are subject to
counter-party risk, as there is no central clearing organization for these
transactions. Please read the following risk disclosure before considering the
trading of this product:
Forex Risk Disclosure. Spreads, Straddles, and other multiple-leg option
strategies can entail substantial transaction costs, including multiple
commissions, which may impact any potential return. Options are not suitable for
all investors as the special risks inherent to options trading may expose
investors to potentially rapid and substantial losses. Prior to trading options,
you should carefully read
Characteristics and Risks of Standardized Options.
patternsmart.com
will not be held liable for the loss of money or any damage caused from relying
on the information on this site. Any investment decision you make in your account is solely your responsibility.
TESTIMONIAL DISCLOSURE: TESTIMONIALS APPEARING ON OUR SITE MAY NOT BE REPRESENTATIVE OF THE EXPERIENCE OF OTHER CLIENTS OR CUSTOMERS AND IS NOT A GUARANTEE OF FUTURE PERFORMANCE OR SUCCESS.